

Paper Menu >>
Journal Menu >>
 Vol.3, No.9, 775-782 (2011) Natural Science http://dx.doi.org/10.4236/ns.2011.39102 Copyright © 2011 SciRes. OPEN ACCESS Heavy metals pollution in sediment cores from the Gulf of Aqaba, Red Sea Tariq Al-Najjar1*, Mohamad Rasheed2, Zaid Ababneh3, Anas Ababneh3, Hosam Al-Omarey3 1Faculty of Marine Sciences, Department of Marine Biology, Jordan University, Aqaba Branch, Aqaba, Jordan; *Correspondence Author: [email protected] 2Marine Science Station, Aqaba, Jordan; 3Physics Department, Yarmouk University, Irbid, Jordan. Received 9 August 2011; revised 11 September 2011; accepted 25 September 2011. ABSTRACT The distribution of metals (Cd, Cr, Pb, Cu, Ni and Zn) was determined in sediment cores collected from five major areas representing different an- thropogenic activities along the Jordanian coast during 27 February-11 March 2008. Metal con- centrations in these sediments were relatively low compared to reported values from polluted areas. At some of the sites metal concentrations showed fluctuations with depth in the core suggesting changes in metal loading with time. The calculated contamination factors (CFs) for the suite of metals decreased in the following order Cd > Pb > Cr > Ni > Zn > Cu. The Pollution Loading Index (PLI) calculated for the different areas were highest at Phosphate Loading Berth (0.008, 0.2607, 0.0161, 0.007, 47.9375 and 0.0296 for Cu, Pb, Ni, Zn, Cd and Cr, respectively) and lowest at Hotel Area (0.0001, 0.0075, 0.0008, 0.0006, 1.0483 and 0.0005 for Cu, Pb, Ni, Zn, Cd and Cr, respectively) with others sites between these extremes. Result of this study could be used to assess the magnitude of pollution at each site and guide rational management deci- sions. Moreover, the data constitutes a baseline against which future anthropogenic effects can be assessed. Keywords: Metals; Core sediments; Pollution Loading Index; Contamination Factor; Gulf of Aqaba; Red Sea 1. INTRODUCTION Within rapid industrialization and economic develop- ment in coastal areas around the world heavy metals are introduced to the coastal environment [1,2]. Studies have been curried to evaluate heavy metal distribution in sur- face sediments to assess the degree of pollution in the marine environment [3,4]. Heavy metals are transported as either dissolve species in water or in association with suspended sediments and are subsequently deposited and stored in bottom sediments. After burial some the distri- bution of some redox sensitive metal could be modified by natural processes in the sediment. The bioaccumula- tion of heavy metals in coastal sediments can be hazar- dous to the local population which uses the coast area for fishing and recreation activities [5,6]. Metal abundance in sediments cores can provide a historical record of changes in metal contamination over time and their rela- tion to historical changes in land use and anthropogenic activity [7,8]. Specifically, if the sediment core is intact and sediments remain undisturbed by human activities or extensive bioturbation then a continuous record over time could be obtained [6,9]. Most of the previous stu- dies, dealing with levels of heavy metal pollution in the coastal areas along the Jordanian coast focused on relat- ing heavy metals in surface sediments to those seen in living organisms such as algae and seagrass [10], sea urchin [11] and sea cucumber [12]. The objective of this work is to study the concentration of six metals nickel (Ni), copper (Cu), lead (Pb), zinc (Zn), cadmium (Cd) and chromium (Cr) in sediment cores collected at 3 water depths (5, 15 and 35 m) at five sites characterized by various industrial and tourism activities along the Jorda- nian coast of the Gulf of Aqaba. These data will provide a historical record of spatial and temporal changes in metal pollution. To quantify the magnitude of pollution two measures were employed: Contamination Factor (CF) and Pollution Load Index (PLI). 2. METHODS 2.1. Study Area The Gulf of Aqaba is the north eastern segment of the Red Sea. It is located between 28˚ - 29˚30'N and 34˚30' - 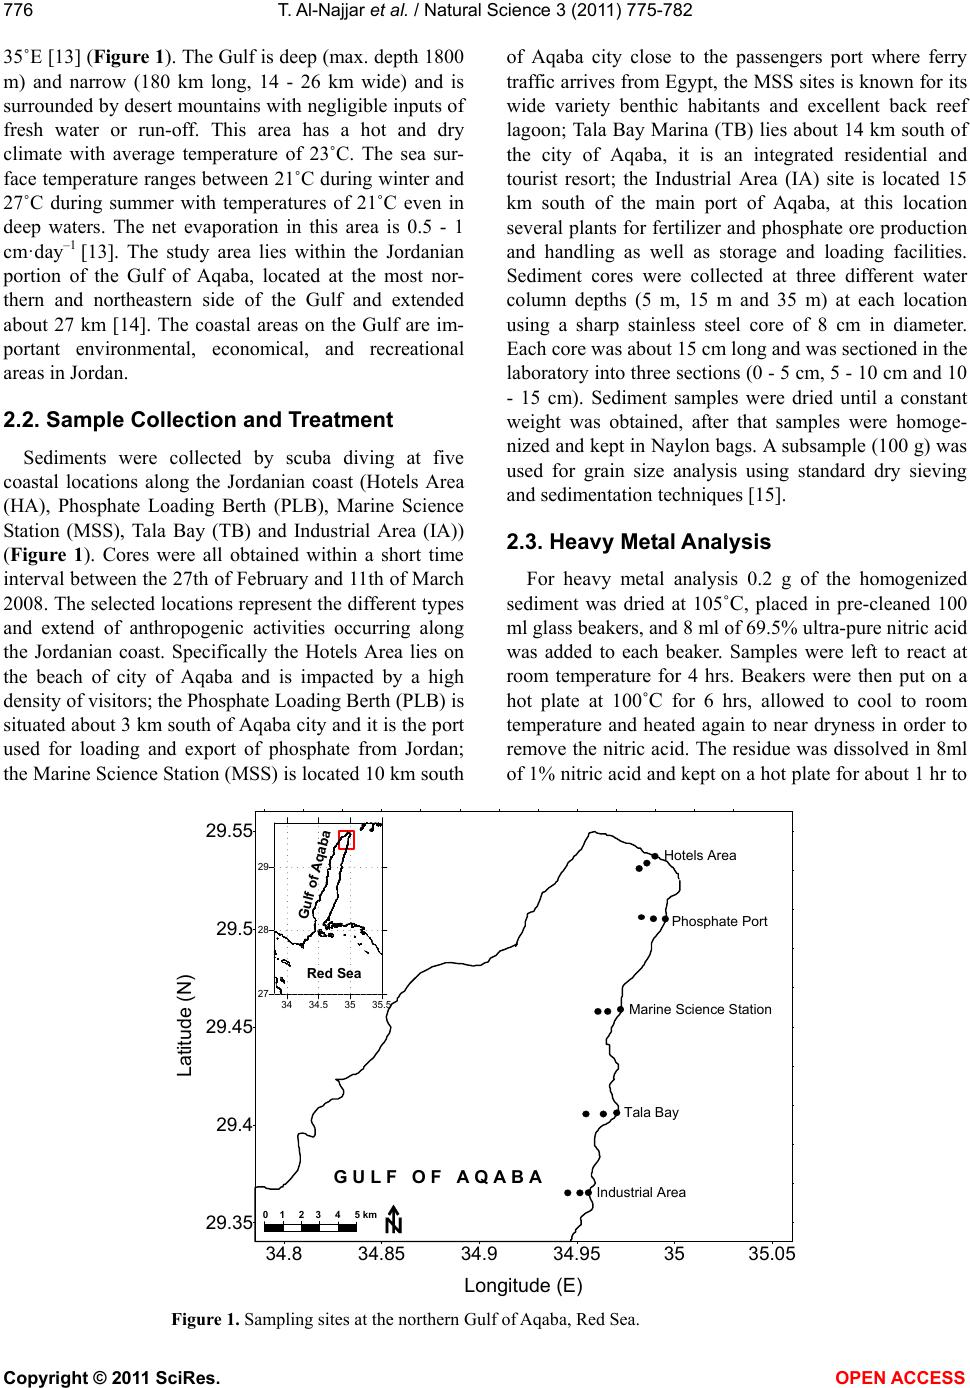 T. Al-Najjar et al. / Natural Science 3 (2011) 775-782 Copyright © 2011 SciRes. OPEN ACCESS 776 35˚E [13] (Figure 1). The Gulf is deep (max. depth 1800 m) and narrow (180 km long, 14 - 26 km wide) and is surrounded by desert mountains with negligible inputs of fresh water or run-off. This area has a hot and dry climate with average temperature of 23˚C. The sea sur- face temperature ranges between 21˚C during winter and 27˚C during summer with temperatures of 21˚C even in deep waters. The net evaporation in this area is 0.5 - 1 cm·day–1 [13]. The study area lies within the Jordanian portion of the Gulf of Aqaba, located at the most nor- thern and northeastern side of the Gulf and extended about 27 km [14]. The coastal areas on the Gulf are im- portant environmental, economical, and recreational areas in Jordan. 2.2. Sample Collection and Treatment Sediments were collected by scuba diving at five coastal locations along the Jordanian coast (Hotels Area (HA), Phosphate Loading Berth (PLB), Marine Science Station (MSS), Tala Bay (TB) and Industrial Area (IA)) (Figure 1). Cores were all obtained within a short time interval between the 27th of February and 11th of March 2008. The selected locations represent the different types and extend of anthropogenic activities occurring along the Jordanian coast. Specifically the Hotels Area lies on the beach of city of Aqaba and is impacted by a high density of visitors; the Phosphate Loading Berth (PLB) is situated about 3 km south of Aqaba city and it is the port used for loading and export of phosphate from Jordan; the Marine Science Station (MSS) is located 10 km south of Aqaba city close to the passengers port where ferry traffic arrives from Egypt, the MSS sites is known for its wide variety benthic habitants and excellent back reef lagoon; Tala Bay Marina (TB) lies about 14 km south of the city of Aqaba, it is an integrated residential and tourist resort; the Industrial Area (IA) site is located 15 km south of the main port of Aqaba, at this location several plants for fertilizer and phosphate ore production and handling as well as storage and loading facilities. Sediment cores were collected at three different water column depths (5 m, 15 m and 35 m) at each location using a sharp stainless steel core of 8 cm in diameter. Each core was about 15 cm long and was sectioned in the laboratory into three sections (0 - 5 cm, 5 - 10 cm and 10 - 15 cm). Sediment samples were dried until a constant weight was obtained, after that samples were homoge- nized and kept in Naylon bags. A subsample (100 g) was used for grain size analysis using standard dry sieving and sedimentation techniques [15]. 2.3. Heavy Metal Analysis For heavy metal analysis 0.2 g of the homogenized sediment was dried at 105˚C, placed in pre-cleaned 100 ml glass beakers, and 8 ml of 69.5% ultra-pure nitric acid was added to each beaker. Samples were left to react at room temperature for 4 hrs. Beakers were then put on a hot plate at 100˚C for 6 hrs, allowed to cool to room temperature and heated again to near dryness in order to remove the nitric acid. The residue was dissolved in 8ml of 1% nitric acid and kept on a hot plate for about 1 hr to 34.8 34.85 34.9 34.953535.05 Longitude (E) 29.35 29.4 29.45 29.5 29.55 Latitude (N) Marine Science Station G U L F O F A Q A B A 0 1 2 3 4 5 km 34 34.5 35 35.5 27 28 29 Red Sea Gulf of Aqaba Hotels Area Phosphate Port Tala Bay Industrial Area Figure 1. Sampling sites at the northern Gulf of Aqaba, Red Sea. 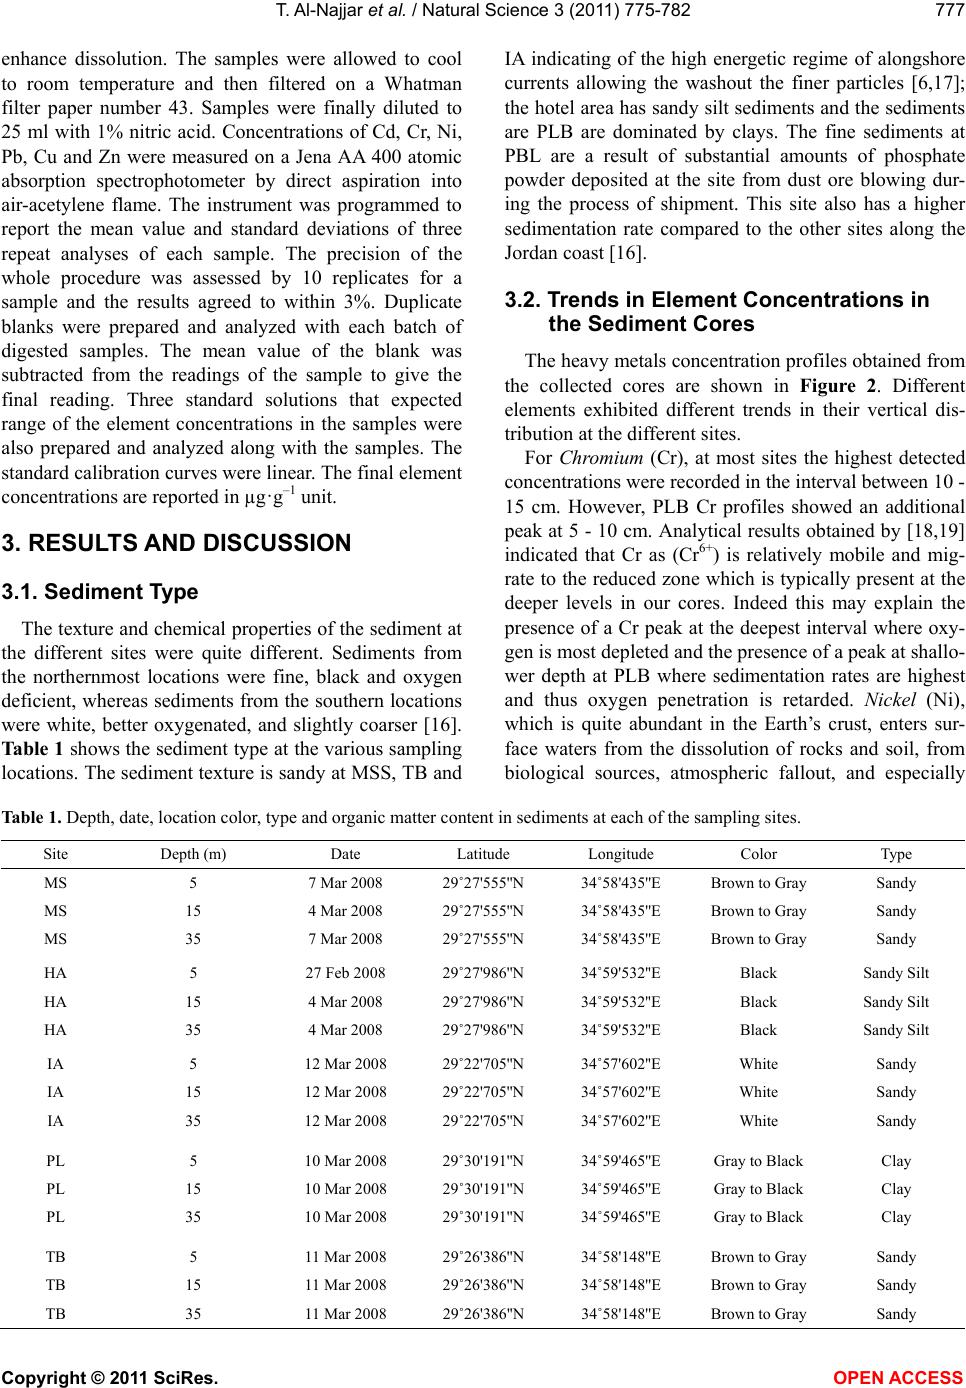 T. Al-Najjar et al. / Natural Science 3 (2011) 775-782 Copyright © 2011 SciRes. OPEN ACCESS 777 enhance dissolution. The samples were allowed to cool to room temperature and then filtered on a Whatman filter paper number 43. Samples were finally diluted to 25 ml with 1% nitric acid. Concentrations of Cd, Cr, Ni, Pb, Cu and Zn were measured on a Jena AA 400 atomic absorption spectrophotometer by direct aspiration into air-acetylene flame. The instrument was programmed to report the mean value and standard deviations of three repeat analyses of each sample. The precision of the whole procedure was assessed by 10 replicates for a sample and the results agreed to within 3%. Duplicate blanks were prepared and analyzed with each batch of digested samples. The mean value of the blank was subtracted from the readings of the sample to give the final reading. Three standard solutions that expected range of the element concentrations in the samples were also prepared and analyzed along with the samples. The standard calibration curves were linear. The final element concentrations are reported in µg·g–1 unit. 3. RESULTS AND DISCUSSION 3.1. Sediment Type The texture and chemical properties of the sediment at the different sites were quite different. Sediments from the northernmost locations were fine, black and oxygen deficient, whereas sediments from the southern locations were white, better oxygenated, and slightly coarser [16]. Table 1 shows the sediment type at the various sampling locations. The sediment texture is sandy at MSS, TB and IA indicating of the high energetic regime of alongshore currents allowing the washout the finer particles [6,17]; the hotel area has sandy silt sediments and the sediments are PLB are dominated by clays. The fine sediments at PBL are a result of substantial amounts of phosphate powder deposited at the site from dust ore blowing dur- ing the process of shipment. This site also has a higher sedimentation rate compared to the other sites along the Jordan coast [16]. 3.2. Trends in Element Concentrations in the Sediment Cores The heavy metals concentration profiles obtained from the collected cores are shown in Figure 2. Different elements exhibited different trends in their vertical dis- tribution at the different sites. For Chromium (Cr), at most sites the highest detected concentrations were recorded in the interval between 10 - 15 cm. However, PLB Cr profiles showed an additional peak at 5 - 10 cm. Analytical results obtained by [18,19] indicated that Cr as (Cr6+) is relatively mobile and mig- rate to the reduced zone which is typically present at the deeper levels in our cores. Indeed this may explain the presence of a Cr peak at the deepest interval where oxy- gen is most depleted and the presence of a peak at shallo- wer depth at PLB where sedimentation rates are highest and thus oxygen penetration is retarded. Nickel (Ni), which is quite abundant in the Earth’s crust, enters sur- face waters from the dissolution of rocks and soil, from biological sources, atmospheric fallout, and especially Table 1. Depth, date, location color, type and organic matter content in sediments at each of the sampling sites. Site Depth (m) Date Latitude Longitude Color Type MS 5 7 Mar 2008 29˚27'555''N 34˚58'435''E Brown to Gray Sandy MS 15 4 Mar 2008 29˚27'555''N 34˚58'435''E Brown to Gray Sandy MS 35 7 Mar 2008 29˚27'555''N 34˚58'435''E Brown to Gray Sandy HA 5 27 Feb 2008 29˚27'986''N 34˚59'532''E Black Sandy Silt HA 15 4 Mar 2008 29˚27'986''N 34˚59'532''E Black Sandy Silt HA 35 4 Mar 2008 29˚27'986''N 34˚59'532''E Black Sandy Silt IA 5 12 Mar 2008 29˚22'705''N 34˚57'602''E White Sandy IA 15 12 Mar 2008 29˚22'705''N 34˚57'602''E White Sandy IA 35 12 Mar 2008 29˚22'705''N 34˚57'602''E White Sandy PL 5 10 Mar 2008 29˚30'191''N 34˚59'465''E Gray to Black Clay PL 15 10 Mar 2008 29˚30'191''N 34˚59'465''E Gray to Black Clay PL 35 10 Mar 2008 29˚30'191''N 34˚59'465''E Gray to Black Clay TB 5 11 Mar 2008 29˚26'386''N 34˚58'148''E Brown to Gray Sandy TB 15 11 Mar 2008 29˚26'386''N 34˚58'148''E Brown to Gray Sandy TB 35 11 Mar 2008 29˚26'386''N 34˚58'148''E Brown to Gray Sandy 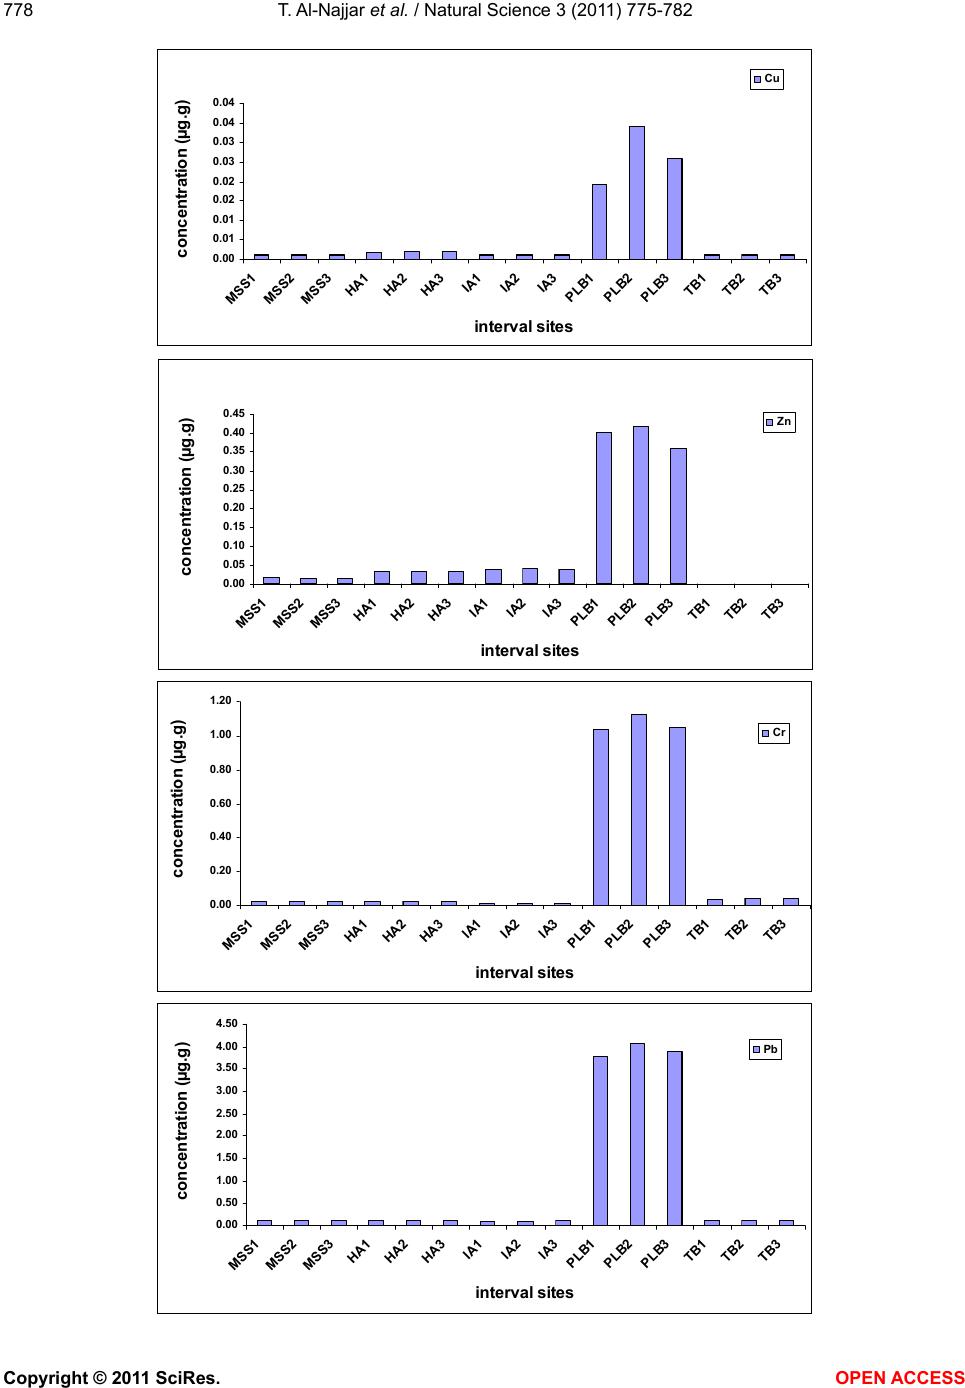 T. Al-Najjar et al. / Natural Science 3 (2011) 775-782 Copyright © 2011 SciRes. OPEN ACCESS 778 0.00 0.01 0.01 0.02 0.02 0.03 0.03 0.04 0.04 MSS1 MSS2 MSS3 HA1 HA2 HA3 IA1 IA2 IA3 PLB1 PLB2 PLB3 TB1 TB2 TB3 interval sites concentration (µg.g) Cu 0.00 0.50 1.00 1.50 2.00 2.50 3.00 3.50 4.00 4.50 MSS1 MSS2 MSS3 HA1 HA2 HA3 IA1 IA2 IA3 PLB1 PLB2 PLB3 TB1 TB2 TB3 interval sites concentration (µg.g) Pb 0.00 0.05 0.10 0.15 0.20 0.25 0.30 0.35 0.40 0.45 MSS1 MSS2 MSS3 HA1 HA2 HA 3 IA1 IA2 IA3 PLB1 PLB2 PLB3 TB1 TB2 TB3 interval sites concentration (µg.g) Zn 0.00 0.20 0.40 0.60 0.80 1.00 1.20 MSS1 MSS2 MSS3 HA1 HA2 HA3 IA1 IA2 IA3 PLB1 PLB2 PLB3 TB1 TB2 TB3 interval sites concentration (µg.g) Cr 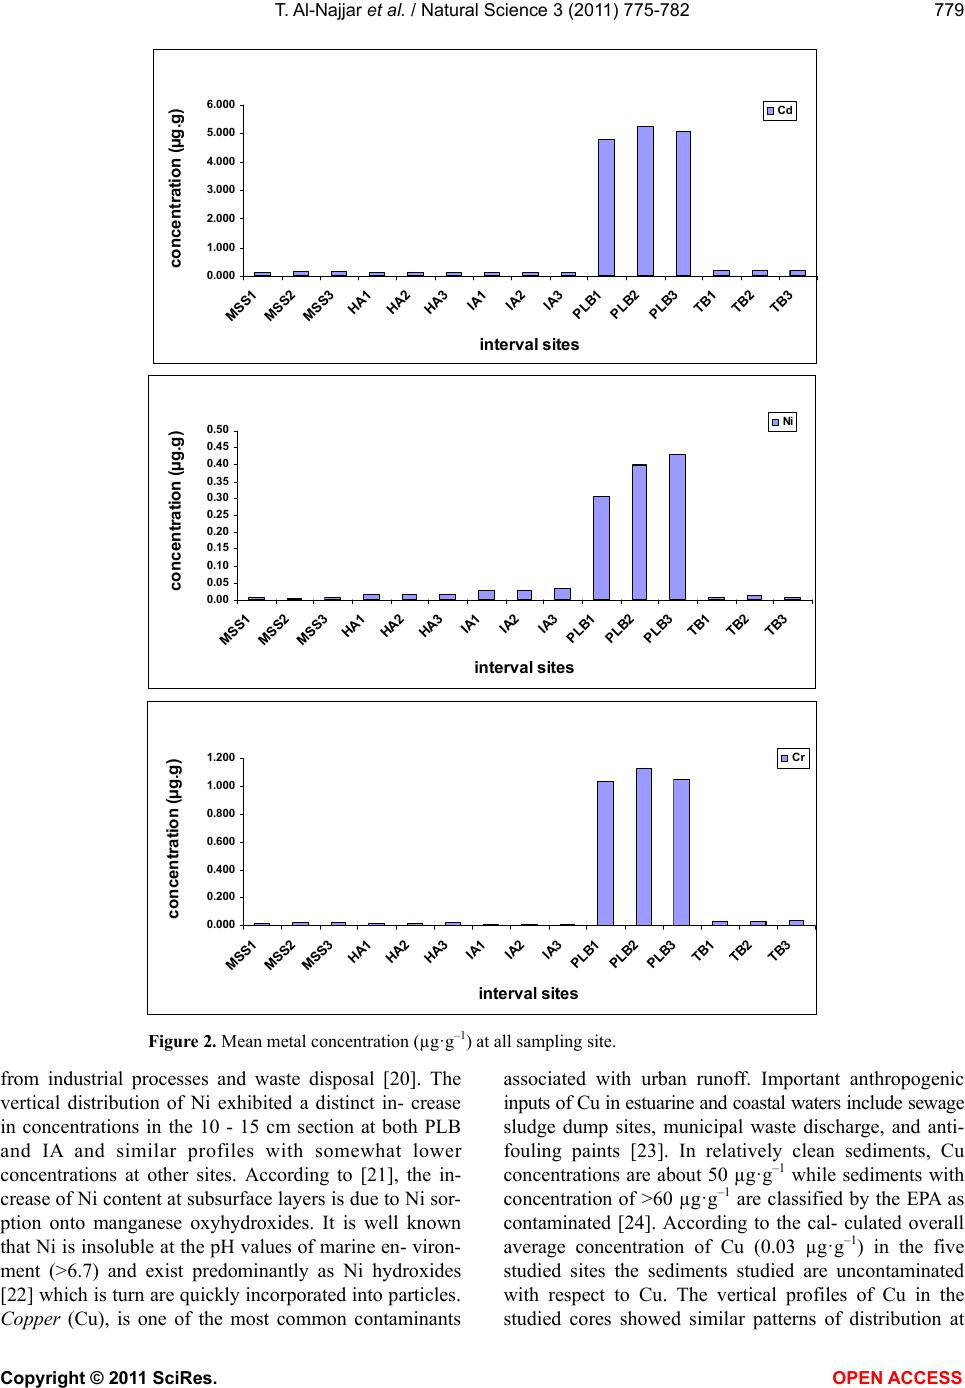 T. Al-Najjar et al. / Natural Science 3 (2011) 775-782 Copyright © 2011 SciRes. OPEN ACCESS 779 0.00 0.05 0.10 0.15 0.20 0.25 0.30 0.35 0.40 0.45 0.50 MSS1 MSS2 MSS3 HA1 HA2 HA3 IA1 IA2 IA3 PLB1 PLB2 PLB3 TB1 TB2 TB3 interval sites concentration (µg.g) Ni 0.000 1.000 2.000 3.000 4.000 5.000 6.000 MSS1 MSS2 MSS3 HA1 HA2 HA3 IA1 IA2 IA3 PLB1 PLB2 PLB3 TB1 TB2 TB3 interval sites concentration (µg.g) Cd 0.000 0.200 0.400 0.600 0.800 1.000 1.200 MSS1 MSS2 MSS3 HA 1 HA 2 HA 3 IA1 IA2 IA3 PLB1 PLB2 PLB3 TB1 TB2 TB3 interval sites concentration (µg.g) Cr Figure 2. Mean metal concentration (µg·g–1) at all sampling site. from industrial processes and waste disposal [20]. The vertical distribution of Ni exhibited a distinct in- crease in concentrations in the 10 - 15 cm section at both PLB and IA and similar profiles with somewhat lower concentrations at other sites. According to [21], the in- crease of Ni content at subsurface layers is due to Ni sor- ption onto manganese oxyhydroxides. It is well known that Ni is insoluble at the pH values of marine en- viron- ment (>6.7) and exist predominantly as Ni hydroxides [22] which is turn are quickly incorporated into particles. Copper (Cu), is one of the most common contaminants associated with urban runoff. Important anthropogenic inputs of Cu in estuarine and coastal waters include sewage sludge dump sites, municipal waste discharge, and anti- fouling paints [23]. In relatively clean sediments, Cu concentrations are about 50 µg·g–1 while sediments with concentration of >60 µg·g–1 are classified by the EPA as contaminated [24]. According to the cal- culated overall average concentration of Cu (0.03 µg·g–1) in the five studied sites the sediments studied are uncontaminated with respect to Cu. The vertical profiles of Cu in the studied cores showed similar patterns of distribution at 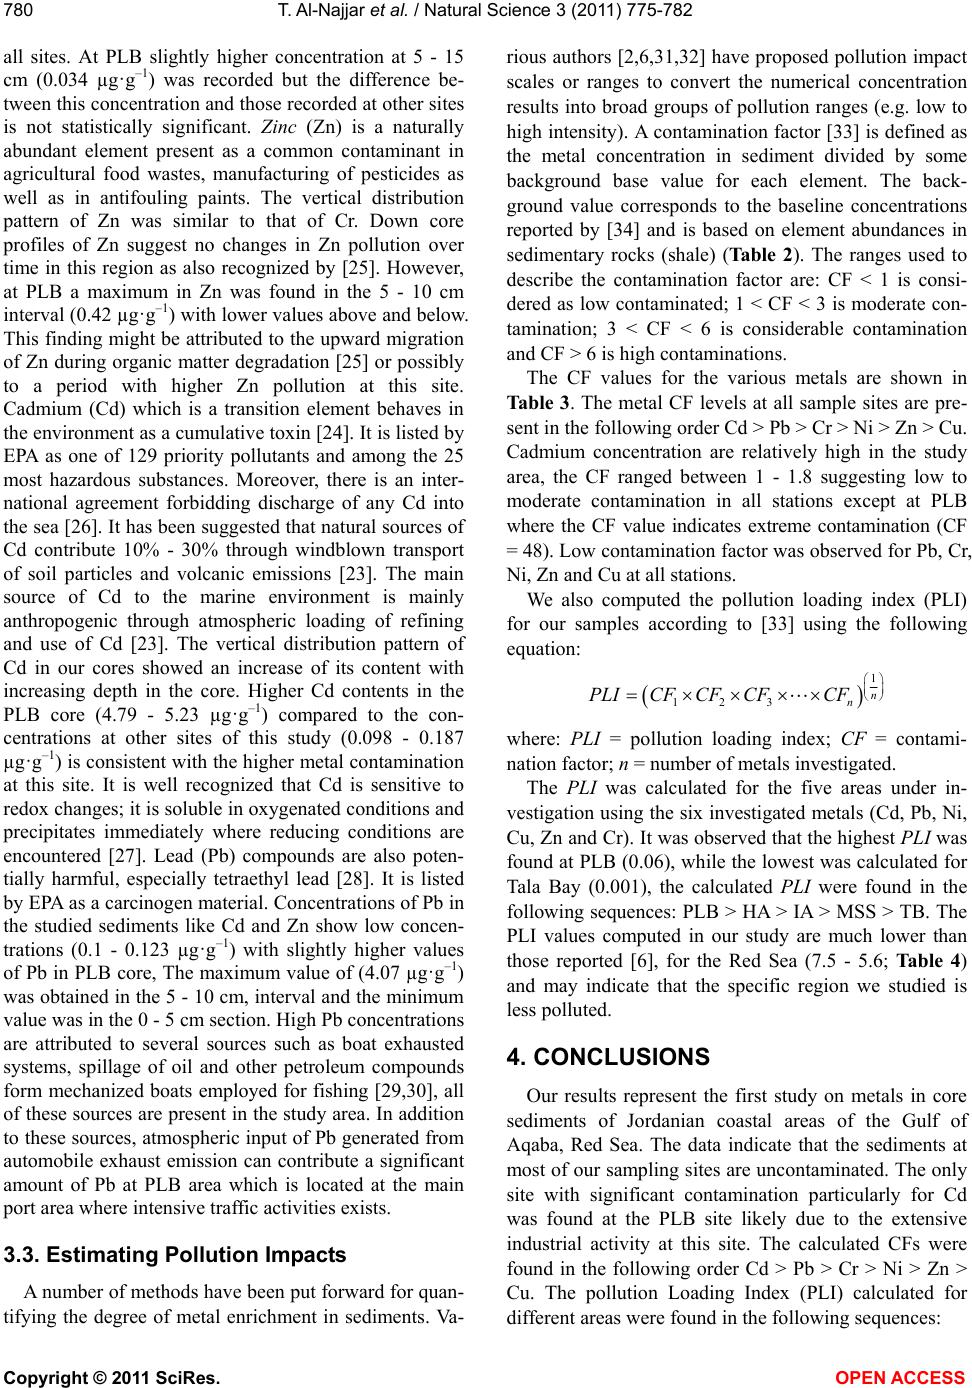 T. Al-Najjar et al. / Natural Science 3 (2011) 775-782 Copyright © 2011 SciRes. OPEN ACCESS 780 all sites. At PLB slightly higher concentration at 5 - 15 cm (0.034 µg·g–1) was recorded but the difference be- tween this concentration and those recorded at other sites is not statistically significant. Zinc (Zn) is a naturally abundant element present as a common contaminant in agricultural food wastes, manufacturing of pesticides as well as in antifouling paints. The vertical distribution pattern of Zn was similar to that of Cr. Down core profiles of Zn suggest no changes in Zn pollution over time in this region as also recognized by [25]. However, at PLB a maximum in Zn was found in the 5 - 10 cm interval (0.42 µg·g–1) with lower values above and below. This finding might be attributed to the upward migration of Zn during organic matter degradation [25] or possibly to a period with higher Zn pollution at this site. Cadmium (Cd) which is a transition element behaves in the environment as a cumulative toxin [24]. It is listed by EPA as one of 129 priority pollutants and among the 25 most hazardous substances. Moreover, there is an inter- national agreement forbidding discharge of any Cd into the sea [26]. It has been suggested that natural sources of Cd contribute 10% - 30% through windblown transport of soil particles and volcanic emissions [23]. The main source of Cd to the marine environment is mainly anthropogenic through atmospheric loading of refining and use of Cd [23]. The vertical distribution pattern of Cd in our cores showed an increase of its content with increasing depth in the core. Higher Cd contents in the PLB core (4.79 - 5.23 µg·g–1) compared to the con- centrations at other sites of this study (0.098 - 0.187 µg·g–1) is consistent with the higher metal contamination at this site. It is well recognized that Cd is sensitive to redox changes; it is soluble in oxygenated conditions and precipitates immediately where reducing conditions are encountered [27]. Lead (Pb) compounds are also poten- tially harmful, especially tetraethyl lead [28]. It is listed by EPA as a carcinogen material. Concentrations of Pb in the studied sediments like Cd and Zn show low concen- trations (0.1 - 0.123 µg·g–1) with slightly higher values of Pb in PLB core, The maximum value of (4.07 µg·g–1) was obtained in the 5 - 10 cm, interval and the minimum value was in the 0 - 5 cm section. High Pb concentrations are attributed to several sources such as boat exhausted systems, spillage of oil and other petroleum compounds form mechanized boats employed for fishing [29,30], all of these sources are present in the study area. In addition to these sources, atmospheric input of Pb generated from automobile exhaust emission can contribute a significant amount of Pb at PLB area which is located at the main port area where intensive traffic activities exists. 3.3. Estimating Pollution Impacts A number of methods have been put forward for quan- tifying the degree of metal enrichment in sediments. Va- rious authors [2,6,31,32] have proposed pollution impact scales or ranges to convert the numerical concentration results into broad groups of pollution ranges (e.g. low to high intensity). A contamination factor [33] is defined as the metal concentration in sediment divided by some background base value for each element. The back- ground value corresponds to the baseline concentrations reported by [34] and is based on element abundances in sedimentary rocks (shale) (Table 2). The ranges used to describe the contamination factor are: CF < 1 is consi- dered as low contaminated; 1 < CF < 3 is moderate con- tamination; 3 < CF < 6 is considerable contamination and CF > 6 is high contaminations. The CF values for the various metals are shown in Table 3. The metal CF levels at all sample sites are pre- sent in the following order Cd > Pb > Cr > Ni > Zn > Cu. Cadmium concentration are relatively high in the study area, the CF ranged between 1 - 1.8 suggesting low to moderate contamination in all stations except at PLB where the CF value indicates extreme contamination (CF = 48). Low contamination factor was observed for Pb, Cr, Ni, Zn and Cu at all stations. We also computed the pollution loading index (PLI) for our samples according to [33] using the following equation: 1 123 n n PLICF CFCFCF where: PLI = pollution loading index; CF = contami- nation factor; n = number of metals investigated. The PLI was calculated for the five areas under in- vestigation using the six investigated metals (Cd, Pb, Ni, Cu, Zn and Cr). It was observed that the highest PLI was found at PLB (0.06), while the lowest was calculated for Tala Bay (0.001), the calculated PLI were found in the following sequences: PLB > HA > IA > MSS > TB. The PLI values computed in our study are much lower than those reported [6], for the Red Sea (7.5 - 5.6; Table 4) and may indicate that the specific region we studied is less polluted. 4. CONCLUSIONS Our results represent the first study on metals in core sediments of Jordanian coastal areas of the Gulf of Aqaba, Red Sea. The data indicate that the sediments at most of our sampling sites are uncontaminated. The only site with significant contamination particularly for Cd was found at the PLB site likely due to the extensive industrial activity at this site. The calculated CFs were found in the following order Cd > Pb > Cr > Ni > Zn > Cu. The pollution Loading Index (PLI) calculated for different areas were found in the following sequences:  T. Al-Najjar et al. / Natural Science 3 (2011) 775-782 Copyright © 2011 SciRes. OPEN ACCESS 781 Table 2. Metal concentrations (µg·g−1) in average continental crust used for calculating PLI [34]. Elements Average continental crust Elements Average continental crust Cr 35 Pb 14.8 Cu 25 Zn 52 Ni 19 Cd 0.1 Table 3. Contamination Factors for surface sediments. Area Cu Pb Ni Zn Cd Cr MSS 0.0001 0.0077 0.0003 0.0003 1.2617 0.0005 HA 0.0001 0.0075 0.0008 0.0006 1.0483 0.0005 IA 0.0001 0.0070 0.0015 0.0008 0.9550 0.0002 PLB 0.0008 0.2607 0.0161 0.0077 47.9375 0.0296 TB 0.0001 0.0084 0.0003 0.0000 1.7600 0.0009 Table 4. Concentrations of metals (µg·g−1) in surface sediments worldwide compared to those in the present study. Location Cu Pb Ni Zn Cd Cr Reference Gulf of Aqab 0.03 4.07 0.43 0.42 5.25 1.12 Present study Red Sea, KSA 25.76 92.86 90.79 93.86 3.95 35.36 [6] Red Sea, Egypt 21.43 51.4 [35] Al-Hodeidah, Yemen 11.3 3.48 13.25 30 14.2 20.2 [36] Aegean Sea 9.6 22.3 38.4 75 0.25 35.7 [37] Gulf of Mannar 57 16 24 73 0.16 177 [28] South East Coast-India 506.21 32.36 38.61 126.83 6.58 194.83 [2] Gulf of Mannar 57 16 24 73 0.16 177 [38] PLB > HA > IA > MSS > TB. The results of this study could be used as a baseline against which future anthro- pogenic effects can be assessed and for management decision to reduce pollution particularly at the PLB site. 5. ACKNOWLEDGEMENTS We acknowledge the effort of the Marine Science Station in support this research. We thank Dean of scientific research, Yarmouk Univer- sity for their support. Our work was supported by the NATO projects (SfP 982161 and 981883). REFERENCES [1] Santos, I.R., Silva-Filho, C.E., Schaefer, C.E., Albuquer- que-Filho, M.R. and Campos, L.S. (2005) Heavy metals contamination in coastal sediments and soil near the Bra- zilian Antarctic Station, King George Island. Marine Po- llution Bulletin, 50, 185-194. doi:10.1016/j.marpolbul.2004.10.009 [2] Muthu, R.S. and Jayaprakash, M. (2008) Distribution and enrichment of trace metals in marine sediments of Bay of Bengal, off Ennore, South-east coast of India. Environ- mental Geology, 56, 207-217. doi:10.1007/s00254-007-1156-1 [3] Pekey, H. (2006) The distribution and source of heavy metals in Izmit Bay surface sediments affected by pollu- tion stream. Marine Pollution Bulletin, 52, 1197-1208. doi:10.1016/j.marpolbul.2006.02.012 [4] Bellucci, L.G., Frignani, M., Paolucci, D and Ravanekki, M. (2002) Distribution of heavy metals in sediments of the Venice lagoon the role of industrial area. Science of the Total Environment, 295, 35-49. doi:10.1016/S0048-9697(02)00040-2 [5] El-Rayis, O.A., Aboul-Dahab, O.M., Halim, Y. and Riley, J.P. (1997) Concentrations and distribution of heavy me- tals in bottom sediments of El-Mex may (Alexandria), prior to construction of El-Dekhaila Quays. 3rd Confer- ence of Geochemistry, Alexandria, 3-4 September 1997, 169-173. [6] Badr, N.B.E., El-Fiky, A.A., Mostafa, A.R. and Al-Mur, B.A. (2009) Metal pollution records in core sediments of some Red Sea coastal areas, Kingdom of Saudi Arabia. Environ Monitor Assessment, 155, 509-526. doi:10.1007/s10661-008-0452-x [7] Winkels, H.J., Vink, J.P.M. and Beurskens, J.E.M. (1993) Distribution and geochronology of priority pollutants in a large sedimentation area, River Rhine, Netherland. Ap- plied Geochemistry, S2, 95-101. doi:10.1016/S0883-2927(09)80018-8 [8] Buckley, D.E., Smith, J.N. and Winters, G.V. (1995) Ac-  T. Al-Najjar et al. / Natural Science 3 (2011) 775-782 Copyright © 2011 SciRes. OPEN ACCESS 782 cumulation of contaminants metals in marine sediments of Halifax Harbour, Nova Scotia: Environmental factors and historical trends. Applied Geochemistry, 10, 175-195. doi:10.1016/0883-2927(94)00053-9 [9] Lo, C.K. and Fung, Y.S. (1992) Recovery of heavy me- tals from acid digestion of an estuarine sediment and con- centration profiles of sediment cores from Hebe Haven and Ngua Mei Hoi, Hong Kong. International Journal of Environmental analytical chemistry, 46, 277-291. doi:10.1080/03067319208032568 [10] Abu-Karma, Y.M. (2006) Algae and seagrass as Bioindi- cators for trace metals pollution along the Jordanian coast of the Gulf of Aqaba. MSc Thesis, Yarmouk University, Irbid, Jordan. [11] Tawaha, M. (2006) Sea Urchen Diadema setosum as pos- sible bioindicator for trace metal pollution in the Gulf of Aqaba, Red Sea. MSc Thesis, Yarmouk University, Irbid, Jordan. [12] Alshabi, M.O. (2010) Sea cucumber as possible bioindi- cator for trace metal pollution in the Gulf of Aqaba, Red Sea. MSc Thesis, Yarmouk University, Irbid, Jordan. [13] Manasrah, R.S., Al-Horani. F.A., Rasheed. M.Y., Al- Rousan S.A. and Khalaf, M.A. (2006) Pattern of summer vertical and horizontal currents in coastal waters of the northern Gulf of Aqaba, Red Sea. Estuarine, Coastal and Shelf Science, 69, 567-579. doi:10.1016/j.ecss.2006.05.024 [14] Abu-Hilal, A.H. and Al-Najjar, T.H. (2004) Litter pollu- tion on the Jordanian shores of the Gulf of Aqaba. Marine Environmental Research, 58, 39-63. doi:10.1016/j.marenvres.2003.12.003 [15] Krumbein, W.C. and Petttijijohn, F.J. (1938) Manual of sedimentary petrology, Appleton, Century and Crofts, New York, 549. [16] Badran, M.I. and Al-Zibdah, M.K. (2005) Environmental quality of Jordan coastal surface sediment, Gulf of Aqaba, Red Sea. Royal Swedish Acaemy of Sciences, 34, 615- 620. [17] Gheith, A.M. and Abu-Ouf, M.A. (1996) Texture char- acteristics, mineralogy and fauna in the shore zone sedi- ments at Rabigh and Sharm al-kharrar, East Red Sea, Saudi Arabia. Marine Science, 7 (Special Issue: Sympo- sium on Red Sea Marine Environment. Jeddah 1994). [18] Gaillard, J.F., Pauwells, H. and Michard, G. (1989) Che- mical digenesis of coastal marine sediments. Oceanolo- gica Acta, 12, 175-187. [19] Janaki-Raman, D.M.P., Jonathan S.S., Armstrong-Altrin, J.S., Mohan, S.P. and Rama-Mohan, V. (2007) Trace metal enrichments in core sediments in Muthupet man- groves, SE Coast of India: Application of acid leachable technique. Environmental pollution, 145, 245-257. doi:10.1016/j.envpol.2006.03.012 [20] Prego, R., Belzunce Segarra, M.J., Helios-Rybicka, E. and Barciela, M.C. (1999) Cadmium, manganese, nickel and lead contents in surface sediments of the lower Ulla River and its estuary (Northwest Spain). Bulletin de lIn- stitut Oceanographique. Institute Oceanographique, 15, 495-500. [21] Zwolsman, J., Van Eck, G. and Burger, G. (1996) Spatial and temporal distribution of trace metals in sediment from the Scheldt Estuary, South-West Netherlands. Estua- rine. Coastal and Shelf Science, 43, 55-79. doi:10.1006/ecss.1996.0057 [22] Sunderman, W.F.Jr. and Oskarsson, A. (1991) Nickel. In: Merian, E., Ed., Metals and Their Compounds in the En- vironment, VCH, Weinheim, 1101-1126. [23] Kennish, M.J. (1996) Practical handbook of estuarine and marine pollution, CRC, Boca Raton, 524. [24] Ingersoll, C.G. and Nelson, M.K. (1989) Testing sedi- ment toxicity with Hayallella azteca (Amphipoda) and Chironomus riparius (Diptera). ASTM STP 13th Sympo- sium of Aquatic Toxicity Risk Assessment, Atlanta, 16-18 April 1989, 43. [25] Rubio, B., Pye, K., Rae, J.E. and Rey, D. (2001) Sedi- mentological characteristics, heavy metal distribution and magnetic properties in subtidal sediments, Ria de Ponte- vedra, NW Spain. Sedimentology, 48, 1277-1296. [26] Clark, R.B., Frid, C. and Attril, M. (1997) Marine pollu- tion. Oxford University Press, New York, 161. [27] Thomson, J., Nixon, S., Croudace, I.W., Pedersen, T.F., Brown, L., Cook, G.T., et al. (2001). Redox-sensitive elements uptake in Northeast Atlantic Ocean sediments (Benthic Boundary Layer Experiment Site). Earth and Planetary Science Letter, 184, 535-547. [28] Jonathan, M.V. and Mohan, V.R. (2003) Heavy metals in sediments of the inner shelf off the Gulf of Mannar, South East Coast of India. Marine Pollution Bulletin, 46, 258- 268. [29] Abu-Hilal, A.H. (1987) Distribution of trace elements in near shore surface sediments from the Jordan Gulf of Aqaba (Red Sea). Marine Pollution Bulletin, 18, 190-193. [30] Laxen, D.P.H. (1983) The chemistry of metal pollution in water. In: Horrison, R.M., Ed., Pollution Causes, Effects and Control, The Royal Society of Chemistry, WIVOBN, London, 104. [31] Salomons, W. and Forstner, U. (1984) Metals in hydrocy- cle. Springer, Berlin, 63-98. [32] Hokanson, L. (1980) Ecological risk index for Aquatic pollution control, a sedimentological approach. Water Research, 14, 975-1001. [33] Tomlinson, D.L., Wilson, J.G., Harris, C.R. and Jeffrey, D.W. (1980) Problems in the assessment of heavy metal levels in estuaries and the formation of a pollution index. Helgoland Marine Research, 33, 566-575. [34] Wedepohl, K.H. (1995) The composition of the continen- tal crust. Geochimica et Cosmocheim Acta, 59, 1217- 1232. [35] Okbah, M.A., Shata, M.A. and Shraidah, M.A. (2005) Geochemical forms of trace metals in mangroves sedi- ment, Red Sea, Egypt. Chemistry and Ecology, 21, 23-36. [36] Al-adrise, M.A.M. (2002) Concentration of some heavy metals in Kour-Kutheb Area (Al-Hodiedah) as a result of the sewage effluent impact. MSc Thesis, Hodeida Univer- sity, Hodeida. [37] Esin, E., Kucuksezgin, F. and Uluturhan, E. (2008) As- sessment of trace metal pollution in surface sediments of Nemrut bay, Aegean Sea. Environmental Monitoring and Assessment, 160, 257-266. |