

Paper Menu >>
Journal Menu >>
 Vol.3, No.9, 768-774 (2011) Natural Science http://dx.doi.org/10.4236/ns.2011.39101 Copyright © 2011 SciRes. OPEN ACCESS Time and space analysis of two earthquakes in the Apennines (Italy) Michele Caputo1,2, Giovanni Sebastiani3,4* 1Physics Department, Sapienza Università di Roma, Roma, Italy; [email protected] 2Department of Geology and Geophysics, Texas A & M University, College Station, USA; 3Istituto per le Applicazioni del Calcolo “Mauro Picone”, CNR, Roma, Italy; 4Mathematics Department, Sapienza Università di Roma, Roma, Italy; *Corresponding Author: [email protected] Received 28 July 2011; revised 30 August 2011; accepted 15 September 2011. ABSTRACT In this paper, we study two earthquakes: the April 6th 2009 earthquake of L’Aquila in the re- gion of Abruzzo (Italy) and the 1997 Colfiorito earthquake in the regions of Umbria and Marche (Italy). The data sets of these two earthquakes were analysed in both time and space domains. For time domain we used statistical methods and models both parametric and non-parametric. Concerning the space domain, we used Mathe- matical Morphology filters. The time domain analysis provides evidence of a possible corre- lation between seismic activities and the tides of the crust of the Earth. The results obtained show evidence that the daily number of earthquakes of the sequences proceeding and following the April 6th 2009 earthquake of L’Aquila and that of the sequence following the 1997 Colfiorito earth- quake have a periodic component of occurrence with period of about 7 days. It seems that the maxima of this component occur at a position of the Moon with respect to the Earth and the Sun corresponding to approximately 3 days before the four main Moon phases. The space domain analysis indicates that the foreshock activity in both earthquakes is clustered and concentrated. Furthermore, in each of the two earthquakes the clusters are located at about 3 kilometers from the epicentre of the main shock. Keywords: Earthquakes; Earth Tides; Periodic Modeling; Spectral Analysis; Mathematical Morphology; Foreshocks; Aftershocks 1. INTRODUCTION In this paper we face two issues. The first concerns the possibility of detecting the effect of the solid Earth tides for the triggering of earthquakes, which we approach with the ansatz that it should be easier to detect the effect of a small perturbation on a system when the system is unstable. This condition is verified for both foreshock and aftershock sequences. The second issue focuses to contribute to find possible forerunners. To this aim, we analysed the foreshock activity in space domain. For many decades, especially to the purpose of predi- cting earthquakes, it has been speculated that the stress generated by the solid Earth tides may trigger earth- quakes. From a theoretical point of view the scientists generally considered that the stress generated by the tides in the crust of the Earth could be a direct cause of the triggering, but this is so small that is seemed unlikely that it may help triggering the earthquakes in a perfectly elastic or anelastic Earth crust. The possibility that solid earth tides may accelerate the preparation process of the earthquakes and possibly trig- ger them was first suggested long time ago by Schuster [1,2]. Since then, a large number of attempts to prove the correlation between the tides and the occurrence of earth- quakes have been made and a plethora of papers pub- lished. A good survey of this literature is in the note of Métivier et al. [3], who also gave a proof of the existence of this correlation. In fact, they considered a set of 442, 412 earthquakes and observed a clear correlation be- tween the phase of the diurnal and semi-diurnal solid Earth tides and the time of occurrence of earthquakes. These authors show that the correlation is larger with shallow earthquakes and that earthquakes occur slightly more often when the Sun and the Moon are in oppo- sition. Atef et al. studied a set of 443,428 earthquakes and found the existence of two promiment spectral peaks with periods of one and seven days, respectively [4]. They suggested that the cyclic nature of the cultural noise level leads to the observed periodicities.  M. Caputo et al. / Natural Science 3 (2011) 768-774 Copyright © 2011 SciRes. OPEN ACCESS 769 For the time domain analysis, we note that the sets of events which we considered is limited in a central Appe- nines region with linear length of some tens of kilo- meters. Therefore, the earthquake events in this region have approximately the same phase in the Earth tide effect. The spectral analysis of time series resulting from the observation of components which have the same fre- quency and different phases may fail to detect signals of small amplitude for possible interference. In our case, due to the limited size of the region where each of the two earthquakes studied occurred, this problem is irre- levant. When considering the statistics of earthquakes occurred in a very limited region and recorded with modern intru- mentation, including the smallest observable instrumen- tally, in order to have a reasonable number of events per time unit, the number of events is usually counted in events per day, as done here. We search for possible periodicities in the daily number of earthquakes proceed- ing and following the April 6th 2009 earthquake of L’Aquila in the region of Abruzzo (Italy) and also in the sequence following the 1997 earthquake of Colfiorito in the regions of Umbria and Marche (Italy). We assume that the crust of the Earth, in the seismic regions, has a large number of small faults with different orientations [5]. For instance, the faults with area A100 are 5000 times more numerous than those with area A [6]. This is supported by the observations of Wallace in California [7]. There is therefore a non negligible pro- bability that the tidal stress field meets a fault with the appropriate orientation to be effected in the direction to increase the existing tectonic field. If the stress acting on this fault is near the value which may trigger an earthquake then the tidal field may possibly trigger the earthquake. 2. METHODS OF ANALYSIS 2.1. Time Sequence Analysis We performed two kinds of analysis of the measured time sequences: parametric and non-parametric, as des- cribed below. Let us first consider the measured foreshock sequence f i M of the number of events happened during each day i, from day f b until day f e, within a given spatial region. This sequence was described here mathematically by means of a parametric mixture model with an unkown number of Lorentian components 2 =1 =. 1 p fk i kk k C N i (1) First, we determined the number p of components of the model. This was done by testing the hypothesis that there is a significant positive difference of the derivative discrete approximation 11 2* 2 fff iii NNN . The distribution of this quantity under the null hypothesis of no difference was approximated by the empirical distribution of the same quantity in a time interval of days before f b, where there is no apparent activity. The values of the parameters in Eq.1 were found by mini- mizing the sum of squared differences between the mea- sured and the theoretical values 2 =. f f eff ii ib MN The period of the sequence was estimated here on the basis of the average difference 11 pp be- tween consecutive peak locations 1kk , =1, ,1.kp The measured sequence a i M of the number of daily events after the main shock from day a b to day a e was analysed both parametrically and non-parametrically to detect the presence of periodicities. In both cases, first a parametric power-law function was used for modeling the number of daily events 0 =, a i NCit (2) where 0 t, C and are real parameters. Also here the minimization of the sum of squared differences between a i M and a i N was adopted to estimate the model parameters. Based on the estimated model and the measured sequence, their residual diffe- rence sequence a i R was computed. The residual diffe- rence sequence was from one side analysed parametri- cally by modelling a i R as sum of a single component sinusoidal model and zero mean uncorrelated errors; amplitude, frequency and phase were estimated by mini- mizing the sum of squared errors. The non-parametric analysis of a i R was performed as follows. In 1987, Jaynes [8] showed that the mode of the periodogram, i.e. the mode of C , time average of the squared absolute value of the discrete Fourier transform of a sampled signal, introduced by Schuster about eighty years before, is a sufficient statistics for the frequency of a single component periodic signal. Closely related to the periodogram is the power spectral density of a stationary stochastic process Rt , i.e. the Fourier transform of its autocorrelation function =e d i PERtRt (3) where we assumed that the process auto-correlation fun- ction only depends on the time lag , i.e. =ERtRt . The relation between the pe- riodogram and the power spectral density is ,EC P (4) when the time window T goes to. Instead of 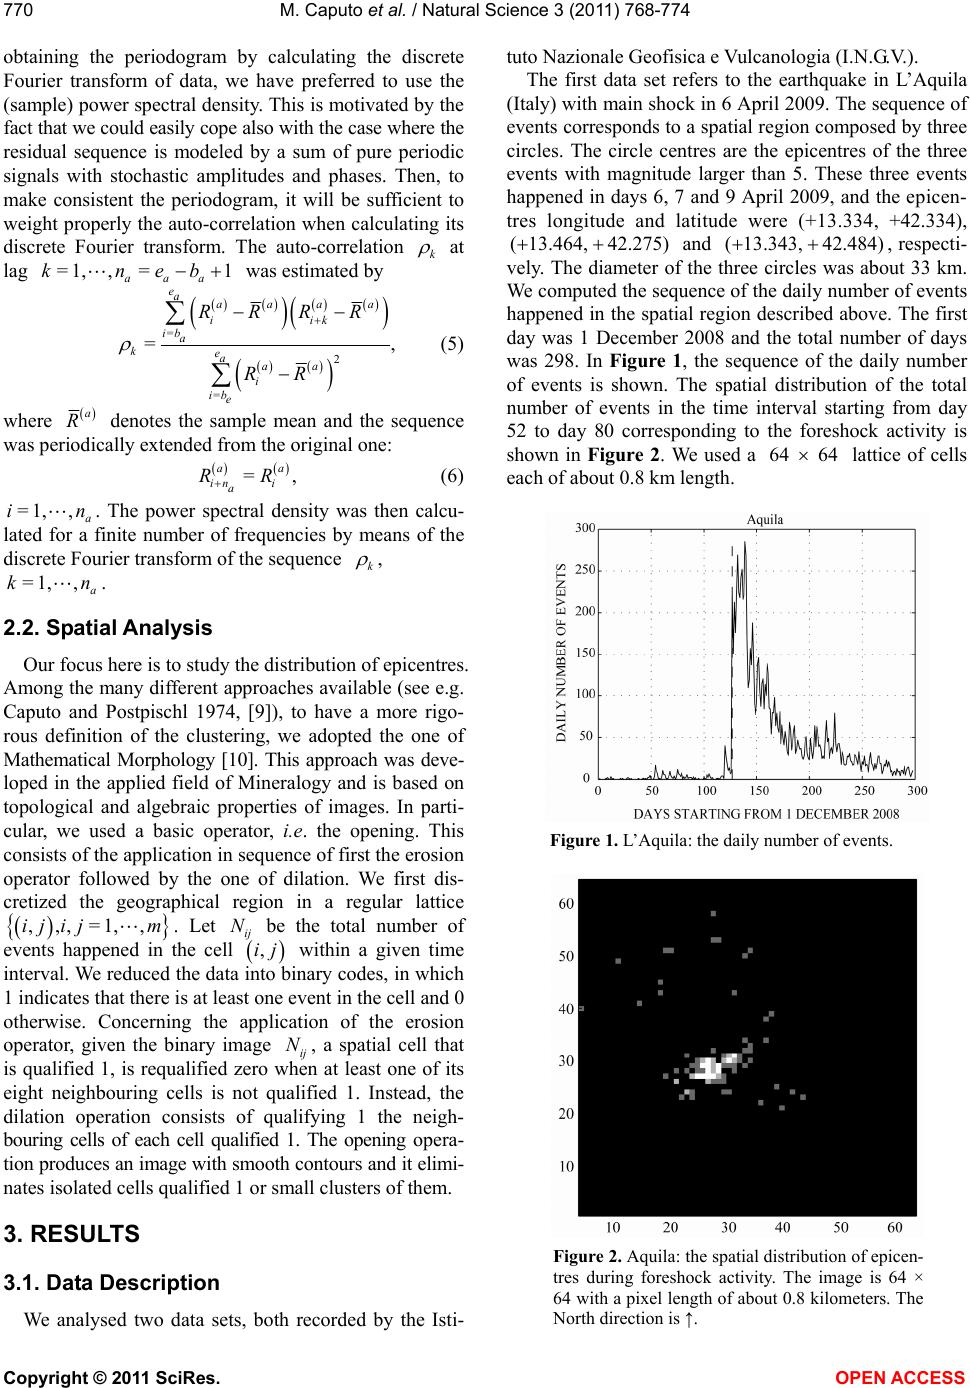 M. Caputo et al. / Natural Science 3 (2011) 768-774 Copyright © 2011 SciRes. OPEN ACCESS 770 obtaining the periodogram by calculating the discrete Fourier transform of data, we have preferred to use the (sample) power spectral density. This is motivated by the fact that we could easily cope also with the case where the residual sequence is modeled by a sum of pure periodic signals with stochastic amplitudes and phases. Then, to make consistent the periodogram, it will be sufficient to weight properly the auto-correlation when calculating its discrete Fourier transform. The auto-correlation k at lag =1, ,=1 aaa kneb was estimated by = 2 = =, eaaaaa iik ib a keaaa i ib e RRRR RR (5) where a R denotes the sample mean and the sequence was periodically extended from the original one: =, aa i in a RR (6) =1,, a in. The power spectral density was then calcu- lated for a finite number of frequencies by means of the discrete Fourier transform of the sequence k , =1,, a kn. 2.2. Spatial Analysis Our focus here is to study the distribution of epicentres. Among the many different approaches available (see e.g. Caputo and Postpischl 1974, [9]), to have a more rigo- rous definition of the clustering, we adopted the one of Mathematical Morphology [10]. This approach was deve- loped in the applied field of Mineralogy and is based on topological and algebraic properties of images. In parti- cular, we used a basic operator, i.e. the opening. This consists of the application in sequence of first the erosion operator followed by the one of dilation. We first dis- cretized the geographical region in a regular lattice ,,,=1,,ij ijm. Let ij N be the total number of events happened in the cell ,ij within a given time interval. We reduced the data into binary codes, in which 1 indicates that there is at least one event in the cell and 0 otherwise. Concerning the application of the erosion operator, given the binary image ij N, a spatial cell that is qualified 1, is requalified zero when at least one of its eight neighbouring cells is not qualified 1. Instead, the dilation operation consists of qualifying 1 the neigh- bouring cells of each cell qualified 1. The opening opera- tion produces an image with smooth contours and it elimi- nates isolated cells qualified 1 or small clusters of them. 3. RESULTS 3.1. Data Description We analysed two data sets, both recorded by the Isti- tuto Nazionale Geofisica e Vulcanologia (I.N.G.V.). The first data set refers to the earthquake in L’Aquila (Italy) with main shock in 6 April 2009. The sequence of events corresponds to a spatial region composed by three circles. The circle centres are the epicentres of the three events with magnitude larger than 5. These three events happened in days 6, 7 and 9 April 2009, and the epicen- tres longitude and latitude were (+13.334, +42.334), ( 13.464,42.275) and ( 13.343,42.484) , respecti- vely. The diameter of the three circles was about 33 km. We computed the sequence of the daily number of events happened in the spatial region described above. The first day was 1 December 2008 and the total number of days was 298. In Figure 1, the sequence of the daily number of events is shown. The spatial distribution of the total number of events in the time interval starting from day 52 to day 80 corresponding to the foreshock activity is shown in Figure 2. We used a 64 64 lattice of cells each of about 0.8 km length. Figure 1. L’Aquila: the daily number of events. Figure 2. Aquila: the spatial distribution of epicen- tres during foreshock activity. The image is 64 × 64 with a pixel length of about 0.8 kilometers. The North direction is ↑. 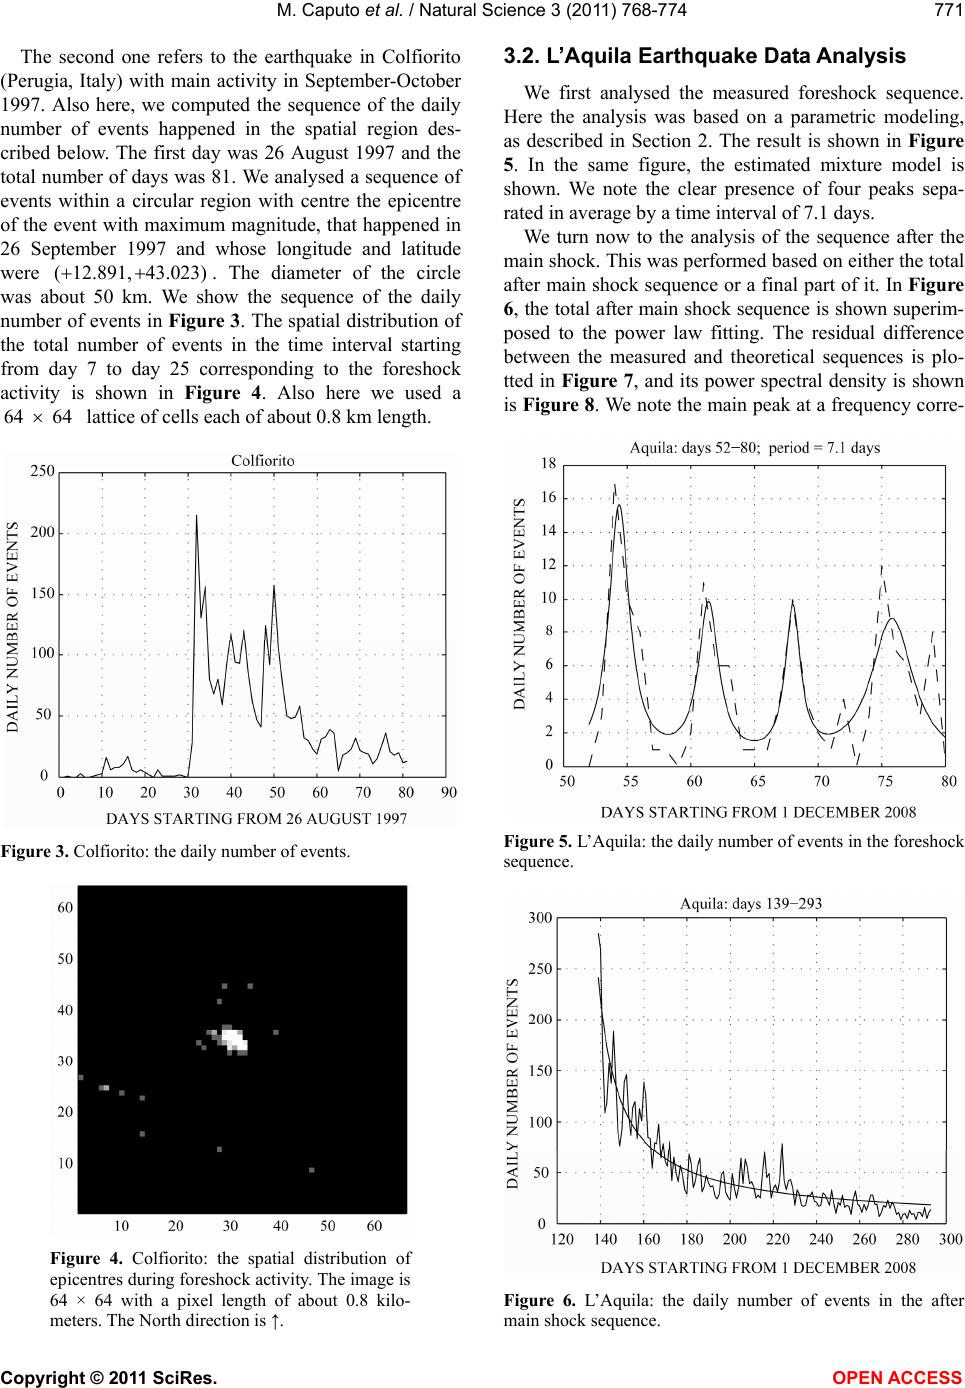 M. Caputo et al. / Natural Science 3 (2011) 768-774 Copyright © 2011 SciRes. OPEN ACCESS 771 The second one refers to the earthquake in Colfiorito (Perugia, Italy) with main activity in September-October 1997. Also here, we computed the sequence of the daily number of events happened in the spatial region des- cribed below. The first day was 26 August 1997 and the total number of days was 81. We analysed a sequence of events within a circular region with centre the epicentre of the event with maximum magnitude, that happened in 26 September 1997 and whose longitude and latitude were ( 12.891,43.023) . The diameter of the circle was about 50 km. We show the sequence of the daily number of events in Figure 3. The spatial distribution of the total number of events in the time interval starting from day 7 to day 25 corresponding to the foreshock activity is shown in Figure 4. Also here we used a 64 64 lattice of cells each of about 0.8 km length. Figure 3. Colfiorito: the daily number of events. Figure 4. Colfiorito: the spatial distribution of epicentres during foreshock activity. The image is 64 × 64 with a pixel length of about 0.8 kilo- meters. The North direction is ↑. 3.2. L’Aquila Earthquake Data Analysis We first analysed the measured foreshock sequence. Here the analysis was based on a parametric modeling, as described in Section 2. The result is shown in Figure 5. In the same figure, the estimated mixture model is shown. We note the clear presence of four peaks sepa- rated in average by a time interval of 7.1 days. We turn now to the analysis of the sequence after the main shock. This was performed based on either the total after main shock sequence or a final part of it. In Figure 6, the total after main shock sequence is shown superim- posed to the power law fitting. The residual difference between the measured and theoretical sequences is plo- tted in Figure 7, and its power spectral density is shown is Figure 8. We note the main peak at a frequency corre- Figure 5. L’Aquila: the daily number of events in the foreshock sequence. Figure 6. L’Aquila: the daily number of events in the after main shock sequence. 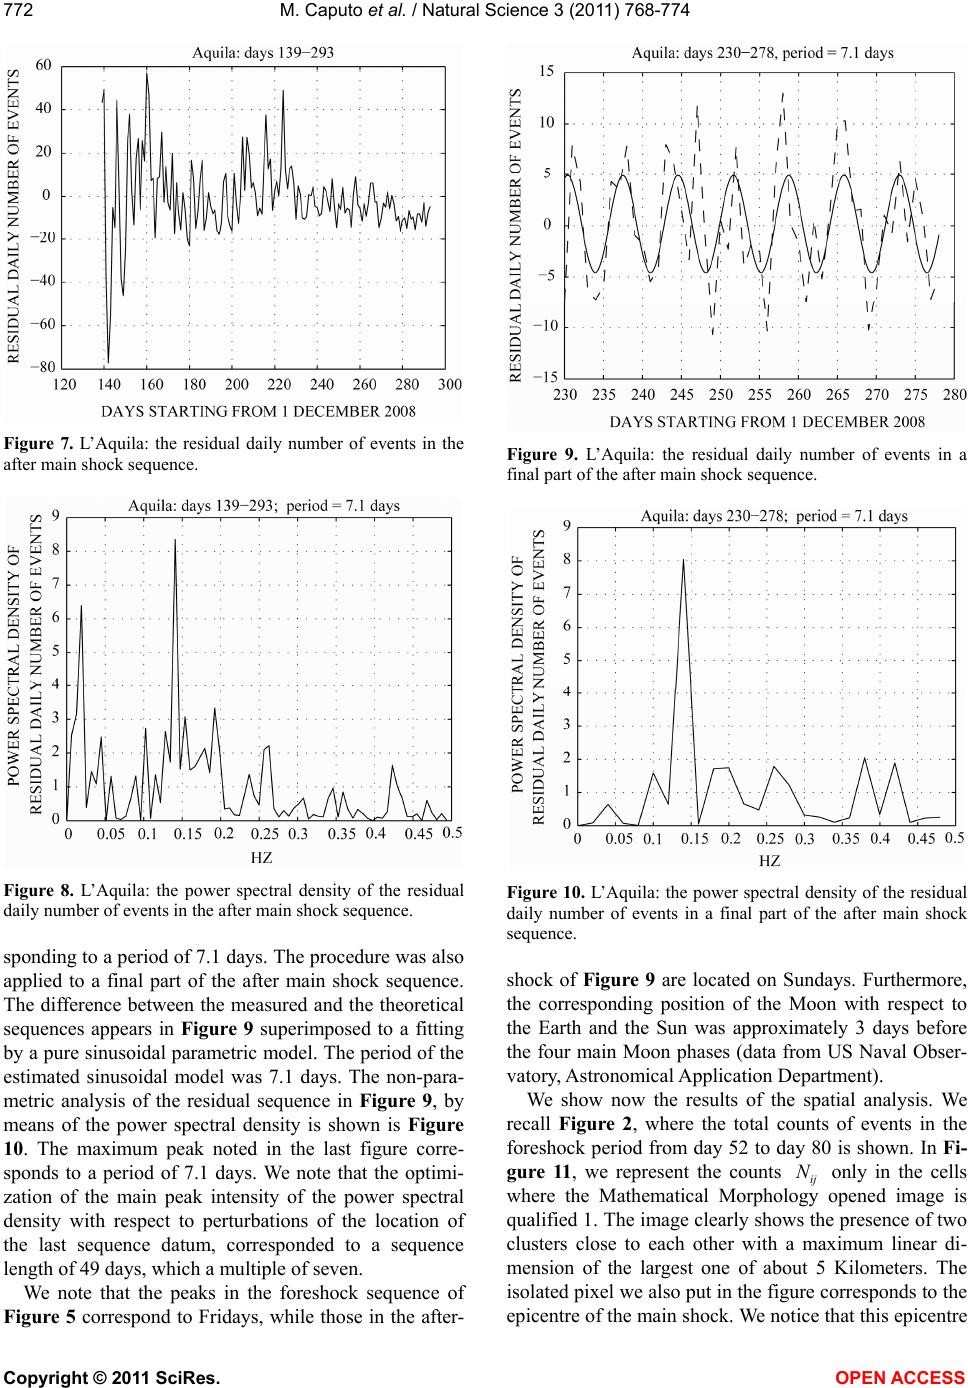 M. Caputo et al. / Natural Science 3 (2011) 768-774 Copyright © 2011 SciRes. OPEN ACCESS 772 Figure 7. L’Aquila: the residual daily number of events in the after main shock sequence. Figure 8. L’Aquila: the power spectral density of the residual daily number of events in the after main shock sequence. sponding to a period of 7.1 days. The procedure was also applied to a final part of the after main shock sequence. The difference between the measured and the theoretical sequences appears in Figure 9 superimposed to a fitting by a pure sinusoidal parametric model. The period of the estimated sinusoidal model was 7.1 days. The non-para- metric analysis of the residual sequence in Figure 9, by means of the power spectral density is shown is Figure 10. The maximum peak noted in the last figure corre- sponds to a period of 7.1 days. We note that the optimi- zation of the main peak intensity of the power spectral density with respect to perturbations of the location of the last sequence datum, corresponded to a sequence length of 49 days, which a multiple of seven. We note that the peaks in the foreshock sequence of Figure 5 correspond to Fridays, while those in the after- Figure 9. L’Aquila: the residual daily number of events in a final part of the after main shock sequence. Figure 10. L’Aquila: the power spectral density of the residual daily number of events in a final part of the after main shock sequence. shock of Figure 9 are located on Sundays. Furthermore, the corresponding position of the Moon with respect to the Earth and the Sun was approximately 3 days before the four main Moon phases (data from US Naval Obser- vatory, Astronomical Application Department). We show now the results of the spatial analysis. We recall Figure 2, where the total counts of events in the foreshock period from day 52 to day 80 is shown. In Fi- gure 11, we represent the counts ij N only in the cells where the Mathematical Morphology opened image is qualified 1. The image clearly shows the presence of two clusters close to each other with a maximum linear di- mension of the largest one of about 5 Kilometers. The isolated pixel we also put in the figure corresponds to the epicentre of the main shock. We notice that this epicentre 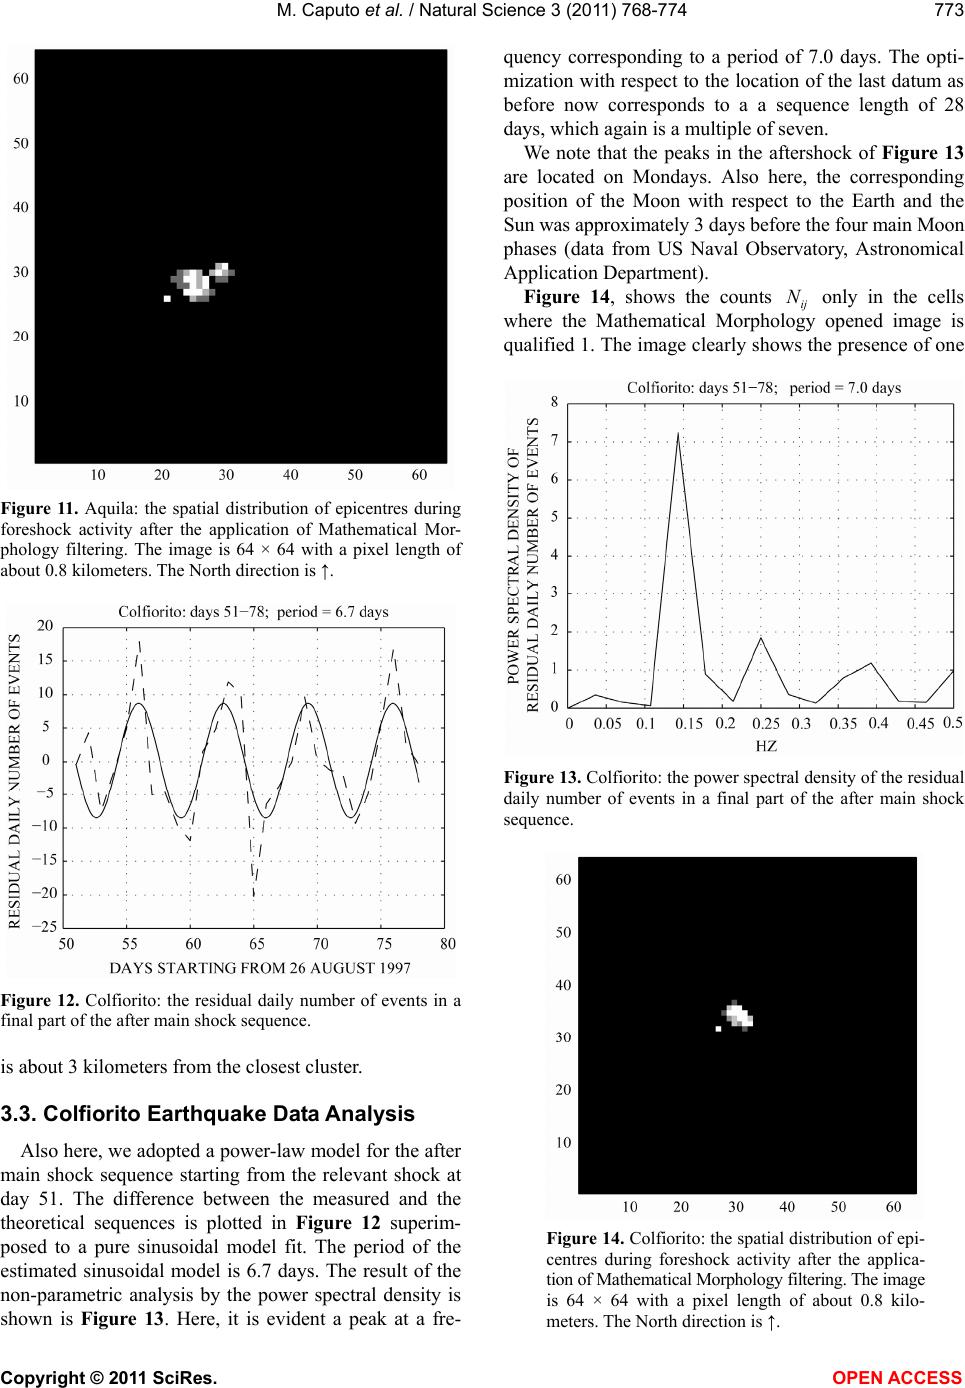 M. Caputo et al. / Natural Science 3 (2011) 768-774 Copyright © 2011 SciRes. OPEN ACCESS 773 Figure 11. Aquila: the spatial distribution of epicentres during foreshock activity after the application of Mathematical Mor- phology filtering. The image is 64 × 64 with a pixel length of about 0.8 kilometers. The North direction is ↑. Figure 12. Colfiorito: the residual daily number of events in a final part of the after main shock sequence. is about 3 kilometers from the closest cluster. 3.3. Colfiorito Earthquake Data Analysis Also here, we adopted a power-law model for the after main shock sequence starting from the relevant shock at day 51. The difference between the measured and the theoretical sequences is plotted in Figure 12 superim- posed to a pure sinusoidal model fit. The period of the estimated sinusoidal model is 6.7 days. The result of the non-parametric analysis by the power spectral density is shown is Figure 13. Here, it is evident a peak at a fre- quency corresponding to a period of 7.0 days. The opti- mization with respect to the location of the last datum as before now corresponds to a a sequence length of 28 days, which again is a multiple of seven. We note that the peaks in the aftershock of Figure 13 are located on Mondays. Also here, the corresponding position of the Moon with respect to the Earth and the Sun was approximately 3 days before the four main Moon phases (data from US Naval Observatory, Astronomical Application Department). Figure 14, shows the counts ij N only in the cells where the Mathematical Morphology opened image is qualified 1. The image clearly shows the presence of one Figure 13. Colfiorito: the power spectral density of the residual daily number of events in a final part of the after main shock sequence. Figure 14. Colfiorito: the spatial distribution of epi- centres during foreshock activity after the applica- tion of Mathematical Morphology filtering. The image is 64 × 64 with a pixel length of about 0.8 kilo- meters. The North direction is ↑.  M. Caputo et al. / Natural Science 3 (2011) 768-774 Copyright © 2011 SciRes. OPEN ACCESS 774 cluster with a maximum linear dimension of about 5 Kilometers. Also here, the isolated pixel we also put in the figure corresponds to the epicentre of the main shock, at a distance of about 3 kilometers from the cluster. 4. CONCLUSIONS The two different sets of aftershocks and a set of fore- shocks indicate a possible correlation between the time sequence of events and the stress field generated by the solid Earth tides. The sequences of aftershocks obviously occurred in an unstable stress field due to the previous major shock which destabilized the region, while the sequence of foreshocks occurred in increasing stress field. The possible correlation between tides and earthquakes therefore concerns two different circumstances and could be associated with different physical conditions although the formal causes of the correlations are the same. It is to be noted that the 7 days periodicity has been found in both: foreshocks and aftershocks sequences and using different methodologies. The two regions where the earthquakes occurred are separated by about 50 kilo- meters and belong to the same geologic formation. Concerning the possibility that the cause of the 7 days periodicity be due to the weekly noise generated by the human activity in the working days we note that, in both cases, after the major shock the human activity was con- tinuous without respect to the festivities; in particular was continuous the activity of heavy working machines and of transportations. Furthermore, we checked that the maxima of the peaks of the three sequences of above occurred in three different days of the week. We turn now to the possbile influence of the position of the Moon with respect to the Earth and the Sun. We note that the peaks in the three sequences of above, different to each other for period of the year and/or geo- graphical location of earthquake, occurred approximately three days before the four main Moon phases. Finally we provide some comments on the results of the spatial analysis. To find evidence of a possible fore- runner, we focus our attention on the foreshock sequence. Here, the application of the Mathematical Morphology opening operator provides a clear picture of the clus- tering of the sismic events. We notice that in both cases of the L’Aquila and Colfiorito earthquakes, the epicentre of the main shock is at distance of only about 3 kilometer from the closest cluster. 5. ACKNOWLEDGEMENTS We thanks Dr. Aladino Govoni of the I.N.G.V. for providing the data and for useful discussions and suggestions. REFERENCES [1] Schuster, A. (1897) On lunar and solar periodicities of earthquakes. Proceedings of the Royal Society of London, 61, 455-465. doi:10.1098/rspl.1897.0060 [2] Schuster, A. (1905) The periodogram and its optical analogy. Proceedings of the Royal Society of London, 77, 136. [3] Métivier, L., De Viron, O., Conrad, C.P., Renault, S. and Diament, M. (2009) Evidence of earthquake triggering by solid earth tides. Earth and Planetary Science Letters, 278, 370-375. [4] Atef, A.H., Liu, K.H. and Gao, S.S. (2009), Apparent weekly and daily earthquake periodicities in the Western United States. Bulletin of the Seismological Society of America, 99, 2273-2279. doi:10.1785/0120080217 [5] Caputo, M. (1981) Earthquake-induced ground accelera- tions. Nature, 291, 51-53. doi:10.1038/291051a0 [6] Caputo, M. (1977) A mechanical model for the statistics of earthquakes magnitude, moment and fault distribution, Bulletin of the Seismological Society of America, 67, 849- 861. [7] Wallace, R.E. (1973) Surface fractures patterns along St. Andreas fault. In: Kovach, R.L. and Nur, A., Eds., Pro- ceedings of the Conference on Tectonic Problems of the San Andrews Fault System, Stanford University Publica- tions in the Geological Sciences, 13, 248-250. [8] Jaynes, E.T. (1987) Bayesian spectrum and chirp analy- sis. In: Smith, C.R. and Erickson, G.J., Eds., Maximum Entropy and Bayesian Spectral Analysis and Estimation Problems, D. Reidel, Dordrecht, 1-37. [9] Caputo, M. and Postpischl, D. (1974) Contour mapping of seismic areas by numerical filtering and geological implications. Annali di Geofisica, 27, 619-639. [10] Serra, J. (1982) Image analysis and mathematical mor- phology. Academic Press Inc., London. |