

Paper Menu >>
Journal Menu >>
 American Journal of Plant Sciences, 2011, 2, 408-415 doi:10.4236/ajps.2011.23046 Published Online September 2011 (http://www.SciRP.org/journal/ajps) Copyright © 2011 SciRes. AJPS Genotype-by-Environment Interaction and Yield Stability Analysis in Finger Millet (Elucine coracana L. Gaertn) in Ethiopia Asfaw Adugna1*, Tesfaye Tesso2, Erenso Degu1, Taye Tadesse1, Feyera Merga1, Wasihun Legesse3, Alemu Tirfessa3, Haileselassie Kidane1, Andualem Wole4, Chemeda Daba5 1Ethiopian Institute of Agricultural Research, Melkassa Agricultural Research Center, Nazareth, Ethiopia; 2Department of Agronomy, Kansas State University, Manhattan, USA; 3Ethiopian Institute of Agricultural Research Pawe Agricultural Research Center, Pawe, Ethiopia; 4Amhara Agricultural Research Institute, Adet Agricultural Research Center, Adet, Ethiopia; 5Oromia Agricultural Re- search Institute, Bako Agricultural Research Center, Bako, Ethiopia. Email: *[email protected] Received April 18th, 2011; revised May 14th, 2011; accepted June 11th, 2011. ABSTRACT Finger millet is one of the mo st neglected and underutilized crop s worldwide, yet an important food cereal for millions of poor farmers in Africa. An experiment was carried out to determine adaptation range of diverse set of finger millet accessions and identify superior types with excellent yield potential for use as cultivar or as germplasm source for fu- ture breeding endeavors. A total of 44 indigenous accessions selected in previous evaluations and two check varieties were tested in two sets (mixed and colored) each containing 22 entries in a total of 11 environments between 2004 and 2008 seasons. Data were collected on grain yield, days to flowering, and plant height. The result showed that 2.5%, 79.1% and 18 .3 % of the total sum of squares in the mixed set and 2.1%, 86.9% and 11.0% in the colored set was at- tributed to genotype, environment, and genotype × environment interaction (GEI) effects, respectively. Furthermore, 54.6% and 46.19% o f the GEI sum of squares in th e mixed and in the co lored set, respectively, were contributed by the first two interaction principal component axes (IPCA1 and IPCA2). A white seed accession (Acc. 203572) from the mixed set and three other accessions (Acc. 229469, Acc. 203410 and Acc. 203539) from the colored set were most sta- ble and also had above average mean grain yield across environment and thus are recommended for release as culti- vars to improve finger millet production in these environments. Keywords: AMMI, Finger Millet, Genotype, Environment, Stability 1. Introduction Finger millet (Eluc ine coracana L . Gaer tn), a membe r of the Poaceae (Gramineae) family, is one of the most im- portant food cereals in the sub-Saharan Africa and south Asia. It is the third most widely cultivated millets after pearl millet (Pennisetum glaucum) and foxtail millet (Setaria italica) in the semi-arid tropical and subtropical regions of the world [1]. Indigenous to eastern Africa, finger millet is widely produced in the cool high altitude areas in the region primarily as source of food and also for making traditional alcoholic beverages [2]. In Ethio- pia, the crop is mainly grown in the northern, north western and western parts of the country, especially dur- ing the main rainy season. Finger millet is often mixed with other grain crops such as tef or sorghum to make composite flour for local food preparation such as injera and porridge. It is often valued as nutritious cereal by local people. This ob servation has scientific merit in that finger millet contains relatively higher concentration of calcium and dietary fiber than other cereals [3]. Notwithstanding its importance, pub lished information is scarce on the agronomy and genetics of the crop. In Ethiopia, finger millet occupies 4% of the total area al- located to cereals (nearly half a million hectares) each year and also contributes about 4% to the total annual cereal grain production in the country [4]. Similar to tef, finger millet grain can be stored for several years under local storage conditions without sustaining significant damage by storage pests [5,6]. This property together with its adaptation to low input conditions and relatively better nutritional value [7] makes it one of the salient crops among resource poor communities living in food 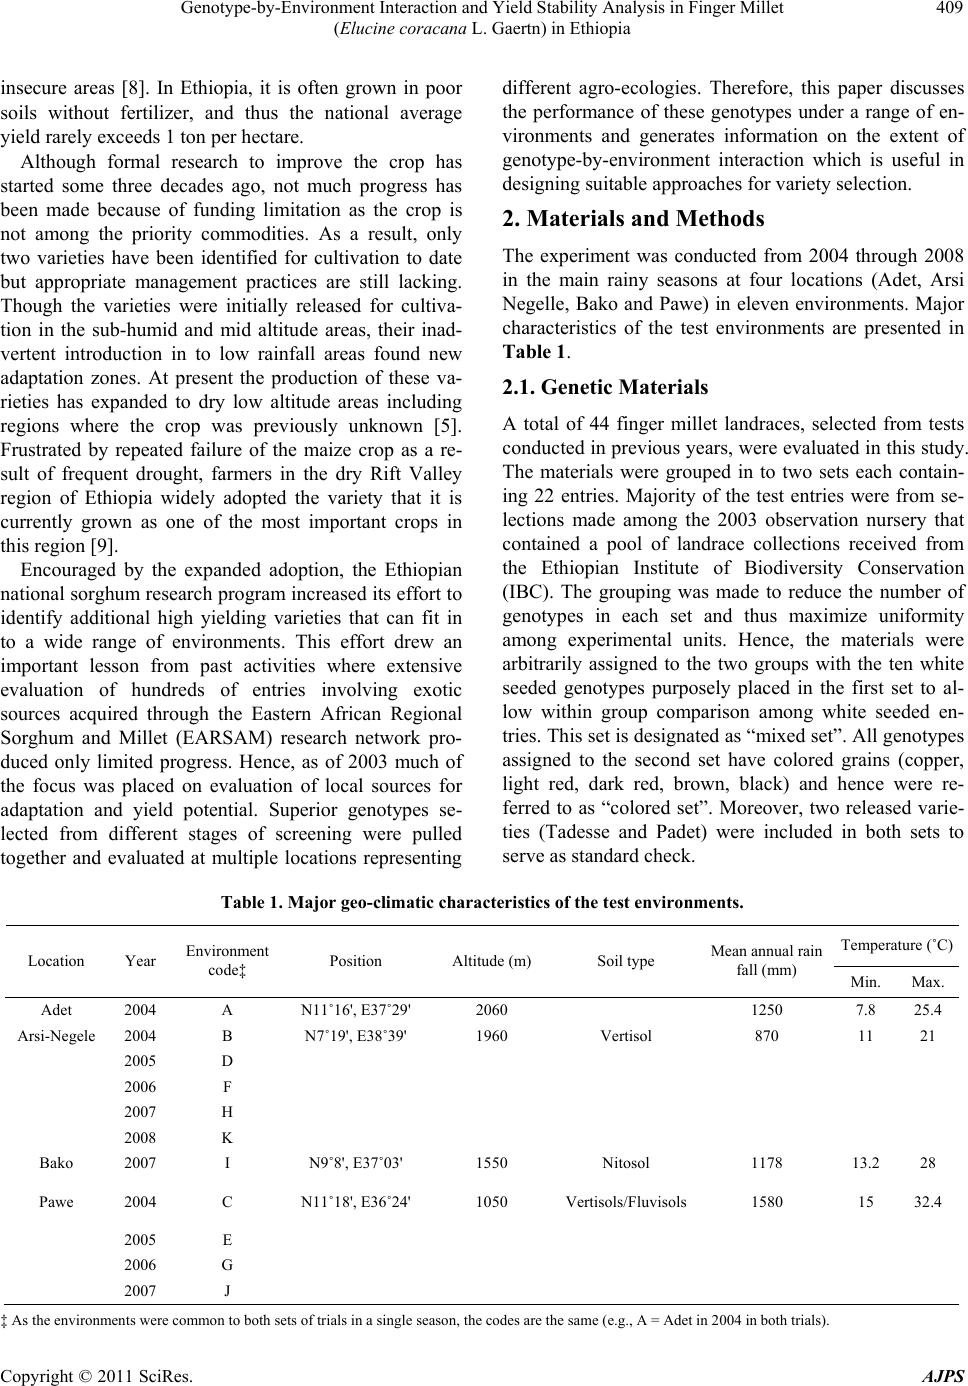 Genotype-by-Environment Interaction and Yield Stability Analysis in Finger Millet 409 (Elucine coracana L. Gaertn) in Ethiopia insecure areas [8]. In Ethiopia, it is often grown in poor soils without fertilizer, and thus the national average yield rarely exceeds 1 ton per hectare. Although formal research to improve the crop has started some three decades ago, not much progress has been made because of funding limitation as the crop is not among the priority commodities. As a result, only two varieties have been identified for cultivation to date but appropriate management practices are still lacking. Though the varieties were initially released for cultiva- tion in the sub-humid and mid altitude areas, their inad- vertent introduction in to low rainfall areas found new adaptation zones. At present the production of these va- rieties has expanded to dry low altitude areas including regions where the crop was previously unknown [5]. Frustrated by repeated failure of the maize crop as a re- sult of frequent drought, farmers in the dry Rift Valley region of Ethiopia widely adopted the variety that it is currently grown as one of the most important crops in this region [9]. Encouraged by the expanded adoption, the Ethiopian national sorghum research program increased its effort to identify additional high yielding varieties that can fit in to a wide range of environments. This effort drew an important lesson from past activities where extensive evaluation of hundreds of entries involving exotic sources acquired through the Eastern African Regional Sorghum and Millet (EARSAM) research network pro- duced only limited progress. Hence, as of 2003 much of the focus was placed on evaluation of local sources for adaptation and yield potential. Superior genotypes se- lected from different stages of screening were pulled together and evaluated at multiple locations representing different agro-ecologies. Therefore, this paper discusses the performance of these genotypes under a range of en- vironments and generates information on the extent of genotype-by-environment interaction which is useful in designing suitable approaches for variety selection. 2. Materials and Methods The experiment was conducted from 2004 through 2008 in the main rainy seasons at four locations (Adet, Arsi Negelle, Bako and Pawe) in eleven environments. Major characteristics of the test environments are presented in Table 1. 2.1. Genetic Materials A total of 44 finger millet landraces, selected from tests conducted in previous years, were evaluated in this study. The materials were grouped in to two sets each contain- ing 22 entries. Majority of the test entries were from se- lections made among the 2003 observation nursery that contained a pool of landrace collections received from the Ethiopian Institute of Biodiversity Conservation (IBC). The grouping was made to reduce the number of genotypes in each set and thus maximize uniformity among experimental units. Hence, the materials were arbitrarily assigned to the two groups with the ten white seeded genotypes purposely placed in the first set to al- low within group comparison among white seeded en- tries. This set is designated as “mixed set”. All genotypes assigned to the second set have colored grains (copper, light red, dark red, brown, black) and hence were re- ferred to as “colored set”. Moreover, two released varie- ties (Tadesse and Padet) were included in both sets to serve as standard check. Table 1. Major geo-climatic characteristics of the test environments. Temperature (˚C) Location Year Environment code‡ Position Altitude (m) Soil type Mean annual rain fall (mm) Min. Max. Adet 2004 A N11˚16', E37˚29' 2060 1250 7.8 25.4 Arsi-Negele 2004 B N7˚19', E38˚39' 1960 Vertisol 870 11 21 2005 D 2006 F 2007 H 2008 K Bako 2007 I N9˚8', E37˚03' 1550 Nitosol 1178 13.2 28 Pawe 2004 C N11˚18', E36˚24' 1050 Vertisols/Fluvisols1580 15 32.4 2005 E 2006 G 2007 J ‡ As the environments were common to bo th sets of tria ls in a single season, the codes are the same (e.g., A = Adet in 2004 in both trials). Copyright © 2011 SciRes. AJPS 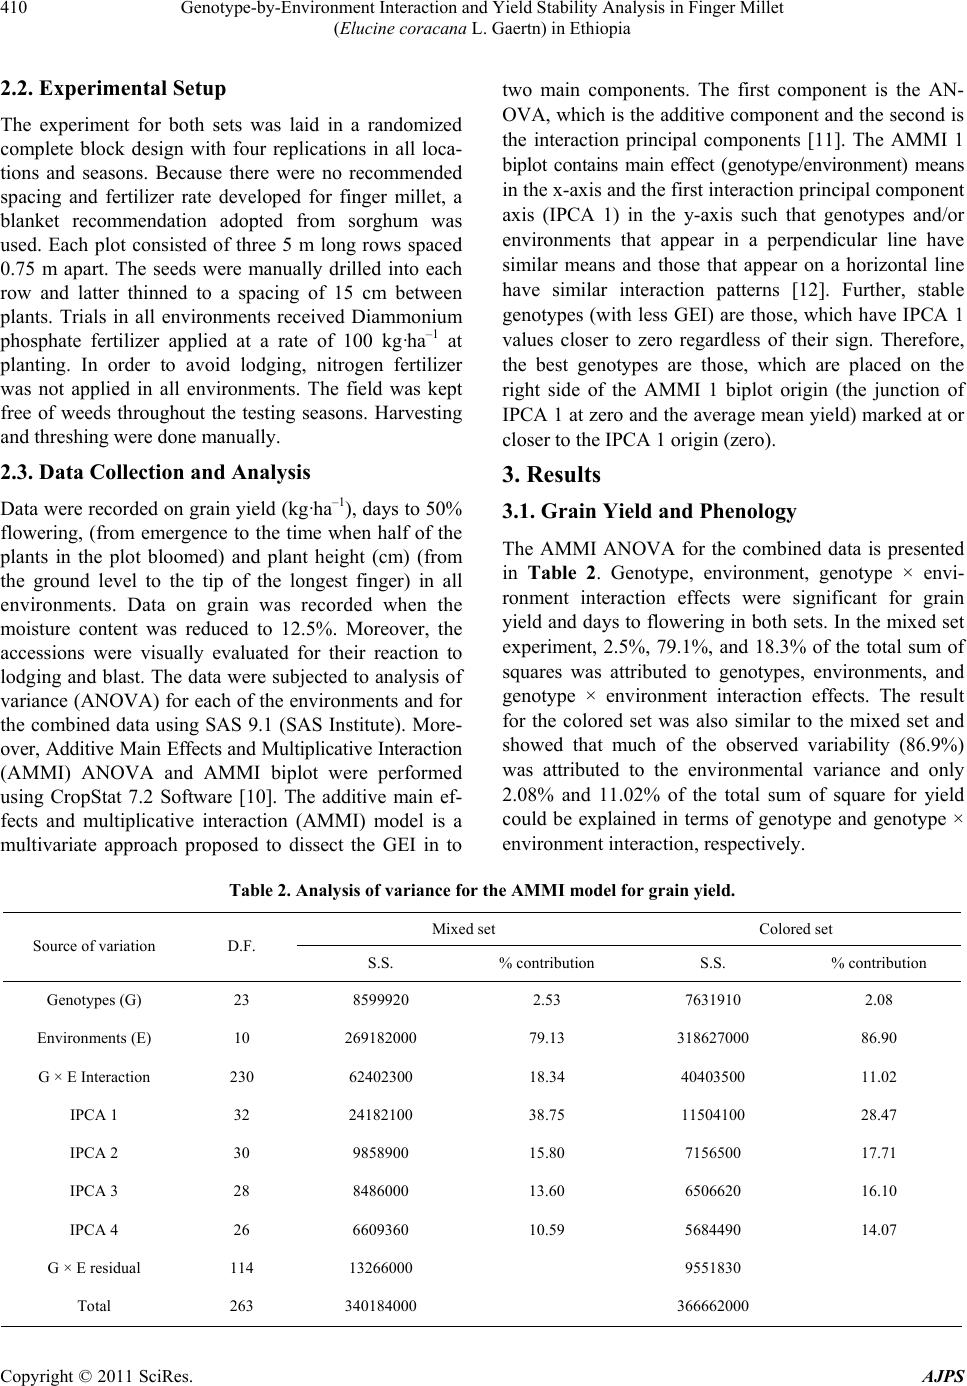 Genotype-by-Environment Interaction and Yield Stability Analysis in Finger Millet 410 (Elucine coracana L. Gaertn) in Ethiopia 2.2. Experimental Setup The experiment for both sets was laid in a randomized complete block design with four replications in all loca- tions and seasons. Because there were no recommended spacing and fertilizer rate developed for finger millet, a blanket recommendation adopted from sorghum was used. Each plot consisted of three 5 m long rows spaced 0.75 m apart. The seeds were manually drilled into each row and latter thinned to a spacing of 15 cm between plants. Trials in all environments received Diammonium phosphate fertilizer applied at a rate of 100 kg·ha–1 at planting. In order to avoid lodging, nitrogen fertilizer was not applied in all environments. The field was kept free of weeds throughout the testing seasons. Harvesting and threshing were done manually. 2.3. Data Collection and Analysis Data were recorded on grain yield (kg·ha–1), days to 50% flowering, (from emergence to the time when half of the plants in the plot bloomed) and plant height (cm) (from the ground level to the tip of the longest finger) in all environments. Data on grain was recorded when the moisture content was reduced to 12.5%. Moreover, the accessions were visually evaluated for their reaction to lodging and b last. The data were subjected to analysis of variance (ANOVA) for each of the environments and for the combined data using SAS 9.1 (SAS Institute). More- over, Additive Main Effects and Mu ltiplicative In teraction (AMMI) ANOVA and AMMI biplot were performed using CropStat 7.2 Software [10]. The additive main ef- fects and multiplicative interaction (AMMI) model is a multivariate approach proposed to dissect the GEI in to two main components. The first component is the AN- OVA, which is the additive component and the second is the interaction principal components [11]. The AMMI 1 biplot contains main effect (genotype/environment) means in the x-axis and the first interaction principal component axis (IPCA 1) in the y-axis such that genotypes and/or environments that appear in a perpendicular line have similar means and those that appear on a horizontal line have similar interaction patterns [12]. Further, stable genotypes (with less GEI) are those, which have IPCA 1 values closer to zero regardless of their sign. Therefore, the best genotypes are those, which are placed on the right side of the AMMI 1 biplot origin (the junction of IPCA 1 at zero and the average mean yield) marked at or closer to the IPCA 1 origin (zero). 3. Results 3.1. Grain Yield and Phenology The AMMI ANOVA for the combined data is presented in Table 2. Genotype, environment, genotype × envi- ronment interaction effects were significant for grain yield and days to flower ing in both sets. In the mixed set experiment, 2.5%, 79.1%, and 18.3% of the total sum of squares was attributed to genotypes, environments, and genotype × environment interaction effects. The result for the colored set was also similar to the mixed set and showed that much of the observed variability (86.9%) was attributed to the environmental variance and only 2.08% and 11.02% of the total sum of square for yield could be explained in terms of genotype and genotype × environment interaction, respectiv ely. Table 2. Analysis of variance for the AMMI model for grain yield. Mixed set Colored set Source of variation D.F. S.S. % contribution S.S. % contribution Genotypes (G) 23 8599920 2.53 7631910 2.08 Environments (E) 10 269182000 79.13 318627000 86.90 G × E Interaction 230 62402300 18.34 40403500 11.02 IPCA 1 32 24182100 38.75 11504100 28.47 IPCA 2 30 9858900 15.80 7156500 17.71 IPCA 3 28 8486000 13.60 6506620 16.10 IPCA 4 26 6609360 10.59 5684490 14.07 G × E residual 114 13266000 9551830 Total 263 340184000 366662000 Copyright © 2011 SciRes. AJPS 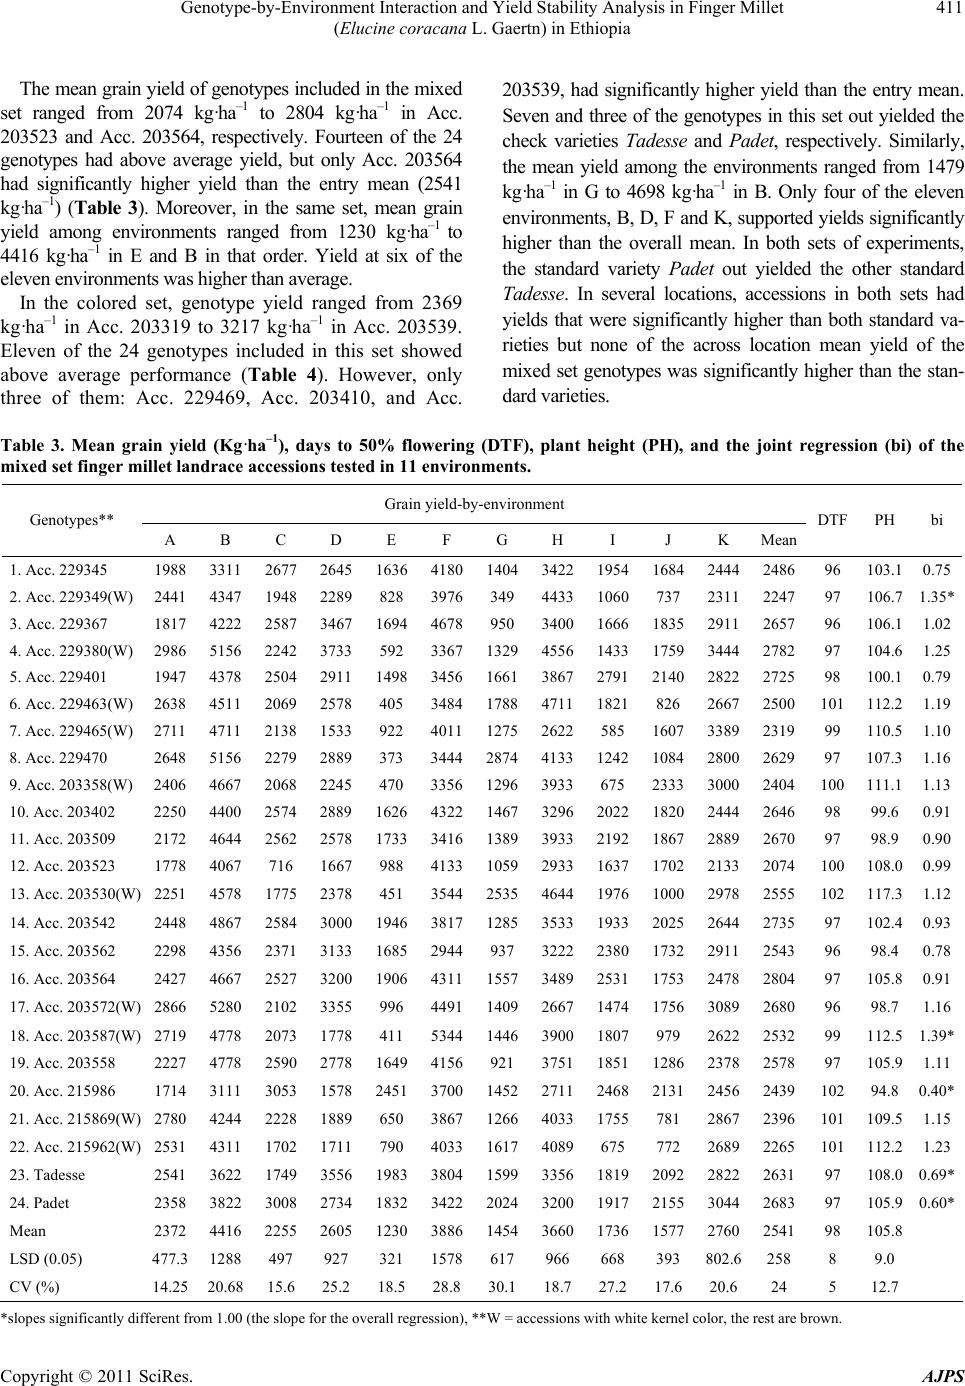 Genotype-by-Environment Interaction and Yield Stability Analysis in Finger Millet 411 (Elucine coracana L. Gaertn) in Ethiopia The mean grain yield of genotypes included in the mixed set ranged from 2074 kg·ha–1 to 2804 kg·ha–1 in Acc. 203523 and Acc. 203564, respectively. Fourteen of the 24 genotypes had above average yield, but only Acc. 203564 had significantly higher yield than the entry mean (2541 kg·ha–1) (Table 3). Moreover, in the same set, mean grain yield among environments ranged from 1230 kg·ha–1 to 4416 kg·ha–1 in E and B in that order. Yield at six of the eleven environments was higher than average. In the colored set, genotype yield ranged from 2369 kg·ha–1 in Acc. 203319 to 3217 kg·ha–1 in Acc. 203539. Eleven of the 24 genotypes included in this set showed above average performance (Table 4). However, only three of them: Acc. 229469, Acc. 203410, and Acc. 203539, had significantly higher yield than the entry mean. Seven and three of the genotypes in this set out yielded the check varieties Tadesse and Padet, respectively. Similarly, the mean yield among the environments ranged from 1479 kg·ha–1 in G to 4698 kg·ha–1 in B. Only four of the eleven environments, B, D, F and K, supported yields significantly higher than the overall mean. In both sets of experiments, the standard variety Padet out yielded the other standard Tadesse. In several locations, accessions in both sets had yields that were significantly higher than both standard va- rieties but none of the across location mean yield of the mixed set genotypes was significantly higher than the stan- dard va rietie s. Table 3. Mean grain yield (Kg·ha–1), days to 50% flowering (DTF), plant height (PH), and the joint regression (bi) of the mixed set finger millet landrace accessions tested in 11 environments. Grain yield-by-environment Genotypes** A B C D E F G H I J K Mean DTF PHbi 1. Acc. 229345 1988 33112677 2645 1636418014043422195416842444 2486 96 103.10.75 2. Acc. 229349(W) 2441 4347 1948 2289 828 39763494433 1060737 2311 2247 97 106.71.35* 3. Acc. 229367 1817 42222587 3467 169446789503400166618352911 2657 96 106.11.02 4. Acc. 229380(W) 2986 51562242 3733 592 336713294556143317593444 2782 97 104.61.25 5. Acc. 229401 1947 43782504 2911 1498345616613867279121402822 2725 98 100.10.79 6. Acc. 229463(W) 2638 4511 2069 2578 405 3484 1788 47111821826 2667 2500 101 112.21.19 7. Acc. 229465(W) 2711 47112138 1533 922 40111275262258516073389 2319 99 110.51.10 8. Acc. 229470 2648 51562279 2889 373 344428744133124210842800 2629 97 107.31.16 9. Acc. 203358(W) 2406 46672068 2245 470 33561296393367523333000 2404 100 111.11.13 10. Acc. 203402 2250 44002574 2889 1626432214673296202218202444 2646 98 99.60.9 1 11. Acc. 203509 2172 46442562 2578 1733341613893933219218672889 2670 97 98.90.90 12. Acc. 203523 1778 4067716 1667 988 41331 0592933163717022133 2074 100 108.00.99 13. Acc. 203530(W) 2251 45781775 2378 451 35442535464419761 0002978 2555 102 117.31.12 14. Acc. 203542 2448 48672584 3000 1946381712853533193320252644 2735 97 102.40. 93 15. Acc. 203562 2298 43562371 3133 168529449373222238017322911 2543 96 98. 40.78 16. Acc. 203564 2427 46672527 3200 1906431115573489253117532478 2804 97 105.80. 91 17. Acc. 203572(W) 2866 52802102 3355 996 44911409266714741 7563089 2680 96 98.71.16 18. Acc. 203587(W) 2719 4778 2073 1778 411 5344 1446 3900 1807979 2622 2532 99 112.51.39* 19. Acc. 203558 2227 47782590 2778 164941569213751185112862378 2578 97 105.91.11 20. Acc. 215986 1714 31113053 1578 2451370014522711246821312456 2439 102 94.80.40* 21. Acc. 215869(W) 2780 4244 2228 1889 650 3867 1266 4033 1755781 2867 2396 101 109.51.15 22. Acc. 215962(W) 2531 4311 1702 1711 790 4033 1617 4089675772 2689 2265 101 112.21.23 23. Tadesse 2541 36221749 3556 1983380415993356181920922822 2631 97 108.00.69* 24. Padet 2358 38223008 2734 1832342220243200191721553044 2683 97 105.90.60* Mean 2372 44162255 2605 1230388614543660173615772760 2541 98 105.8 LSD (0.05) 477.3 1288 497 927 321 1578 617966668393 802.6 258 8 9.0 CV (%) 14.25 20.6815.6 25.2 18.528.830. 118.727.217.620.6 24 5 12.7 *slopes sig nificantly different from 1.00 (the slope for the overall regression), **W = accessions with white kern el color, t he rest are brown. Copyright © 2011 SciRes. AJPS  Genotype-by-Environment Interaction and Yield Stability Analysis in Finger Millet 412 (Elucine coracana L. Gaertn) in Ethiopia Table 4. Mean grain yield (Kg·ha–1), days to 50% flowering (DTF), plant height (PH), and the joint regression (bi) of the col- ored set finger millet landrace accessions tested in 11 environments. Grain yield-by-environment Genotypes A B C D E F G H I J K Mean DTF PH bi 1. Acc. 229376 2497 4311 3063 5211 1789422013972228195420563400 2921 93 101.51.02 2. Acc. 229381 2147 4578 2661 4833 1846350513642484119420822867 2687 93 103.00.987 3. Acc. 229383 2604 4045 2292 4022 2027432215271984166622583578 2757 91 100.50.857 4. Acc. 229398 2902 4156 2482 5411 1389426711131774143317602911 2691 93 108.01.175 5. Acc. 229399 2652 4867 2027 4722 1568407115612058279122893245 2895 91 101.40.982 6. Acc. 229400 2630 3978 2727 4045 2414366524392405182122622289 2788 91 99.80.594* 7. Acc. 229407 2792 4489 2643 4244 2417425313042042585 27542867 2763 94 101.40.971 8. Acc. 229415 2944 4845 2207 4445 2485393317702093124226863156 2891 94 104.40.941 9. Acc. 229417 2876 5289 2256 4889 1990440011061670595 21623622 2805 92 99.51.318* 10. Acc. 229440 2884 5178 2054 4873 1455361317591459202218241956 2643 88 105.41.088 11. Acc. 229442 2797 4933 2264 4800 1723346712761444219219823334 2746 94 110.11.068 12. Acc. 229458 3172 4511 2416 4667 2080389613991340162923113556 2816 93 104.71.026 13. Acc. 229461 3199 4978 2437 4211 2098420013402120197526303000 2926 94 106.60.95 14. Acc. 229462 2842 4022 2206 4613 2164313616032025193324513000 2727 90 104.60.774* 15. Acc. 229468 2909 5222 2093 4545 1940342214221616237921723289 2819 92 109.01.011 16. Acc. 229469 2810 5022 2303 5656 1840424415371719282719113533 3036 91 111.61.169 17. Acc. 203410 3330 4756 2534 5444 2086404514032246147422394089 3059 92 104.61.142 18. Acc. 203539 3100 5511 2541 4578 3627384712472334180735723222 3217 90 85.50.914 19. Acc. 203289 2767 4267 2005 4656 1742324713561887185124892978 2658 94 99.00.895 20. Acc. 203300 2347 4511 2067 4456 18354531163217082468750 2800 2646 95 103.41.02 21. Acc. 215961 2341 4134 2301 4889 1746404515381709146018533156 2652 94 99.21.026 22. Acc. 203319 2759 5200 2138 3111 898 3756 1740 1434830 1180 3011 2369 93 106.91.048 23. Tadesse 2623 5022 2403 4434 1621335614711429181916362822 2603 92 106.81.038 24. Padet 2661 4934 2763 3933 1608422512011820191721963045 2755 95 102.10.99 Mean 2774 4698 2370 4612 1933390314791876174421463113 2786 93 103.3 LSD (0.05) 495 865 618 1110 457 1235 591 613 653 494 915 232 3 6.6 CV (%) 12.62 13.04 18.5 17 16.822.428.323.126.516.320.8 19.65 3 9.8 *Slopes significantly different from 1.00 (the slope for the overall regression). Days to flowering ranged from 96 to 102 in the mixed set, and from 88 to 95 in the colored set. Similarly, the range for plant height was 94.5 cm to 117.3 cm in the mixed set and 85.5 cm to 111.6 cm in the colored set. Plant height (r1 = –0.36, r2 = –0.34) and days to flower- ing (r1 = –0.53, r2 = –0.23) were found to have negative correlation with grain yield. 3.2. Response and Stability of the Landraces Genotypes, Acc. 229349 and Acc. 203587 from the mixed set had linear regression coefficient significantly higher than 1.0 (the overall regression) and hence were highly responsive to the suitable environments (Table 3 ). However, since they are tall accessions (Table 2), adding more inputs may enhance lodging. On the other hand, Acc. 215986, Tadesse and Padet had slopes significantly lower than 1.0 and hence were b etter adapted to marginal environments. The AMMI analysis showed that all of the 4 principal component axes were significant in both sets. However, 54.6% and 46.19% of the GEI sum of squares in the mixed set and in the colored set, respectively, were con- tributed by the first two interaction principal components (IPCA1 and IPCA2). Five accessions in the mixed set, Acc. Copyright © 2011 SciRes. AJPS  Genotype-by-Environment Interaction and Yield Stability Analysis in Finger Millet 413 (Elucine coracana L. Gaertn) in Ethiopia 229465, Acc. 203509, Acc. 203523, Acc. 203572, and Acc. 203558 were shown to have the highest stability as revealed by their relative position with respect to the biplot origin (Figure 1). However, none of these acces- sions had significantly higher yield than the overall entry mean and the check varieties. Among the colored set, five accessions, Acc. 229458, Acc. 203410, Acc. 203289, Acc. 215961, Acc. 203319, and the check variety Padet showed better stability than the rest of the en tries (Figure 2). Again none of these accessions did exceed the stan- dard checks except Acc. 203410 that produced signifi- cantly higher yield than both check varieties. This acces- sion is also within the same range of maturity (days to flowering) and height group with that of the standard varieties. 4. Discussion In general, the genotypic variation in the studied traits was considerably narrow probably because of the rigor- ous selection process conducted in the previous year which might have not intentionally targeted these traits. The influence of GEI resulted in variable performance of the genotypes in the different test environments. Varie- ties with high levels of heterozygosity and/or heteroge- neity are less sensitive to env ironmental variatio n and are, therefore, more stable-yielding. On the other hand, the Elucines generally are reported to be strictly autogamous with low levels of heterozygosity. This is perhaps the major factor that contributed to the high GEI in finger millet in the present study. Figure 1. AMMI 1 Biplot of the 24 finger millet varieties and the 11 test environments in the mixed set. Copyright © 2011 SciRes. AJPS  Genotype-by-Environment Interaction and Yield Stability Analysis in Finger Millet 414 (Elucine coracana L. Gaertn) in Ethiopia Figure 2. AMMI1 Biplot of the 24 finger millet varieties and the 11 test environments in the colored set. While positive correlation between days to flower- ing/maturity and yield seems to be a common phenome- non in crop plants, the negative correlation in the present experiment was perhaps due to the concomitant occur- rence of late flowering with the suitable period of fungal (blast) infection that reduces yield. Moreover, the nega- tive correlation between plant height and grain yield might be due to lodging. Taller plants tend to lodge more than shorter ones and lo se their yield . Some of the testing sites (especially Pawe and Bako) have high rainfall and high temperature, which is suitable for the development of fungal diseases like blast (Pyricularia spp.) that re- duce yield more on the lodged plants. Various models to measure stability of genotype per- formance across multi-environments are available in lit- erature. At present, the most widely used model is AMMI, which involves both ANOVA and principal component analysis to dissect GEI into the causes of variation. However, stability per se is not necessarily a positive factor and it is desirable only when associated with a high mean yield (Yan and Hunt, 2002). In the present experiment, a white seed accession (Acc. 203572) from the mixed set and three other accessions (Acc. 229469, Acc. 2 03410 and Acc. 2 03539) fro m the color ed set were found to be most stable based on the AMMI model and also had above average mean grain yield across environments and thus are recommended for re- lease as cultivars to contribute for enh anced finger millet production in these environments. The response of Tadesse to the poor environments in the first set was in agreement with the previous observation during the scal- ing up activity in the dry lowland areas of the Ethiopian Copyright © 2011 SciRes. AJPS  Genotype-by-Environment Interaction and Yield Stability Analysis in Finger Millet 415 (Elucine coracana L. Gaertn) in Ethiopia rift valley (Siraro and Alaba). However, a similar re- sponse was not observed in the other set because coeffi- cient of joint regression (bi) is a relative measure, which varies with the genotypes included in the set [13]. In the past decade, 2001-2010, finger millet production area in Ethiopia increased from 342,120 ha to 368,9 99 ha with an increase of 7.3%, and the production increased from 3,769,290 to 5,241,911 quintals with a proportion of 28% [4,14]. This was partly due to the adoption of improved varieties and production practices or possibly an indication of the fact that agriculture is being pushed to the more marginal areas due to the associated change in climate demanding adaptable crops. Thus, a continu- ous supply of high yielding varieties that have stable per- formance in a wide range of environments is needed for sustainable production. To this end, we believe that the 4 genotypes selected in this experiment will have signifi- cant contribution to enhance production in areas where there is similar agro-climatic conditions with the test environments. In conclusion, east Africa is reported to be a region of contrasts, where Africa’s lowest and highest elevations are found; the differences of which coupled with the dif- ferences in rainfall and temperature over short geo- graphic distances provided varying environments suitable for crop diversification, early domestication and subse- quent cultivation of landraces. In Ethiopia, diverse forms of finger millet landraces are found in altitude ranges of around 500 m (e.g. Chikumbo) to 2500 m (e.g. South Gondar). However, selection of high yielding and stable genotypes in nation wide multi-environments has not been successful. While finger millet can be a potential cereal for food security under the rapidly changing cli- mate, alleviating its constraints will remain a challenging task for the researchers. In addition to the prevailing production constraints of finger millet, which are mainly related to poor management practices, some more are still emerging. For instance, in northern Ethiopia, the parasitic weed, Striga spp. is expanding its host range from maize and sorghum, its principal hosts to small ce- reals, tef and finger millet. Hence, exhaustive work should be done on identifying the landraces and side by side introduction and evaluation of exotic germplasm. Moreover, no agronomic recommendations such as spa- cing and fertilizer rate are available to date for finger millet in the country. Therefore, multidisciplinary work is binding in order to break the yield barriers and to reap the potential from these untapp ed genetic resources. 5. Acknowledgements We thank the sorghum and millets technical staff at Melkas- sa, Arsi Negelle, Pawe, Adet and Bako Research Centers. REFERENCES [1] V. G. Reddy, H. D. Upadhyaya, C. L. L. Gowda and S. Singh, “Characterization of Eastern African Finger Millet Germplasm for Qualitative Quantitative Characters at ICRISAT,” Journal of SAT Agricultural Research, Vol. 7, 2009. [2] ICRISAT and FAO, “The World Sorghum and Millet Economies: Facts, Trends and Outlook,” ICRISAT, An- dhra Pradesh, 1996. [3] A. Wondimu and F. Tekabe, “Utilization of Teff in the Ethiopian Diet,” In: H. Tefera, G. Belay and M. Sorrells, Eds., Proceedings of the International Workshop on Tef Genetics and Improvement, Debre Zeit, 2001. [4] Central Statistical Agency (CSA), “Agricultural Sample Survey,” Report on Area and Production of Crops (Pri- vate Peasant Holdings, Meher Season), Statistical Bulle- tin 446, Addis Ababa, May 2010. [5] A. Adugna, “The Role of Introduced Sorghum and Mil- lets in Ethiopian Agriculture,” Journal of SAT Agricul- tural Research, Vol. 3, December 2007. [6] E. Degu, A. Adugna, T. Tadesse, and T. Tesso, “Genetic Resources Breeding and Production of Millets in Ethiopia,” In: Z. Tadele, Ed., New Approaches to Plant Breeding of Orphan Crops in Africa: Proceedings of an International Conference, Bern, 19-21 September 2007, pp. 43-56. [7] M. H. Mengesha, K. E. Prasada Rao and S. Appa Rao, “Genetic Diversity of Sorghum and Millets in Eastern Africa,” 6th Edition, Eastern African Research on Sor- ghum and Millets Workshop, Mogadishu, 1988. [8] National Research Council (NRC), “Lost Crops of Af- rica,” Grains: Board on Science and Technology for In- ternational Development, National Academy Press, Washington D. C., Vol. 1, 1996. [9] C. Anchala, H. Kidane and T. Mulatu, “Impacts of Im- proved Finger Millet Technology Promotion in the Cen- tral Rift Valley of Ethiopia,” In: T. Abate ed., Success with Value Chain, Ethiopian Institute of Agricultural Re- search, Addis Ababa, 2006, pp. 129-140. [10] International Rice Research Institute (IRRI), “CropStat for Windows 7.2,” Dapo, Metro Manila, 2007. [11] R. W. Zobel, M. J. Wright and H. G. Gauch Jr., “Statisti- cal Analysis of a Yield Trial,” Agronomy Journal, Vol. 80, 1988, pp. 388-393. [12] J. Crossa, H. G. Gauch and R. W. Zobel, “Additive Main Effects and Multiplicative Interaction Analysis of Two International Maize Cultivar Trials,” Crop Science, Vol. 30, No. 3, 1990, pp. 493-500. doi:10.2135/cropsci1990.0011183X003000030003x [13] A. Adugna, “Assessment of Yield Stability in Sorghum Using Univariate and Multivariate Statistical Approach- es,” Hereditas, Vol. 145, 2008, pp. 28-37. [14] Central Statistical Agency (CSA), “Agricultural Sample Survey,” Report on Area and Production of Crops for Pri- vate Peasant Holdings, Meher Season, Addis Ababa, 2001. Copyright © 2011 SciRes. AJPS |