

Paper Menu >>
Journal Menu >>
 Journal of Service Science and Management, 2011, 4, 284-290 doi:10.4236/jssm.2011.43034 Published Online September 2011 (http://www.SciRP.org/journal/jssm) Copyright © 2011 SciRes. JSSM Customer Segmentation Using CLV Elements Mitra Bokaei Hosseni, Mohammad Jafar Tarokh Information Technology Group, Industrial Engineering Department, K. N. Toosi University of Technology, Tehran, Iran. Email: [email protected], [email protected] Received June 22nd, 2011; revised July 28th, 2011; accepted August 4th, 2011. ABSTRACT To have an effective customer relationship management, it is essential to have information about the different segments of the customers and predict the future profit of them. For this reason companies can use customer lifetime value that consists of three facto rs-current value of customers, potential value, and customer churn. Potential value of customers focuses on the cross-selling opportunities for current customers. Therefore, cross selling models are built on the total customers of the database that is not interesting. To overcome this, we presented a framework that estimates the current value and churn probability for the cu stomers and then segm ented them base on these two elements and select the most profitable segment for th e cross-selling models. In this study we predict the customer churn ba se on logistic regression as a case study on the insurance database. Keywords: CRM, Customer Lifetime Value, Churn Predict i on, Cross-selling, Logistic Regression 1. Introduction Life insurance is become one of the popular insurances in recent years. It is divided into many categories which each of them delivers different services to the customer. Customers agree to pay for the insurance in different ways. General way to pay for the agreed amount is monthly payment. Therefore, it is important for the insurance company to know about its customers and their payment styles to manage its relationships with them. The insurance company must have the information about which customers are likely to leave the company or are likely to pay their loans not in the defined time. It also must understand its loyal customers and use different marketing strategies to retain them. Some customers repeatedly switch providers, or “churn”, it is also obvious in insurance industry. Different methods for churn rate measurement were mentioned in the literature. Companies can use data mining techniques to identify the characteristics of the customers who will remain loyal or the churners. In insurance industry rapid customer churn is a significant problem due to the competitive environment of this industry. Wu et al. used decision rules and data mining to investigate the potential customers for an existing or new insurance product [1]. These methods enable companies to invest in customers who will produce the most profit for the company. Many life time value models were presented in order to evaluate the customer value in its lifecycle. Each of them had specific characteristics that were suitable for special industry. The usage of these models also depends on the available data about that industry. Customer value can be identified by three factors, current value, potential value and churn rate and also by socio-demographic data from the customers. Up-selling, cross-selling, and custo- mer retention is defined as the three core activities for increasing the customer value [2]. Current cross-selling models were being built on the total customer database of the organization. This leads to a high overhead for building cross-selling models because the whole database contains also the data from the unprofitable customers and churners. Also the current LTV models needed data from different products that a customer had for a period of time to calculate the potential value of the customers. Some organizations lack from these kinds of data. To overcome these problems men- tioned, it could be interesting to build a cross-selling mo- del on the loyal customers with appropriate current value. LTV is based on the understanding of the behavior of the profitable customers of the organization. For this reason, this study proposed a model to understand the profitable segments of the customers based on the LTV components and socio-demographic data of customers. First we evaluated the current value of each customer based on the transactional data. Then the churn rates were evaluated and loyal customers were predicted with the use of logistic regression. The customers were segmented  Customer Segmentation Using CLV Elements285 based on the current value and customer loyalty that were calculated. After analyzing and selecting the profitable segments organizations can use the cross-selling strategies to develop the relationship between customers and the organization. For this reason, customers’ data should be collected for evaluating the life time value for each cus- tomer. In this paper we presented a new model for understan- ding the customer behavior based on the customer lifetime value. We built a cross-selling model on the loyal customers with appropriate current value. We also examined this model to data that was collected from an insurance company. Logistic regression was selected to predict the customer behavior based on these data. This paper is organized as follows. Section 2 presents an overview about life time value literature and related works and also review of mathematical model we used for prediction. Section 3 specifies the model and section 4 evaluates the model based on the real data collected from the insurance company. Section 5 includes the conclusion of the research. 2. Literature Review This section is divided into three parts, first we review the CRM dimensions and mention which dimension we are going to focus. Second, we review the LTV defini- tions and models. Third, we describe the mathematical models for prediction we use for this paper. 2.1. CRM Dimensions for Customer Behavior Classification To manage the different segments of customers managers can use customer relationship management (CRM) as a leading business strategy in a competitive environment, while retention of the current customers in a competitive environment is vital for survival of the companies. CRM pursues long term relationship with profitable customers. There are different definitions in the literature for the customer relationship management, that we mention some of them here. Ling & Yen believe that CRM comprises a set of processes and enabling systems sup- porting a business strategy to build long term, profitable relationships with specific customers [3]. Swift defined CRM as an enterprise approach to understand and influence customer behavior through meaningful com- munications in order to improve customer acquisition, customer retention, customer loyalty, and customer profitability [3]. Parvatiyar and Sheth defined CRM as a comprehensive strategy and process of acquiring, retaining, and partnering with selective customers to create superior value for the company and the customer. It involves the integration of marketing, sales, customer service, and the supply chain functions of the organiza- tion to achieve greater efficiencies and effectiveness in delivering customer value [4]. Kincaid viewed CRM as the strategic use of information, processes, technology, and people to manage the customer's relationship with your company (Marketing, Sales, Services, and Support) across the whole customer life cycle [5]. Lawson-Body & Limayen believe that CRM refers to all business activities directed toward initiating, establishing, maintai- ning, and developing successful long-term relational exchanges and it is the set of methodologies and tools that help an enterprise manage customer relationships in an organized way [6]. All these definitions emphasized on the importance of customer acquisition and retention through business intelligence to provide value to the organization and customers. It is implied in the literature that customer acquisition is more expensive than customer retention because the lack of information on new customers makes it difficult to target the appropriate customers. Therefore, precise evaluations of customer value and customer segmentation are critical for success- ful CRM. Customer relationship management also identi- fies the suitable products for a special segment. Increased customer retention and loyalty, higher custo- mer profitability, creation value for the customer, custo- mization of the products and services, and lower process, higher quality products and services are mentioned as the potential benefits of CRM [7,8]. Marketers believe that 80% of the profits are produced by to 20% of profitable customers and 80% of the costs are produced by top 20% of unprofitable customers. This rule is called the 80/20 rule that the marketers use it for customer profitability evaluation [9,10]. By these definitions it may seem that CRM is only useful for managing the relationships between businesses and customers. A closer examination revealed that CRM is also applicable to business-to-business environments. CRM helps smooth the process when various representa- tives of seller and buyer companies communicate and collaborate [11]. CRM is used to identify the most profitable customers and allocate the resources to this segment of customers to achieve more profit. The four dimensions of the CRM are essential efforts to gain customer insight [12]. CRM dimensions are listed below: Customer identification: CRM begins its work with this cycle. It is also known as customer acquisition. In this cycle company seeks its target customers based on the organization and marketing strategy. This target is assumed profitable for the organization. In this cycle organization analyses the target customer and segments the target customer. Analy- zing the target customer involves seeking the pro- fitable segments of customers through analysis of Copyright © 2011 SciRes. JSSM 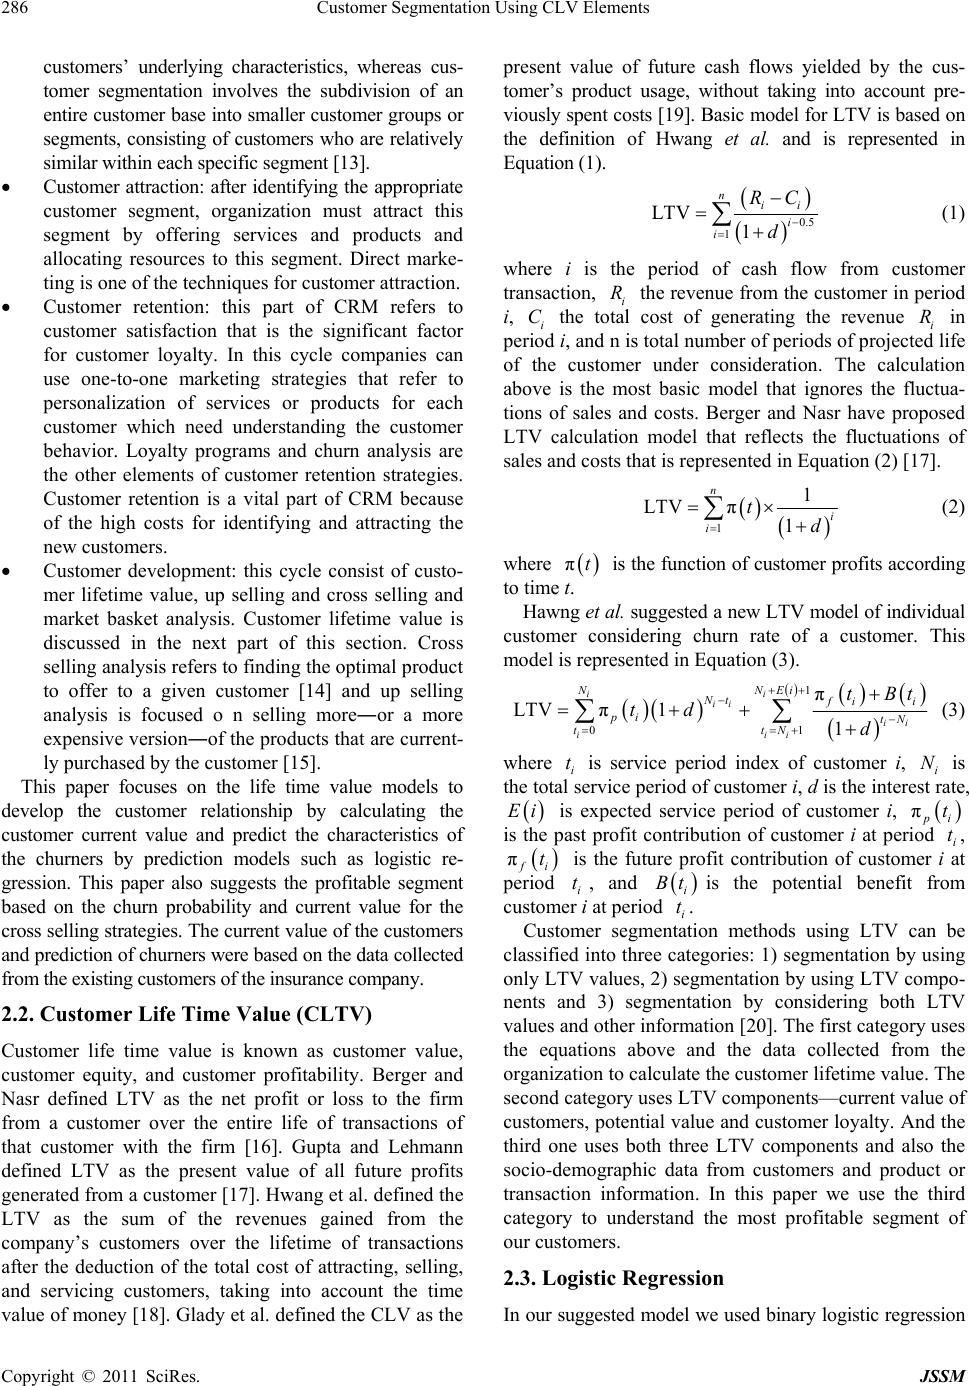 Customer Segmentation Using CLV Elements 286 customers’ underlying characteristics, whereas cus- tomer segmentation involves the subdivision of an entire customer base into smaller customer groups or segments, consisting of customers who are relatively similar within each specific segment [13]. Customer attraction: after identifying the appropriate customer segment, organization must attract this segment by offering services and products and allocating resources to this segment. Direct marke- ting is one of the techniques for customer attraction. Customer retention: this part of CRM refers to customer satisfaction that is the significant factor for customer loyalty. In this cycle companies can use one-to-one marketing strategies that refer to personalization of services or products for each customer which need understanding the customer behavior. Loyalty programs and churn analysis are the other elements of customer retention strategies. Customer retention is a vital part of CRM because of the high costs for identifying and attracting the new customers. Customer development: this cycle consist of custo- mer lifetime value, up selling and cross selling and market basket analysis. Customer lifetime value is discussed in the next part of this section. Cross selling analysis refers to finding the optimal product to offer to a given customer [14] and up selling analysis is focused o n selling more―or a more expensive version―of the products that are current- ly purchased by the customer [15]. This paper focuses on the life time value models to develop the customer relationship by calculating the customer current value and predict the characteristics of the churners by prediction models such as logistic re- gression. This paper also suggests the profitable segment based on the churn probability and current value for the cross selling strategies. The current value of the customers and prediction of churners were based on the data collected from the existing customers of the insurance company. 2.2. Customer Life Time Value (CLTV) Customer life time value is known as customer value, customer equity, and customer profitability. Berger and Nasr defined LTV as the net profit or loss to the firm from a customer over the entire life of transactions of that customer with the firm [16]. Gupta and Lehmann defined LTV as the present value of all future profits generated from a customer [17]. Hwang et al. defined the LTV as the sum of the revenues gained from the company’s customers over the lifetime of transactions after the deduction of the total cost of attracting, selling, and servicing customers, taking into account the time value of money [18]. Glady et al. defined the CLV as the present value of future cash flows yielded by the cus- tomer’s product usage, without taking into account pre- viously spent costs [19]. Basic model for LTV is based on the definition of Hwang et al. and is represented in Equation (1). 0.5 1 LT V 1 nii i i RC d (1) where i is the period of cash flow from customer transaction, i the revenue from the customer in period i, i the total cost of generating the revenue i in period i, and n is total number of periods of projected life of the customer under consideration. The calculation above is the most basic model that ignores the fluctua- tions of sales and costs. Berger and Nasr have proposed LTV calculation model that reflects the fluctuations of sales and costs that is represented in Equation (2) [17]. R C R 1 1 LTV π 1 n i i td (2) where πt is the function of customer profits according to time t. Hawng et al. suggested a new LTV model of individual customer considering churn rate of a customer. This model is represented in Equation (3). 1 01 π LTV π1 1 i iii ii iii NEi NNt f i pi tN ttN tBt td d i (3) where i is service period index of customer i, i is the total service period of customer i, d is the interest rate, t N Ei is expected service period of customer i, π p i tt is the past profit contribution of customer i at period i, π f i t is the future profit contribution of customer i at period i, and t i Bt tis the potential benefit from customer i at period . i Customer segmentation methods using LTV can be classified into three categories: 1) segmentation by using only LTV values, 2) segmentation by using LTV compo- nents and 3) segmentation by considering both LTV values and other information [20]. The first category uses the equations above and the data collected from the organization to calculate the customer lifetime value. The second category uses LTV components—current value of customers, potential value and customer loyalty. And the third one uses both three LTV components and also the socio-demographic data from customers and product or transaction information. In this paper we use the third category to understand the most profitable segment of our customers. 2.3. Logistic Regression In our suggested model we used binary logistic regression Copyright © 2011 SciRes. JSSM 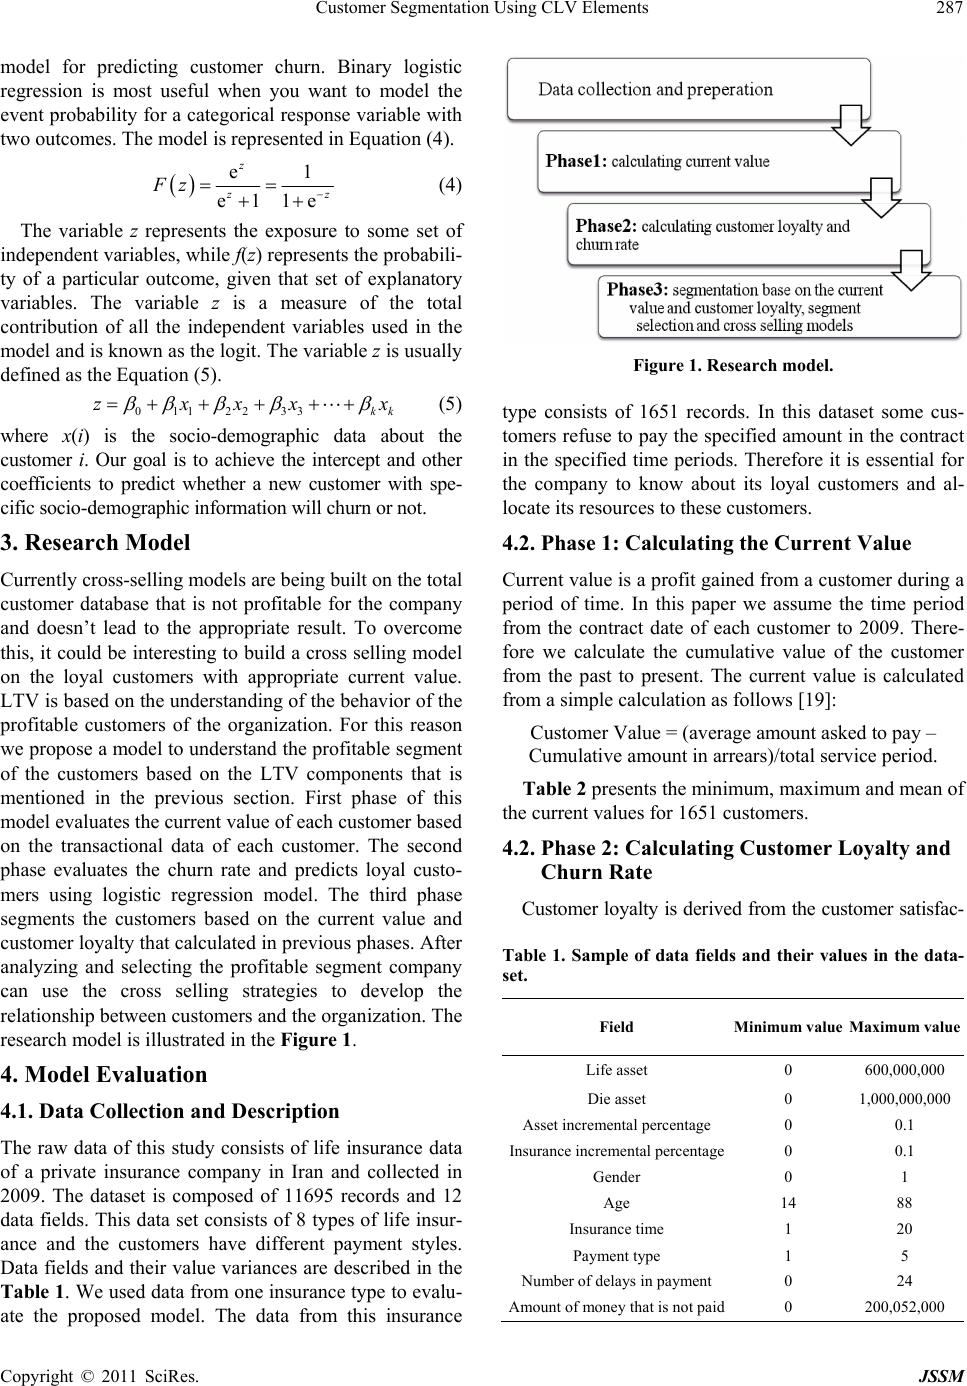 Customer Segmentation Using CLV Elements287 model for predicting customer churn. Binary logistic regression is most useful when you want to model the event probability for a categorical response variable with two outcomes. The model is represented in Equation (4). e1 e11e z z z Fz (4) The variable z represents the exposure to some set of independent variables, while f(z) represents the probabili- ty of a particular outcome, given that set of explanatory variables. The variable z is a measure of the total contribution of all the independent variables used in the model and is known as the logit. The variable z is usually defined as the Equation (5). 0112233kk zxxxx (5) where x(i) is the socio-demographic data about the customer i. Our goal is to achieve the intercept and other coefficients to predict whether a new customer with spe- cific socio-demographic information will churn or not. 3. Research Model Currently cross-selling models are being built on the total customer database that is not profitable for the company and doesn’t lead to the appropriate result. To overcome this, it could be interesting to build a cross selling model on the loyal customers with appropriate current value. LTV is based on the understanding of the behavior of the profitable customers of the organization. For this reason we propose a model to understand the profitable segment of the customers based on the LTV components that is mentioned in the previous section. First phase of this model evaluates the current value of each customer based on the transactional data of each customer. The second phase evaluates the churn rate and predicts loyal custo- mers using logistic regression model. The third phase segments the customers based on the current value and customer loyalty that calculated in previous phases. After analyzing and selecting the profitable segment company can use the cross selling strategies to develop the relationship between customers and the organization. The research model is illustrated in the Figure 1. 4. Model Evaluation 4.1. Data Collection and Description The raw data of this study consists of life insurance data of a private insurance company in Iran and collected in 2009. The dataset is composed of 11695 records and 12 data fields. This data set consists of 8 types of life insur- ance and the customers have different payment styles. Data fields and their value variances are described in the Table 1. We used data from one insurance type to evalu- ate the proposed model. The data from this insurance Figure 1. Research model. type consists of 1651 records. In this dataset some cus- tomers refuse to pay the specified amount in the contract in the specified time periods. Therefore it is essential for the company to know about its loyal customers and al- locate its resources to these customers. 4.2. Phase 1: Calculating the Current Value Current value is a profit gained from a customer during a period of time. In this paper we assume the time period from the contract date of each customer to 2009. There- fore we calculate the cumulative value of the customer from the past to present. The current value is calculated from a simple calculation as follows [19]: Customer Value = (average amount asked to pay – Cumulative amount in arrears)/total service period. Table 2 presents the minimum, maximum and mean of the current values for 1651 customers. 4.2. Phase 2: Calculating Customer Loyalty and Churn Rate Customer loyalty is derived from the customer satisfac- Table 1. Sample of data fields and their values in the data- set. Field Minimum value Maximum va l u e Life asset 0 600,000,000 Die asset 0 1,000,000,000 Asset incremental percentage 0 0.1 Insurance incremental percentage0 0.1 Gender 0 1 Age 14 88 Insurance time 1 20 Payment type 1 5 Number of delays in payment 0 24 Amount of money that is not paid0 200,052,000 Copyright © 2011 SciRes. JSSM 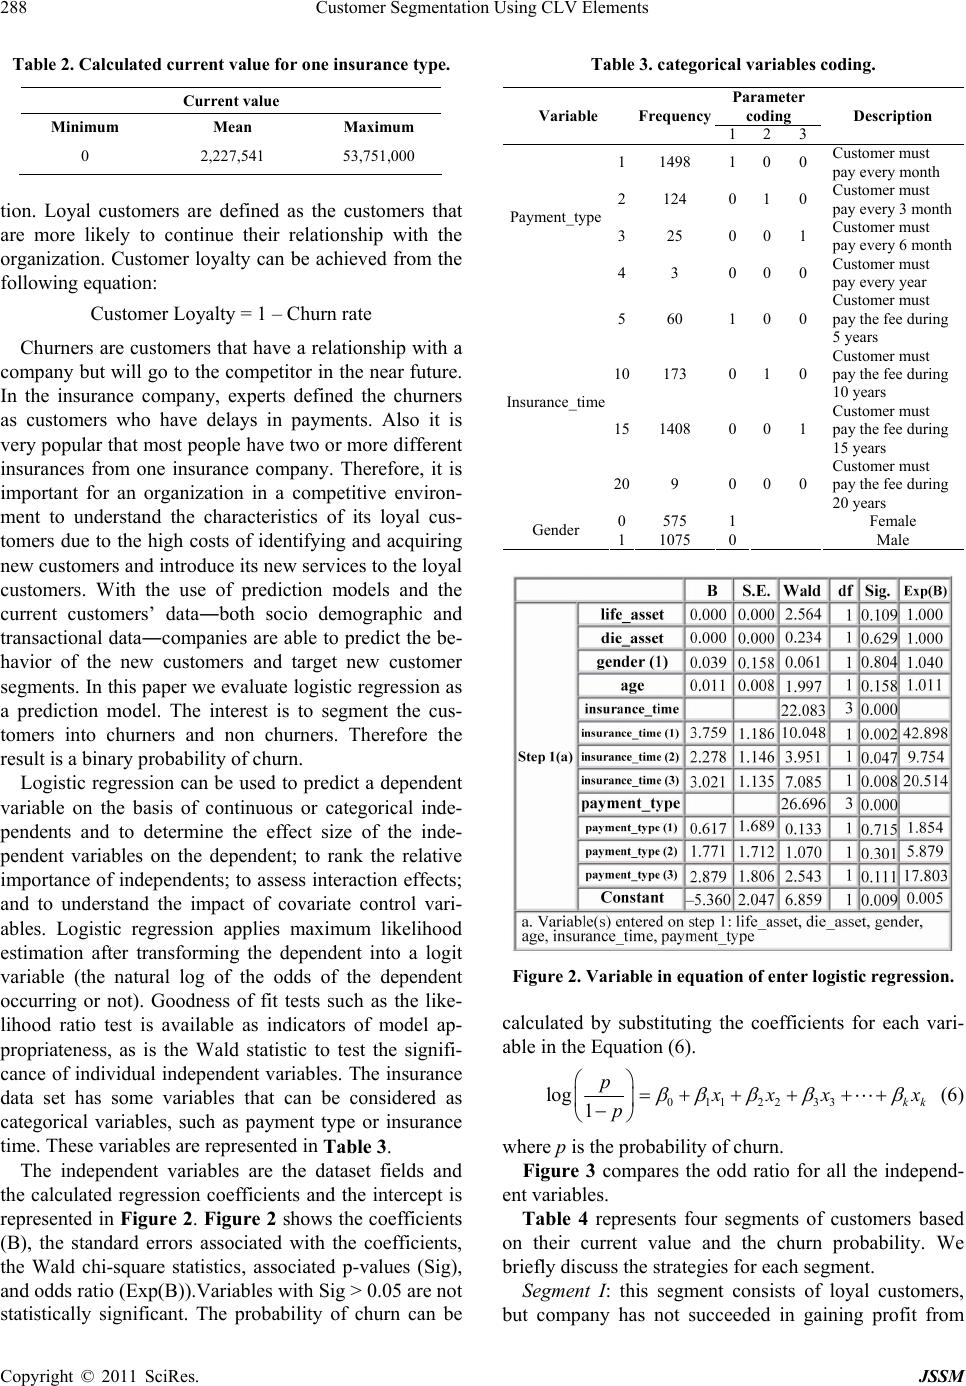 Customer Segmentation Using CLV Elements 288 Table 2. Calculated current value for one insurance type. Current value Minimum Mean Maximum 0 2,227,541 53,751,000 tion. Loyal customers are defined as the customers that are more likely to continue their relationship with the organization. Customer loyalty can be achieved from the following equation: Customer Loyalty = 1 – Churn rate Churners are customers that have a relationship with a company but will go to the competitor in the near future. In the insurance company, experts defined the churners as customers who have delays in payments. Also it is very popular that most people have two or more different insurances from one insurance company. Therefore, it is important for an organization in a competitive environ- ment to understand the characteristics of its loyal cus- tomers due to the high costs of identifying and acquiring new customers and introduce its new services to the loyal customers. With the use of prediction models and the current customers’ data―both socio demographic and transactional data―companies are able to predict the be- havior of the new customers and target new customer segments. In this paper we evaluate logistic regression as a prediction model. The interest is to segment the cus- tomers into churners and non churners. Therefore the result is a binary probability of churn. Logistic regression can be used to predict a dependent variable on the basis of continuous or categorical inde- pendents and to determine the effect size of the inde- pendent variables on the dependent; to rank the relative importance of independents; to assess interaction effects; and to understand the impact of covariate control vari- ables. Logistic regression applies maximum likelihood estimation after transforming the dependent into a logit variable (the natural log of the odds of the dependent occurring or not). Goodness of fit tests such as the like- lihood ratio test is available as indicators of model ap- propriateness, as is the Wald statistic to test the signifi- cance of individual independent variables. The insurance data set has some variables that can be considered as categorical variables, such as payment type or insurance time. These variables are represented in Table 3. The independent variables are the dataset fields and the calculated regression coefficients and the intercept is represented in Figure 2. Figure 2 shows the coefficients (B), the standard errors associated with the coefficients, the Wald chi-square statistics, associated p-values (Sig), and odds ratio (Exp(B)).Variables with Sig > 0.05 are not statistically significant. The probability of churn can be Table 3. categorical variables coding. Parameter coding Variable Frequency 1 2 3 Description 11498 1 0 0 Customer must pay every month 2124 0 1 0 Customer must pay every 3 month 325 0 0 1 Customer must pay every 6 month Payment_type 43 0 0 0 Customer must pay every year 560 1 0 0 Customer must pay the fee during 5 years 10173 0 1 0 Customer must pay the fee during 10 years 151408 0 0 1 Customer must pay the fee during 15 years Insurance_time 209 0 0 0 Customer must pay the fee during 20 years 0575 1 Female Gender 11075 0 Male Figure 2. Variable in equation of enter logistic regression. calculated by substituting the coefficients for each vari- able in the Equation (6). 0112233 log 1kk p x xx px (6) where p is the probability of churn. Figure 3 compares the odd ratio for all the independ- ent variables. Table 4 represents four segments of customers based on their current value and the churn probability. We briefly discuss the strategies for each segment. Segment I: this segment consists of loyal customers, but company has not succeeded in gaining profit from Copyright © 2011 SciRes. JSSM 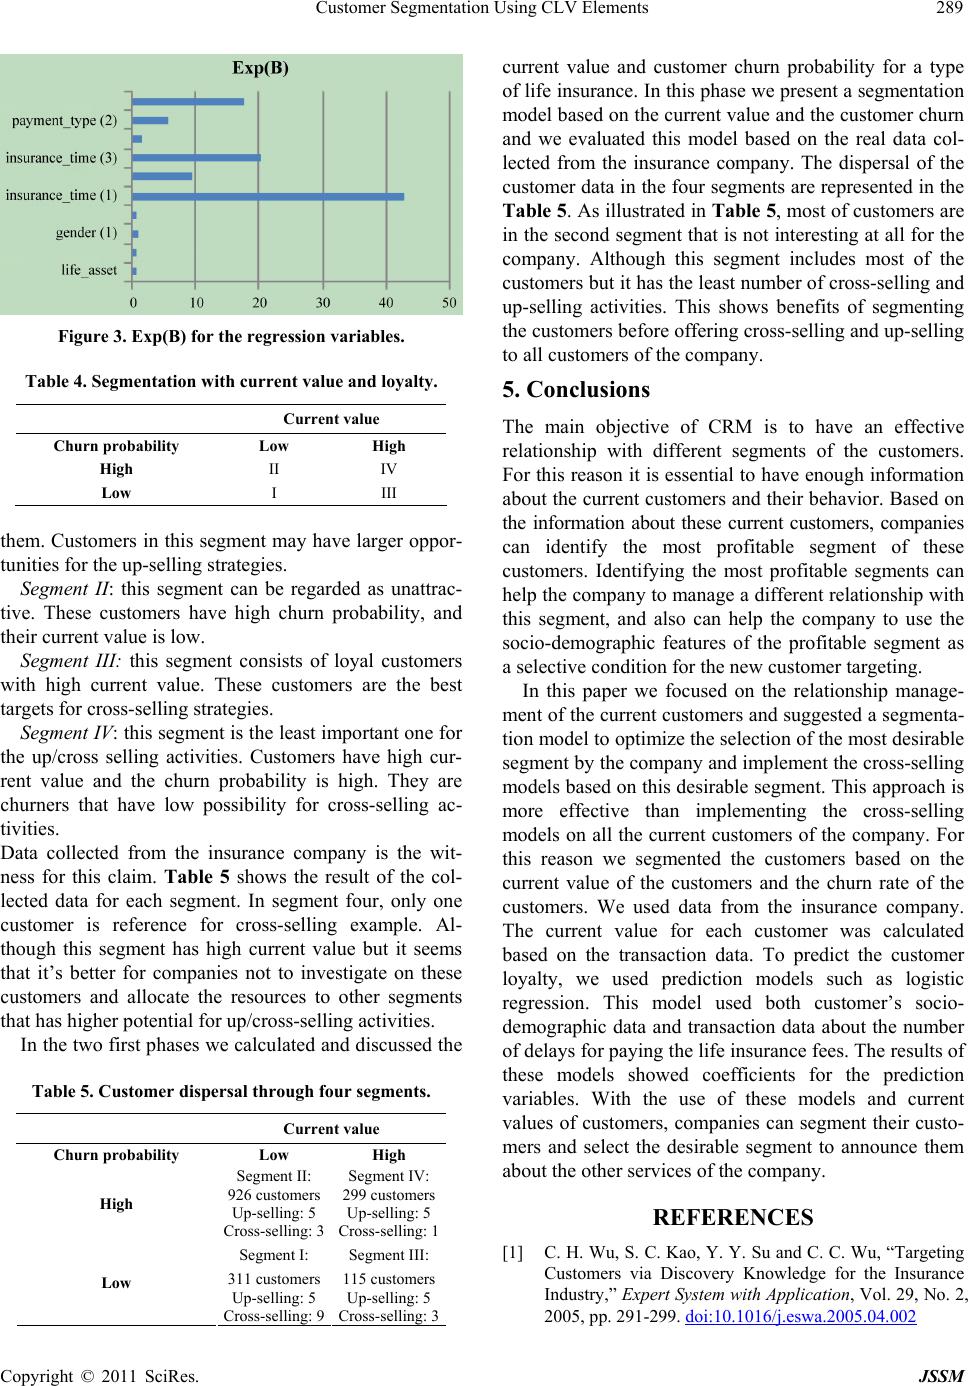 Customer Segmentation Using CLV Elements289 Figure 3. Exp(B) for the regres sion variables. Table 4. Segmentation with current value and loyalty. Current value Churn probability Low High High II IV Low I III them. Customers in this segment may have larger oppor- tunities for the up-selling strategies. Segment II: this segment can be regarded as unattrac- tive. These customers have high churn probability, and their current value is low. Segment III: this segment consists of loyal customers with high current value. These customers are the best targets for cross-selling strategies. Segment IV: this segment is the least important one for the up/cross selling activities. Customers have high cur- rent value and the churn probability is high. They are churners that have low possibility for cross-selling ac- tivities. Data collected from the insurance company is the wit- ness for this claim. Table 5 shows the result of the col- lected data for each segment. In segment four, only one customer is reference for cross-selling example. Al- though this segment has high current value but it seems that it’s better for companies not to investigate on these customers and allocate the resources to other segments that has higher potential for up/cross-selling activities. In the two first phases we calculated and discussed the Table 5. Customer dispersal through four segments. Current value Churn probability Low High Segment II: Segment IV: 926 customers 299 customers Up-selling: 5 Up-selling: 5 High Cross-selling: 3 Cross-selling: 1 Segment I: Segment III: 311 customers 115 customers Up-selling: 5 Up-selling: 5 Low Cross-selling: 9 Cross-selling: 3 current value and customer churn probability for a type of life insurance. In this phase we present a segmentation model based on the current value and the customer churn and we evaluated this model based on the real data col- lected from the insurance company. The dispersal of the customer data in the four segments are represented in the Table 5. As illustrated in Table 5, most of customers are in the second segment that is not interesting at all for the company. Although this segment includes most of the customers but it has the least number of cross-selling and up-selling activities. This shows benefits of segmenting the customers before offering cross-selling and up-selling to all customers of the company. 5. Conclusions The main objective of CRM is to have an effective relationship with different segments of the customers. For this reason it is essential to have enough information about the current customers and their behavior. Based on the information about these current customers, companies can identify the most profitable segment of these customers. Identifying the most profitable segments can help the company to manage a different relationship with this segment, and also can help the company to use the socio-demographic features of the profitable segment as a selective condition for the new customer targeting. In this paper we focused on the relationship manage- ment of the current customers and suggested a segmenta- tion model to optimize the selection of the most desirable segment by the company and implement the cross-selling models based on this desirable segment. This approach is more effective than implementing the cross-selling models on all the current customers of the company. For this reason we segmented the customers based on the current value of the customers and the churn rate of the customers. We used data from the insurance company. The current value for each customer was calculated based on the transaction data. To predict the customer loyalty, we used prediction models such as logistic regression. This model used both customer’s socio- demographic data and transaction data about the number of delays for paying the life insurance fees. The results of these models showed coefficients for the prediction variables. With the use of these models and current values of customers, companies can segment their custo- mers and select the desirable segment to announce them about the other services of the company. REFERENCES [1] C. H. Wu, S. C. Kao, Y. Y. Su and C. C. Wu, “Targeting Customers via Discovery Knowledge for the Insurance Industry,” Expert System with Application, Vol. 29, No. 2, 2005, pp. 291-299. doi:10.1016/j.eswa.2005.04.002 Copyright © 2011 SciRes. JSSM 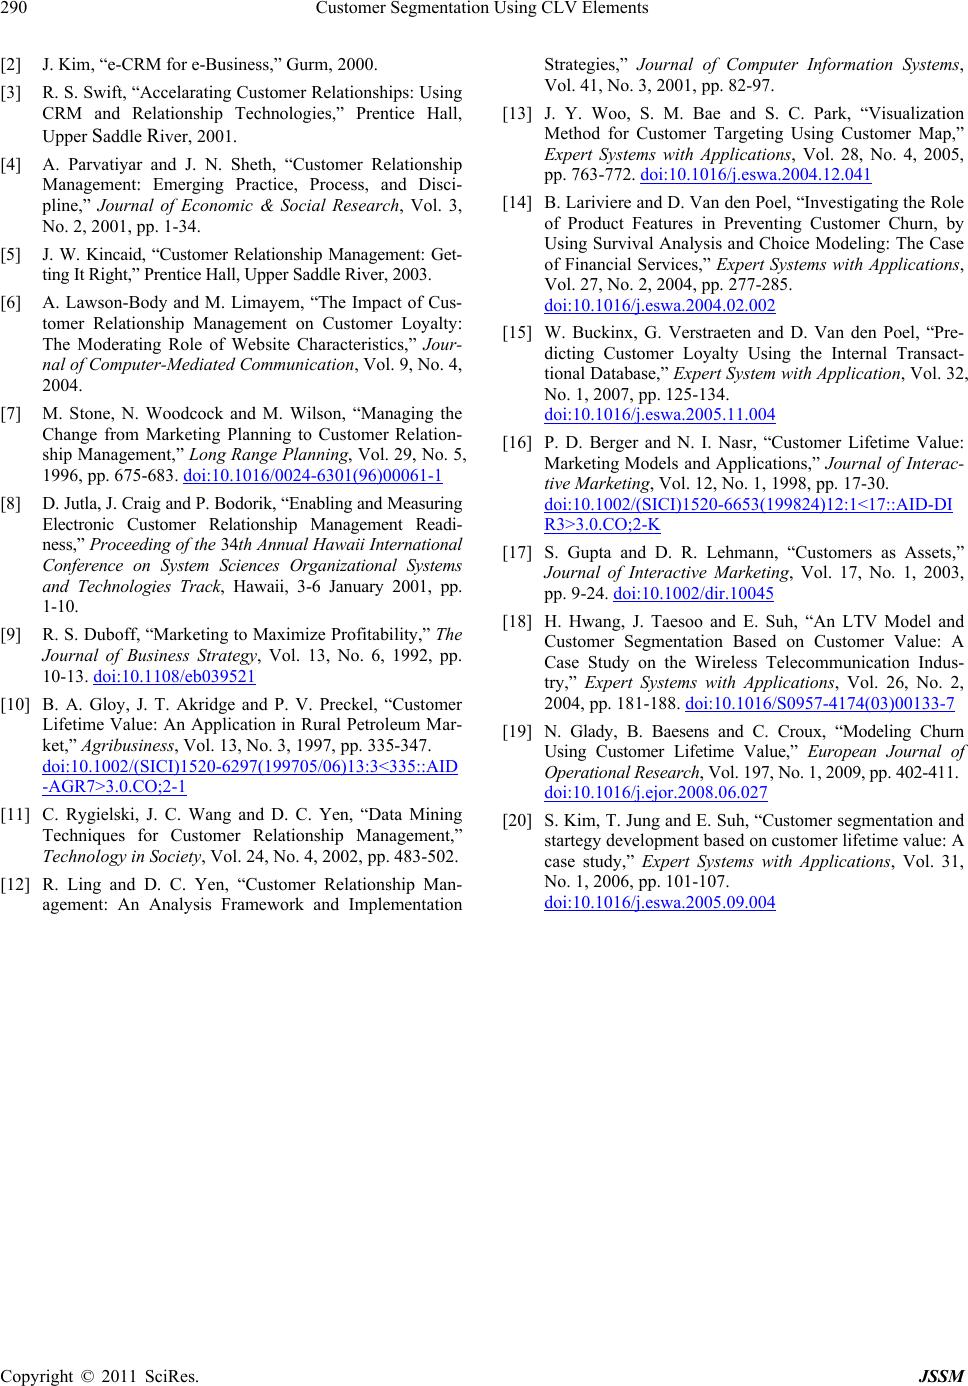 Customer Segmentation Using CLV Elements Copyright © 2011 SciRes. JSSM 290 [2] J. Kim, “e-CRM for e-Business,” Gurm, 2000. [3] R. S. Swift, “Accelarating Customer Relationships: Using CRM and Relationship Technologies,” Prentice Hall, Upper Saddle River, 2001. [4] A. Parvatiyar and J. N. Sheth, “Customer Relationship Management: Emerging Practice, Process, and Disci- pline,” Journal of Economic & Social Research, Vol. 3, No. 2, 2001, pp. 1-34. [5] J. W. Kincaid, “Customer Relationship Management: Get- ting It Right,” Prentice Hall, Upper Saddle River, 2003. [6] A. Lawson-Body and M. Limayem, “The Impact of Cus- tomer Relationship Management on Customer Loyalty: The Moderating Role of Website Characteristics,” Jour- nal of Computer-Mediated Communication, Vol. 9, No. 4, 2004. [7] M. Stone, N. Woodcock and M. Wilson, “Managing the Change from Marketing Planning to Customer Relation- ship Management,” Long Range Planning, Vol. 29, No. 5, 1996, pp. 675-683. doi:10.1016/0024-6301(96)00061-1 [8] D. Jutla, J. Craig and P. Bodorik, “Enabling and Measuring Electronic Customer Relationship Management Readi- ness,” Proceeding of the 34th An nual Hawaii Inte rnational Conference on System Sciences Organizational Systems and Technologies Track, Hawaii, 3-6 January 2001, pp. 1-10. [9] R. S. Duboff, “Marketing to Maximize Profitability,” The Journal of Business Strategy, Vol. 13, No. 6, 1992, pp. 10-13. doi:10.1108/eb039521 [10] B. A. Gloy, J. T. Akridge and P. V. Preckel, “Customer Lifetime Value: An Application in Rural Petroleum Mar- ket,” Agribusiness, Vol. 13, No. 3, 1997, pp. 335-347. doi:10.1002/(SICI)1520-6297(199705/06)13:3<335::AID -AGR7>3.0.CO;2-1 [11] C. Rygielski, J. C. Wang and D. C. Yen, “Data Mining Techniques for Customer Relationship Management,” Technology in Society, Vol. 24, No. 4, 2002, pp. 483-502. [12] R. Ling and D. C. Yen, “Customer Relationship Man- agement: An Analysis Framework and Implementation Strategies,” Journal of Computer Information Systems, Vol. 41, No. 3, 2001, pp. 82-97. [13] J. Y. Woo, S. M. Bae and S. C. Park, “Visualization Method for Customer Targeting Using Customer Map,” Expert Systems with Applications, Vol. 28, No. 4, 2005, pp. 763-772. doi:10.1016/j.eswa.2004.12.041 [14] B. Lariviere and D. Van den Poel, “Investigating the Role of Product Features in Preventing Customer Churn, by Using Survival Analysis and Choice Modeling: The Case of Financial Services,” Expert Systems with Applications, Vol. 27, No. 2, 2004, pp. 277-285. doi:10.1016/j.eswa.2004.02.002 [15] W. Buckinx, G. Verstraeten and D. Van den Poel, “Pre- dicting Customer Loyalty Using the Internal Transact- tional Database,” Expert System with Application, Vol. 32, No. 1, 2007, pp. 125-134. doi:10.1016/j.eswa.2005.11.004 [16] P. D. Berger and N. I. Nasr, “Customer Lifetime Value: Marketing Models and Applications,” Journal of Interac- tive Marketing, Vol. 12, No. 1, 1998, pp. 17-30. doi:10.1002/(SICI)1520-6653(199824)12:1<17::AID-DI R3>3.0.CO;2-K [17] S. Gupta and D. R. Lehmann, “Customers as Assets,” Journal of Interactive Marketing, Vol. 17, No. 1, 2003, pp. 9-24. doi:10.1002/dir.10045 [18] H. Hwang, J. Taesoo and E. Suh, “An LTV Model and Customer Segmentation Based on Customer Value: A Case Study on the Wireless Telecommunication Indus- try,” Expert Systems with Applications, Vol. 26, No. 2, 2004, pp. 181-188. doi:10.1016/S0957-4174(03)00133-7 [19] N. Glady, B. Baesens and C. Croux, “Modeling Churn Using Customer Lifetime Value,” European Journal of Operational Research, Vol. 197, No. 1, 2009, pp. 402-411. doi:10.1016/j.ejor.2008.06.027 [20] S. Kim, T. Jung and E. Suh, “Customer segmentation and startegy development based on customer lifetime value: A case study,” Expert Systems with Applications, Vol. 31, No. 1, 2006, pp. 101-107. doi:10.1016/j.eswa.2005.09.004 |