

Paper Menu >>
Journal Menu >>
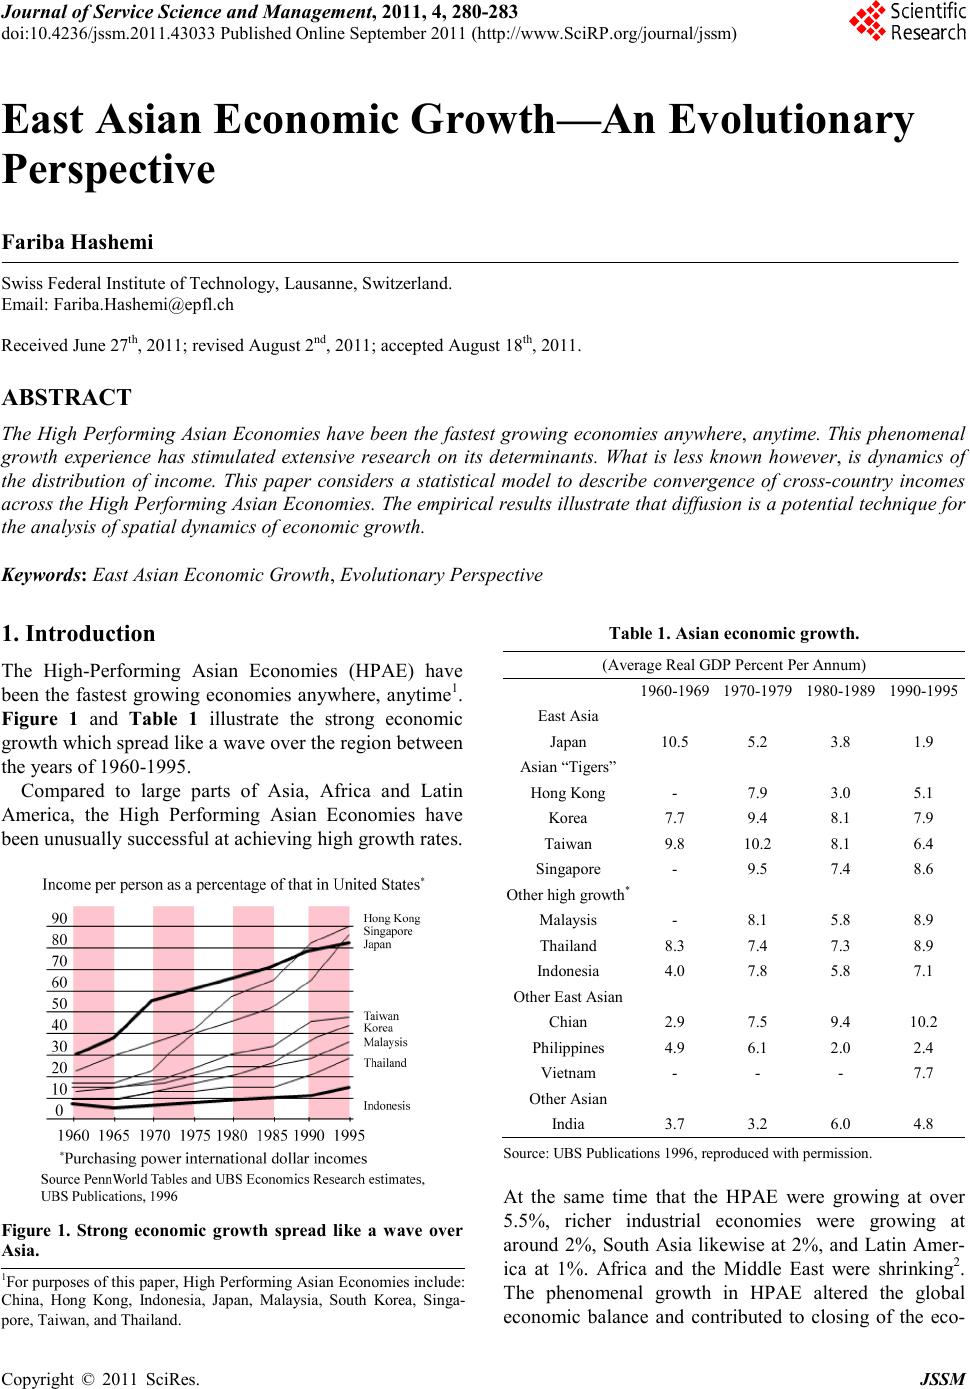 Journal of Service Science and Management, 2011, 4, 280-283 doi:10.4236/jssm.2011.43033 Published Online September 2011 (http://www.SciRP.org/journal/jssm) Copyright © 2011 SciRes. JSSM East Asia n Econ omic Growt h—An Evolutionary Perspecti ve Fariba Hashemi Swiss Federal Institute of Technology, Lausanne, Switzerland. Email: [email protected] Received June 27th, 2011; revised August 2nd, 2011; accepted August 18th, 2011. ABSTRACT The High Performing Asian Economies have been the fastest growing economies anywhe re, anytime. This phenomenal growth experience has stimulated extensive research on its determinants. What is less known however, is dynamics of the distribution of income. This paper considers a statistical model to describe convergence of cross-country incomes acro ss the High Performing Asian Economies. The empirical results illustrate th at diffusio n is a p otential te chnique for the analysis of spatial dynamics of economic growth. Keywords: East Asian Economic Growth, Evolutionary Perspective 1. Introduction The High-Performing Asian Economies (HPAE) have been the fastest growing economies anywhere, anytime1. Figure 1 and Table 1 illustrate the strong economic growth which spread like a wave over the region between the years of 1960-1995. Compared to large parts of Asia, Africa and Latin America, the High Performing Asian Economies have bee n unu suall y s uc ce ss f ul a t a c hie vi n g high gr owth ra tes. Figure 1. Str o ng economic growth spread like a wave over Asia. Table 1. A sia n economic growth. (Avera ge Real GDP P erc ent P er Annum) 1960-1969 1970-1979 1980-1989 1990-1995 East Asia Japan 10.5 5.2 3.8 1.9 Asian “Tigers” Hong Kong - 7.9 3.0 5.1 Korea 7.7 9.4 8.1 7.9 Taiwan 9.8 10.2 8.1 6 .4 Singapore - 9.5 7.4 8.6 Other high growth* Malaysis - 8.1 5.8 8.9 Thailand 8.3 7.4 7 .3 8.9 Indonesia 4.0 7.8 5.8 7.1 Other East Asian Chian 2.9 7.5 9.4 10.2 Philippines 4.9 6.1 2.0 2.4 Vietnam - - - 7.7 Other Asian India 3.7 3.2 6 .0 4.8 Source: UBS Publi cations 1996, reproduced with permission . At the same time that the HPAE were growing at over 5.5%, richer industrial economies were growing at around 2%, South Asia likewise at 2%, and Latin Amer- ica at 1%. Africa and the Middle East were shrinking2. The phenomenal growth in HPAE altered the global economic balance and contributed to closing of the eco- 1For purposes of this paper, High Performing Asian Econo mies in c lud e: China, Hong Kong, Indonesia, Japan, Malaysia, South Korea, Singa- pore, Taiwan, and Thailand. 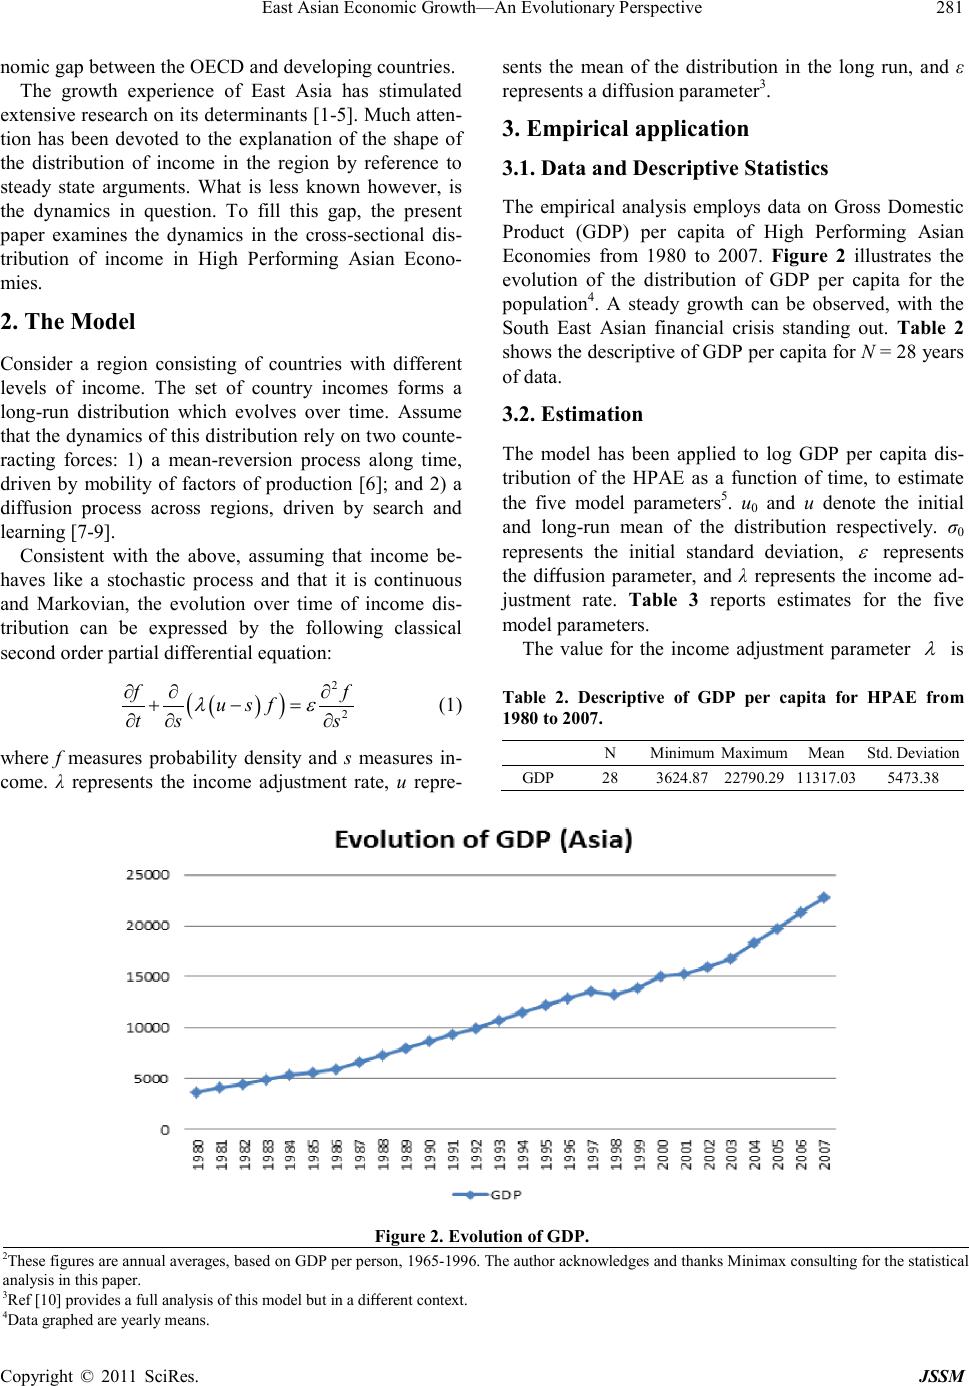 East Asian Economic Growth—An Evolutionary Perspective Copyright © 2011 SciRes. JSSM 281 nomic gap between the OECD and developing countries. The growth experience of East Asia has stimulated extensive research on its determinants [1-5]. Much a tten- tion has been devoted to the explanation of the shape of the distribution of income in the region by reference to steady state arguments. What is less known however, is the dynamics in question. To fill this gap, the present paper examines the dynamics in the cross-sectional dis- tribution of income in High Performing Asian Econo- mies. 2. The Model Consider a region consisting of countries with different levels of income. The set of country incomes forms a long-run distribution which evolves over time. Assume that t he d ynamics o f thi s dist rib ution re ly on t wo co unte- racting forces: 1) a mean-reversion process along time, driven by mobility of factors of production [6]; and 2) a diffusion process across regions, driven by search and learning [7-9]. Consistent with the above, assuming that income be- haves like a stochastic process and that it is continuous and Markovian, the evolution over time of income dis- tribution can be expressed by the following classical second order partial differential equation: ( ) ( ) 2 2 ff u sf ts s λε ∂∂ ∂ + −= ∂∂ ∂ (1) where f measures probability density and s measures in- come. λ represents the income adjustment rate, u repre- sents the mean of the distribution in the long run, and ε represents a diffusion parameter3. 3. Empirical application 3.1. Data and Descriptive Statistics The empirical analysis employs data on Gross Domestic Product (GDP) per capita of High Performing Asian Economies from 1980 to 2007. Figure 2 illustrates the evolution of the distribution of GDP per capita for the population4. A steady growth can be observed, with the South East Asian financial crisis standing out. Table 2 shows the descriptive of GDP per capita for N = 28 years of data. 3.2. Estimation The model has been applied to log GDP per capita dis- tribution of the HPAE as a function of time, to estimate the five model parameters5. u0 and u denote the initial and long-run mean of the distribution respectively. σ0 represents the initial standard deviation, ε represents the diffusion parameter, and λ represents the income ad- justment rate. Table 3 reports estimates for the five model parameters. The value for the income adjustment parameter λ is Table 2. Descriptive of GDP per capita for HPAE from 1980 to 200 7. N Minimum Maximum Mea n Std . Deviation GDP 28 3624.87 22790.29 11317. 03 5473.38 Figure 2. Evolution of GDP. 2These fi g u res a re a n n u a l a vera ges , based on GDP per person, 1965-1996. The author acknowledges and thanks Minimax consulting for the statistical analysis in this paper. 3Ref [10] provi des a full analysis of this mod el but in a different cont ext. 4Data graphed a re yearly mea ns. 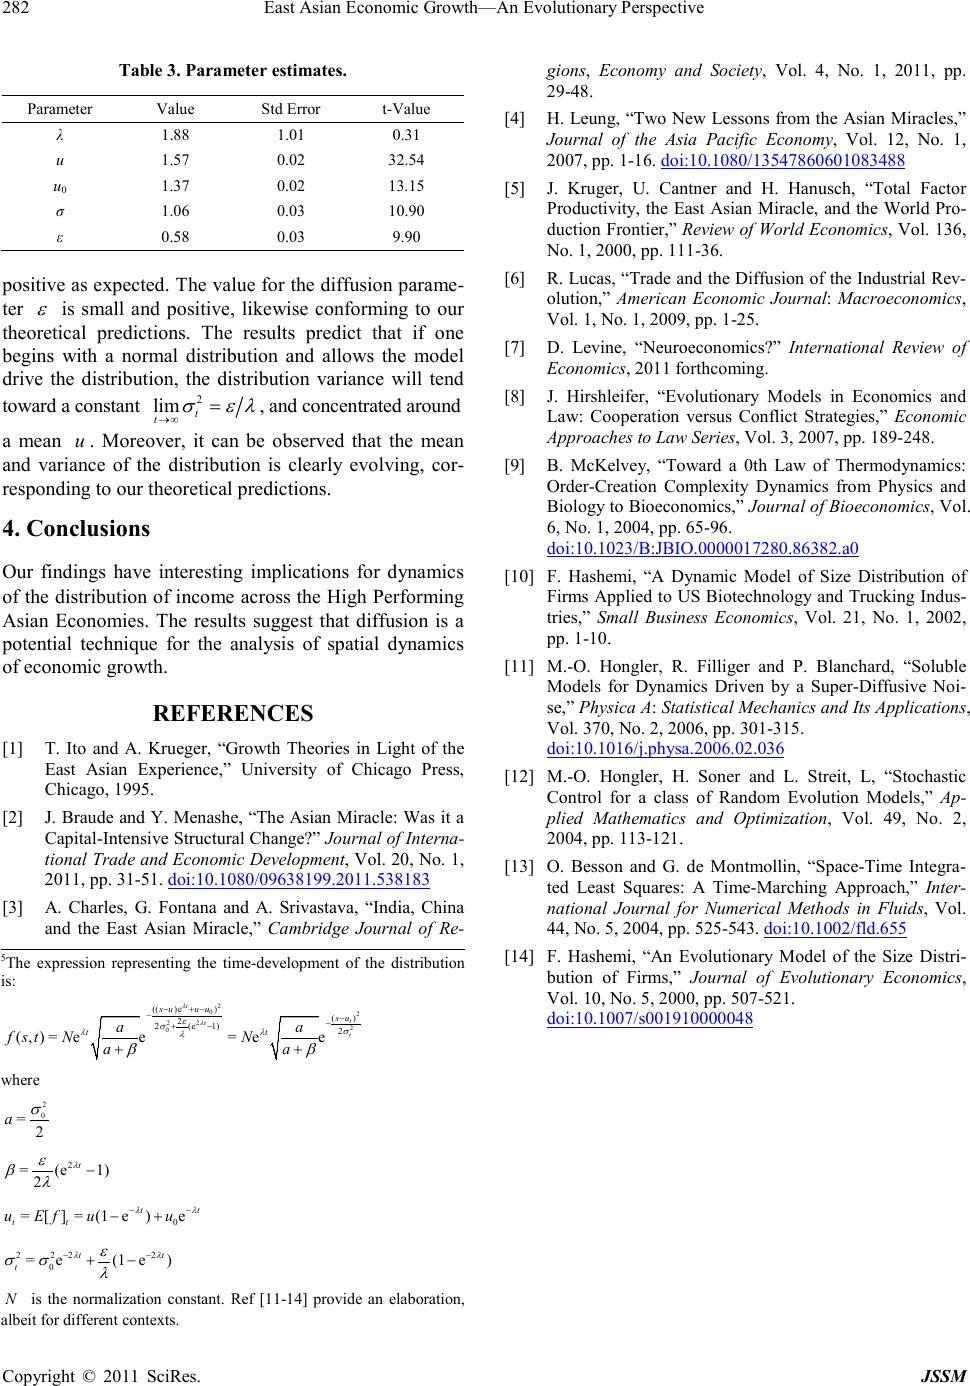 East Asian Economic Growth—An Evolutionary Perspective Copyright © 2011 SciRes. JSSM 282 Table 3. P arameter estimates. Paramet er Valu e Std Error t-Value λ 1.88 1.01 0.31 u 1.57 0.02 32.54 u0 1.37 0.02 13.15 σ 1.06 0.03 10.90 ε 0.58 0.03 9.90 positive as expected. The va lue for the dif fusio n par ame- ter ε is small and positive, likewise conforming to our theoretical predictions. The results predict that if one begins with a normal distribution and allows the model drive the distribution, the distribution variance will tend toward a c ons tant 2 lim t t σ ελ →∞ = , and concentrated around a mean u . Moreover, it can be observed that the mean and variance of the distribution is clearly evolving, cor- responding to our theoretical predictions. 4. Conclusions Our findings have interesting implications for dynamics of the distribution of income across the High Performing Asian Economies. The results suggest that diffusion is a potential technique for the analysis of spatial dynamics of ec onomic growth. REFERENCES [1] T. Ito and A. Krueger, “Growth Theories in Light of the East Asian Experience,” University of Chicago Press, Chi c a go, 1995. [2] J. Braude and Y. Menashe, “The Asian Miracle: Was it a Capital-Inten sive Struct ural Change?” Journal of Interna- tional Trade and Economic Development, Vol. 20, No. 1 , 2011, pp . 31-51. doi:10.1080/09638199.2011.538183 [3] A. Charles, G. Fontana and A. Srivastava, “India, China and the East Asian Miracle,” Cambridge Journal of Re- gions, Economy and Society, Vol. 4, No. 1, 2011, pp. 29-48. [4] H. Leung, “Two New Lessons from the Asian Miracles,” Journal of the Asia Pacific Economy, Vol. 12, No. 1, 2007, pp . 1-16. doi:10.1080/13547860601083488 [5] J. Kruger, U. Cantner an d H. Hanusch, “Total Factor Productivity, the East Asian Miracle, and the World Pro- duction Frontier,” Review of World Econo mics, Vol. 136, No. 1, 2000, pp. 111-36. [6] R. Lu cas, “Trade and t he Diffusion of the Industrial Rev- olution,” American Economic Journal: Macroeconomics, Vol. 1, No. 1, 2009, pp. 1-25. [7] D. Levine, “Neuroeconomics?” International Review of Economics, 2011 f ort hc oming . [8] J. Hirshleifer, “Evolutionary Models in Economics and La w: Cooperation versus Conflict Strategies,” Economic Approaches to Law Series, Vol. 3, 2007, pp. 189-248. [9] B. McKelvey, “Toward a 0th Law of Thermodynamics: Order-Creation Complexity Dynamics from Physics and Biology to Bioeconomics,” Journal of Bioeconomics, Vol . 6, No. 1, 2004, pp. 65-96. doi:10.1023/B:JBIO.0000017280.86382.a0 [10] F. Hashemi, “A Dynamic Model of Size Distribution of Firms Applied to US Biotechnology and Trucking Indus- tries,” Small Business Economics, Vol. 21, No. 1, 2002, pp. 1-10. [11] M.-O. Hongler, R. Filliger and P. Blanchard, “Soluble Models for Dynamics Driven by a Super-Diffusive Noi- se,” Ph ysica A: Statistical Mechanics and Its App lications, Vol. 370, No. 2, 2006, pp. 301-315. doi:10.1016/j.physa.2006.02.036 [12] M.-O. Hongler, H. Soner and L. Streit, L, “Stochastic Control for a class of Random Evolution Models,” Ap- plied Mathematics and Optimization, Vol. 49, No. 2, 2004, pp . 113-121. [13] O. Besson and G. de Montmollin, “Space-Time Integra- ted Least Squares: A Time-Mar ching Approach,” Inter- national Journal for Numerical Methods in Fluids, Vol. 44, No. 5, 2004, pp. 525-543. doi:10.1002/fld.655 [14] F. Hashemi, “An Evolutionary Model of the Size Distri- bution of Firms,” Journal of Evolutionary Economics, Vol. 10, No. 5, 2000, pp. 507-521. doi:10.1007/s001910000048 5The expression representing the time- development of the distribution is: 2 02 22 2 0 (( )e)() 2 2(e 1)2 (,)=e e=e e t t t t su uusu tt aa f stNN aa λ λ ε σσ λλ λ ββ − +− −− − +− ++ where 2 0 =2 a σ 2 = (e1) 2 t λ ε βλ − 0 =[] =(1e)e tt tt u Efuu λλ −− −+ 2 222 0 =e(1 e) tt t λλ ε σσ λ −− +− N is the normalization constant. Ref [11- 14] provide an elaboration, albeit for different contexts. |