

Paper Menu >>
Journal Menu >>
 Low Carbon Economy, 2011, 2, 152-158 doi:10.4236/lce.2011.23019 Published Online September 2011 (http://www.SciRP.org/journal/lce) Copyright © 2011 SciRes. LCE Transportation’s Impact Assessment on Construction Sector Nuki Agya Utama1*, Keiichi N. Ishihara1, Tetsuo Tezuka1, Qi Zhang1, Miguel Esteban2 1Graduate School Energy Science, Kyoto University, Kyoto, Japan; 2Graduate School Civil and Environmental, Waseda University, Tokyo, Japan . Email: *[email protected] Received June 24th, 2011; revised July 28th, 2011; accepted August 8th, 2011. ABSTRACT Pollution sources in Indon esia have been classified into those from movable and unmovable so urces. Transportation of goods and peop le throu gh water, air and land are the movable sources of pollution, these sources of pollution originate mainly from gasoline and diesel combustion. This pap er will discuss the movable pollutio n, which will be referred to as the embedded emissions from the transportation sector in buildings. The embedded emissions refer to the emissions, which occur ind irectly throughout a building ’s lifetime (for instance, during manufacturing, transportation etc). This is in contrast to the emissions normally considered for buildings, which usually only include those originating from its usage during a certain life span. By using life cycle analysis tools the value of the impacts of the transportation sector on building s can be q uantifie d. GEMIS 4.4 was used to simulate the emissions during the process of transporting mate- rials as well as any other goods related to the construction of the building. The research however did not include the transportation of materials after the demolition of the building to the landfill. The results show that the transportation emissions from glass, sand, gypsum and concrete roof production have the highest emissions per kilogram of product. Concrete roofs emit 1.82 × 10⁻⁴ kg CO2/kg, transporting raw material and glass products to customers emits 1.05 × 10⁻³ kg NOx/kg, and transporting wood material 1.33 × 10⁻⁵ kg of particulates/kg. Furthermore, the future emissions caused by this sector are also analysed in the present paper by compa ring four potential scenarios regarding different types of future fuels that could be used by vehicles, including a (JCL) Jatropha Curcas L. based biodiesel scenario that uses a perennial harvesting system, a (PME) Palm Methyl Ester based biodiesel both scenarios, Natural Gas Vehicles (NGV) that could replace the current petroleum diesel engines and the business as usual (BaU) scenario. Keywords: Transportation, Construction, Environmental Impacts, Materials 1. Introduction Globally the construction industry is a major contributor to socio-economic development and also a major user of energy and natural resources. The construction industry consumes 40% of the materials entering the global e- conomy and generates 40% - 50% of the global output of greenhouse gases and the agents of acid rain [1]. The energy used by the building sector can be grouped into two categories. First, the embodied energy, or indi- rect energy used to 1) Extract raw materials; 2) The pro- duction of materials or components; 3) Transportation; and 4) Construction. Second is the direct energy use dur- ing the utilization of th e buildin g. In the UK, for example, the embodied energy accounts for approximately 5% - 6% of the total, compared with 50% used for heating and the remaining 44% for cooling, water heating, lighting, power and other appliances. Different research has men- tioned that energy uses during utilization can be seven times greater than during the construction and the mate- rial production ph ase [2-4]. Studies carried out in the UK [5] and Indonesia [6,7] have calculated the embodied energy and CO2 emissions for the main materials used in the buildings (including transportation). For example, UK timber emits 0.1 kg CO2/kg of product and utilizes 5.2 MJ/kg of product, corresponding to 0.05 kg CO2/kg and 0.8 MJ/kg of energy for the case of Indonesia. Glass and aluminium in the UK emits less CO2 and utilizes more energy than in Indonesia, and for the case of con- crete the UK emits more CO2 and utilizes more than half more energy compared to that produced in Indonesia. These studies also concluded that the lower the embodied and operational energy used in the bu ilding, the lower th e carbon dioxide (CO2) that is produced.  Transportation’s Impact Assessment on Construction Sector153 Transportation itself is responsible for 27% of Indone- sia’s total emissions in 2006, making it the second larg est CO2 emitter, after industry, and is predicted to become the largest source by 2030 [8]. Five to ten percent of the overall country’s emissions relate directly or indirectly to transportation in the building sector (calculated from the GDP and construction sector in th e country) [9]. The Indonesian Ministry of the Environment predicts that by 2015 the amount of CO2 emitted will increase to up to 3.5 million tons/year compare to 957,000 tons in 1998. SO2 emissions by that date will also increase to up to 2.4 times their present rate (4900 tons/year) and PM10 will rise to more than 2.7 times the curren t level of 6300 tons/year [10]. These increases will result mainly from an increase in the consumption of gasoline and diesel fuel. The building related industry, and especially the trans- port of materials using diesel engines contributes most of the GWP (Global Warming Potential) of Indonesia, and is also responsible for the acidification of certain areas. On top of the substances mentioned above, the transpor- tation sector also emits other hazardous substances, such as lead, formaldehyde, acetaldehyde, chrome, and other hazardous air pollutants [10]. Biofuels, which are alternative fuels that can replace diesel, have been increasing in importance in recent times, and although they can have positive benefits, they can also negatively affect land use, contribute to defor- estation, and influence food production. The following figure shows the percentage increase in the price of sev- eral food stocks resulting from the development of the first generation of biofuels. The comparison shows dif- ferent scenarios developed by the International Institute for Applied Systems Analysis (IIASA) [11] using the future projection of agriculture production by the Inter- national Energy Agency (IEA) and also shows a refer- ence scenario, which assumes that biofuels feedstock demand is kept constant after 2008. The result shows that there is a real potential for biofuels to compete with food production. One of their scenarios (TAR-VI) for 2020 assumes that the second generation biofuels will be commercially available in 2015 and the deployment will be gradual, and that the mandatory, voluntary or in- dicative targets for biofuels use announced by major de- veloped and developing countries will be implemented by 2020 (as projected by IEA in its WEO 2008). This scenario results in a 50 percent increase in coarse grain price, 30 percent increase of wheat and other food (non rice, wheat, protein feed and grains) and 12 percent in- crease in the price of rice. Therefore it is important to analyze the real environmental and socio-economical impact of biofuels as well as the cost. Another alternative fuels have less environmental impact (in terms of green- house gas emissions) are natural gas. Worldwide the growth in the number of natural gas vehicles (NGV) has been remarkable, around 30% on average since 2000, with Asian nations being responsible for more than 53% of this growth [12]. For buildings, the transporting of construction materi- als from quarry to site or from factory to site are impor- tant parts of the construction process. Environmental analyses of the impact of transportation systems on the environment from the cradle to the grave are rare [13] especially when they are related to the construction sec- tor. One study which has been carried out for transporta- tion in the construc tion sector compares the use of diesel fuel and biodiesel in cement mixers using portable emis- sion measurement systems shows no significant change in CO2 and NO but a significant decrease in CO, hydro- carbon and PM emissions [14]. (Life Cycle Assessment based research for transportation and construction done by Huang in China [15] shows that the higher the engine capacity the lower the CO and NMVOC released into the environment. The present paper will assess the environmental bur- den from transportation as part of the construction proc- ess. It will include material flows from quarry to site, and also show some future prediction on how the use of al- ternative fuels such as biodiesels and natural gas vehicle (NGV) would impact the environmental burden of con- struction. The economic analysis will also include meas- uring the potential for replacing the current oil based machines with NGV by using a learning curve analysis. However this paper will only concern itself with trans- portation related to the build ing sector, leaving the rest of the transportation sector as a subject for futur e research. 2. Methodology The present research used Life Cycle Analysis tools to assess the potential impact on the environment of the transportation activities of the building sector in Indone- sia. The life cycle assessment method considers the proc- ess analysis and combination between primary and sec- ondary databases. There were two types of data used in the study. The primary data was obtained by direct meas- urement from selected factories or by questioning rele- vant individuals in each of the factories. The secondary database was mostly taken from GEMIS 4.4 (Global Emission Model for Integrated Systems) a comprehen- sive life cycle database, which covers processes for en- ergy (fossil, nuclear, renewable), materials (metals, min- erals, food, plastics, etc), and transport (person and freight), as well as recycling and waste treatment proc- esses [16]. Figure 1 shows the boundar ies of th e resear ch , which considers all asp ects of the transportation. The functional unit of hauling per kilogram product in ilometer distance basis has been used; the direct meas k Copyright © 2011 SciRes. LCE 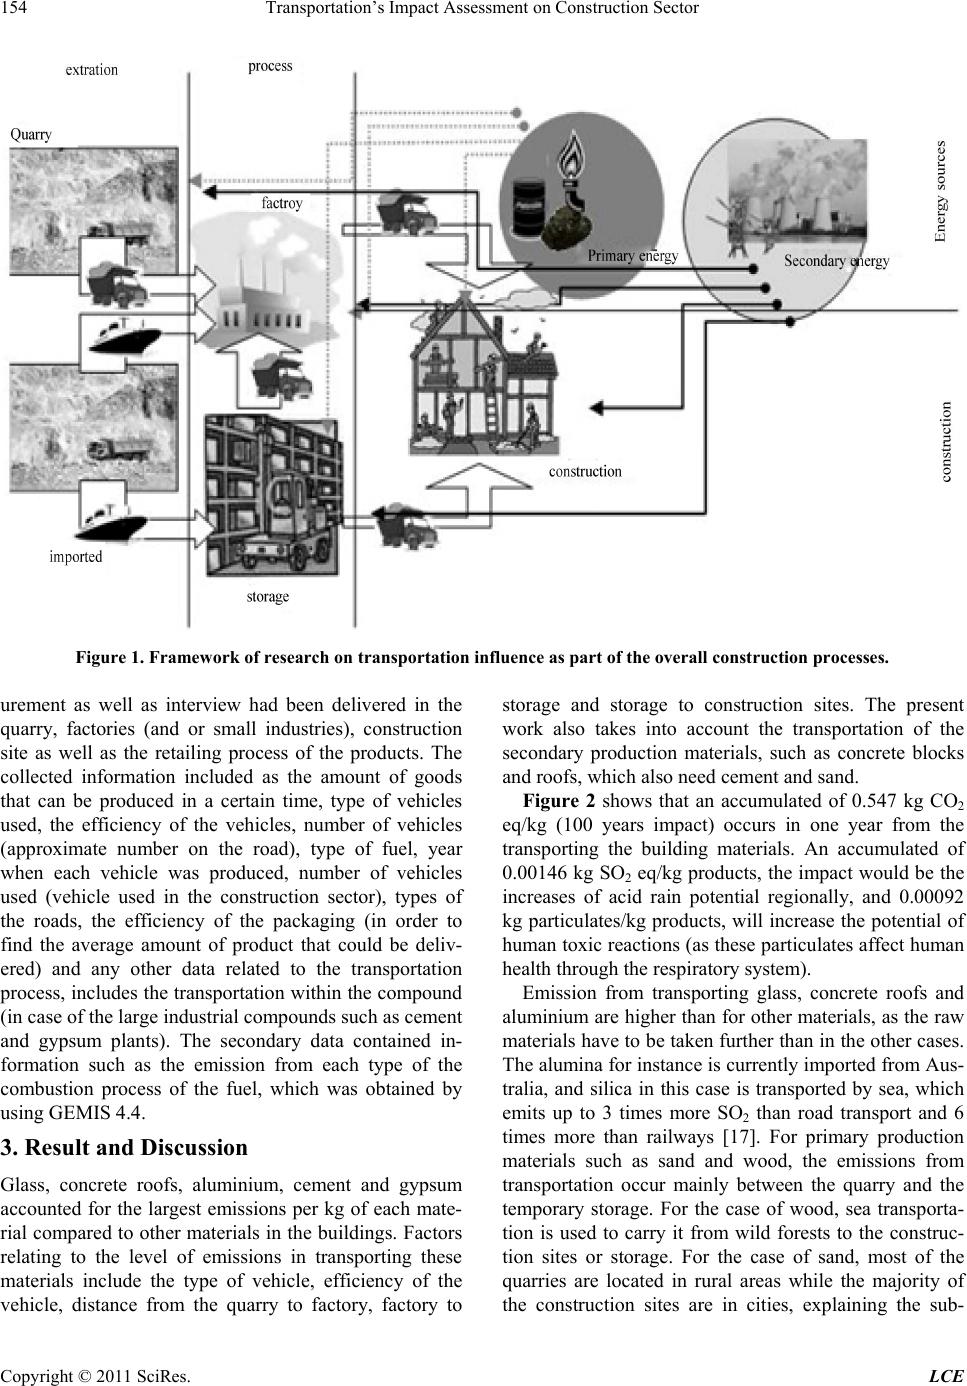 Transportation’s Impact Assessment on Construction Sector Copyright © 2011 SciRes. LCE 154 Figure 1. Framework of research on transportation influence as part of the overall construction processes. urement as well as interview had been delivered in the quarry, factories (and or small industries), construction site as well as the retailing process of the products. The collected information included as the amount of goods that can be produced in a certain time, type of vehicles used, the efficiency of the vehicles, number of vehicles (approximate number on the road), type of fuel, year when each vehicle was produced, number of vehicles used (vehicle used in the construction sector), types of the roads, the efficiency of the packaging (in order to find the average amount of product that could be deliv- ered) and any other data related to the transportation process, includes the transportation within the compound (in case of the large industrial compounds such as cement and gypsum plants). The secondary data contained in- formation such as the emission from each type of the combustion process of the fuel, which was obtained by using GEMIS 4.4. 3. Result and Discussion Glass, concrete roofs, aluminium, cement and gypsum accounted for the largest emissions per kg of each mate- rial compared to other materials in the buildings. Factors relating to the level of emissions in transporting these materials include the type of vehicle, efficiency of the vehicle, distance from the quarry to factory, factory to storage and storage to construction sites. The present work also takes into account the transportation of the secondary production materials, such as concrete blocks and roofs, which also need cement and sand. Figure 2 shows that an accumulated of 0.547 kg CO2 eq/kg (100 years impact) occurs in one year from the transporting the building materials. An accumulated of 0.00146 k g SO2 eq/kg products, the impact would be the increases of acid rain potential regionally, and 0.00092 kg particulates/kg products, will increase the potential of human toxic reactions (as these particulates affect human health through the respirator y syste m). Emission from transporting glass, concrete roofs and aluminium are higher than for other materials, as the raw materials have to be taken further than in the other cases. The alumina for instance is currently imported from Aus- tralia, and silica in this case is transported by sea, which emits up to 3 times more SO2 than road transport and 6 times more than railways [17]. For primary production materials such as sand and wood, the emissions from transportation occur mainly between the quarry and the temporary storage. For the case of wood, sea transporta- tion is used to carry it from wild forests to the construc- tion sites or storage. For the case of sand, most of the quarries are located in rural areas while the majority of he construction sites are in cities, explaining the sub- t 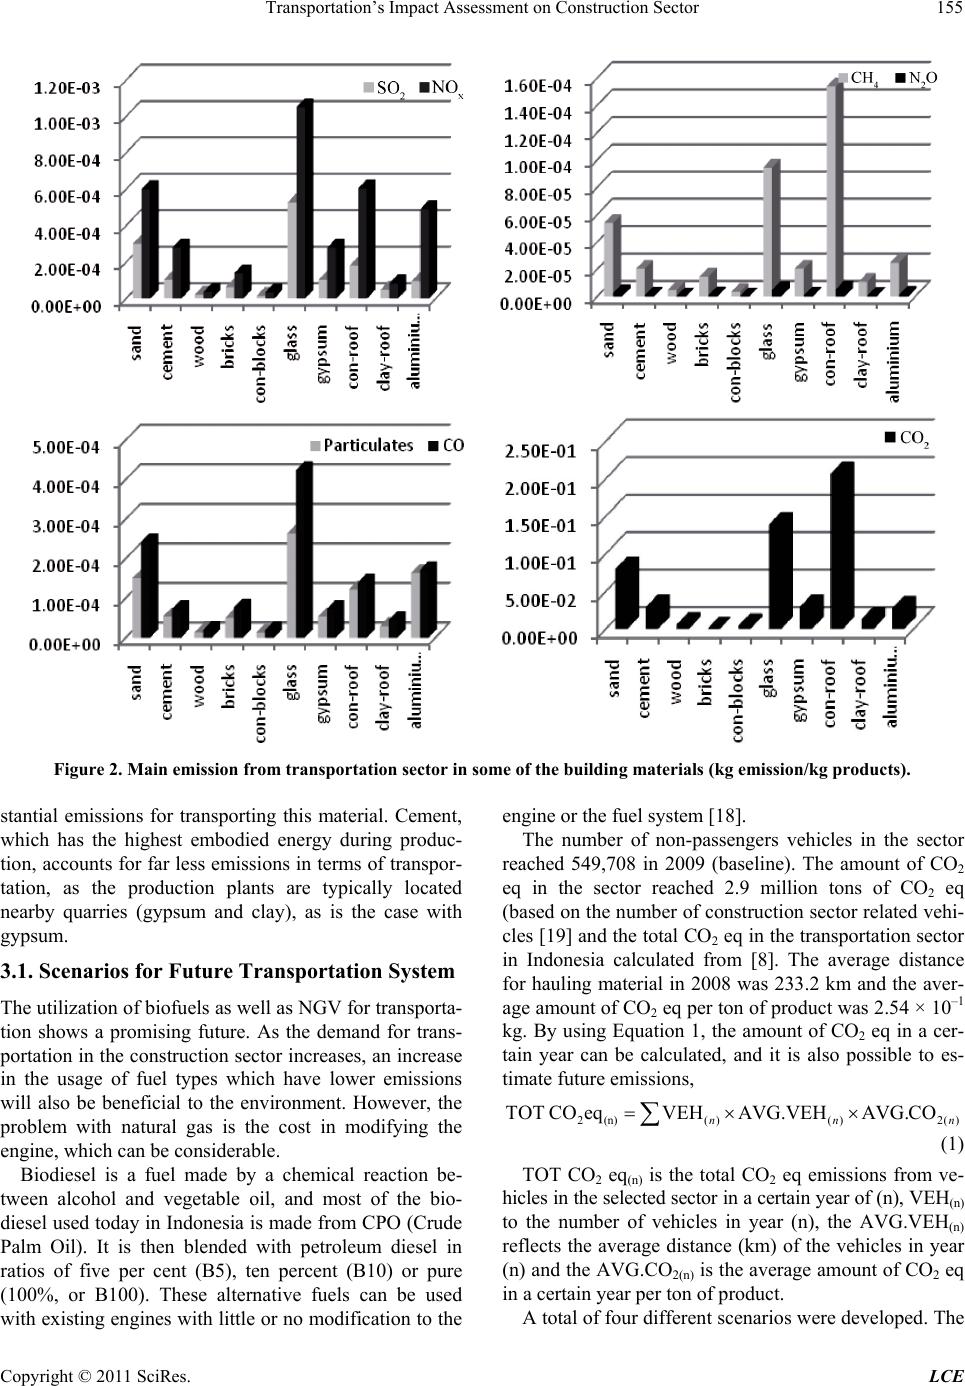 Transportation’s Impact Assessment on Construction Sector155 Figure 2. Main emission from transportation sector in some of the building materials (kg emission/kg products). stantial emissions for transporting this material. Cement, which has the highest embodied energy during produc- tion, accounts for far less emissions in terms of transpor- tation, as the production plants are typically located nearby quarries (gypsum and clay), as is the case with gypsum. 3.1. Scenarios for Future Transportation System The utilization of biofuels as well as NGV for transp orta- tion shows a promising future. As the demand for trans- portation in the construction sector increases, an increase in the usage of fuel types which have lower emissions will also be beneficial to the environment. However, the problem with natural gas is the cost in modifying the engine, which can be con si de rabl e . Biodiesel is a fuel made by a chemical reaction be- tween alcohol and vegetable oil, and most of the bio- diesel used today in Indonesia is made from CPO (Crude Palm Oil). It is then blended with petroleum diesel in ratios of five per cent (B5), ten percent (B10) or pure (100%, or B100). These alternative fuels can be used with existing eng ines with little or no modification to the engine or the fuel system [18]. The number of non-passengers vehicles in the sector reached 549,708 in 2009 (baseline). The amount of CO2 eq in the sector reached 2.9 million tons of CO2 eq (based on the number of construction sector related vehi- cles [19] and the total CO2 eq in the transportation sector in Indonesia calculated from [8]. The average distance for hauling material in 2008 was 233.2 km and the aver- age amount of CO2 eq per ton of product was 2.54 × 10⁻¹ kg. By using Equation 1, the amount of CO2 eq in a cer- tain year can be calculated, and it is also possible to es- timate future emissions, 2 (n)()()2() TOT COeqVEHAVG.VEHA VG.CO nn n (1) TOT CO2 eq(n) is the total CO2 eq emissions from ve- hicles in the selected sector in a certain year of (n), VEH(n) to the number of vehicles in year (n), the AVG.VEH(n) reflects the average distance (km) of the vehicles in year (n) and the AVG.CO2(n) is the average amount of CO2 eq in a certain year per ton of product. A total of four different scenarios were developed. The Copyright © 2011 SciRes. LCE 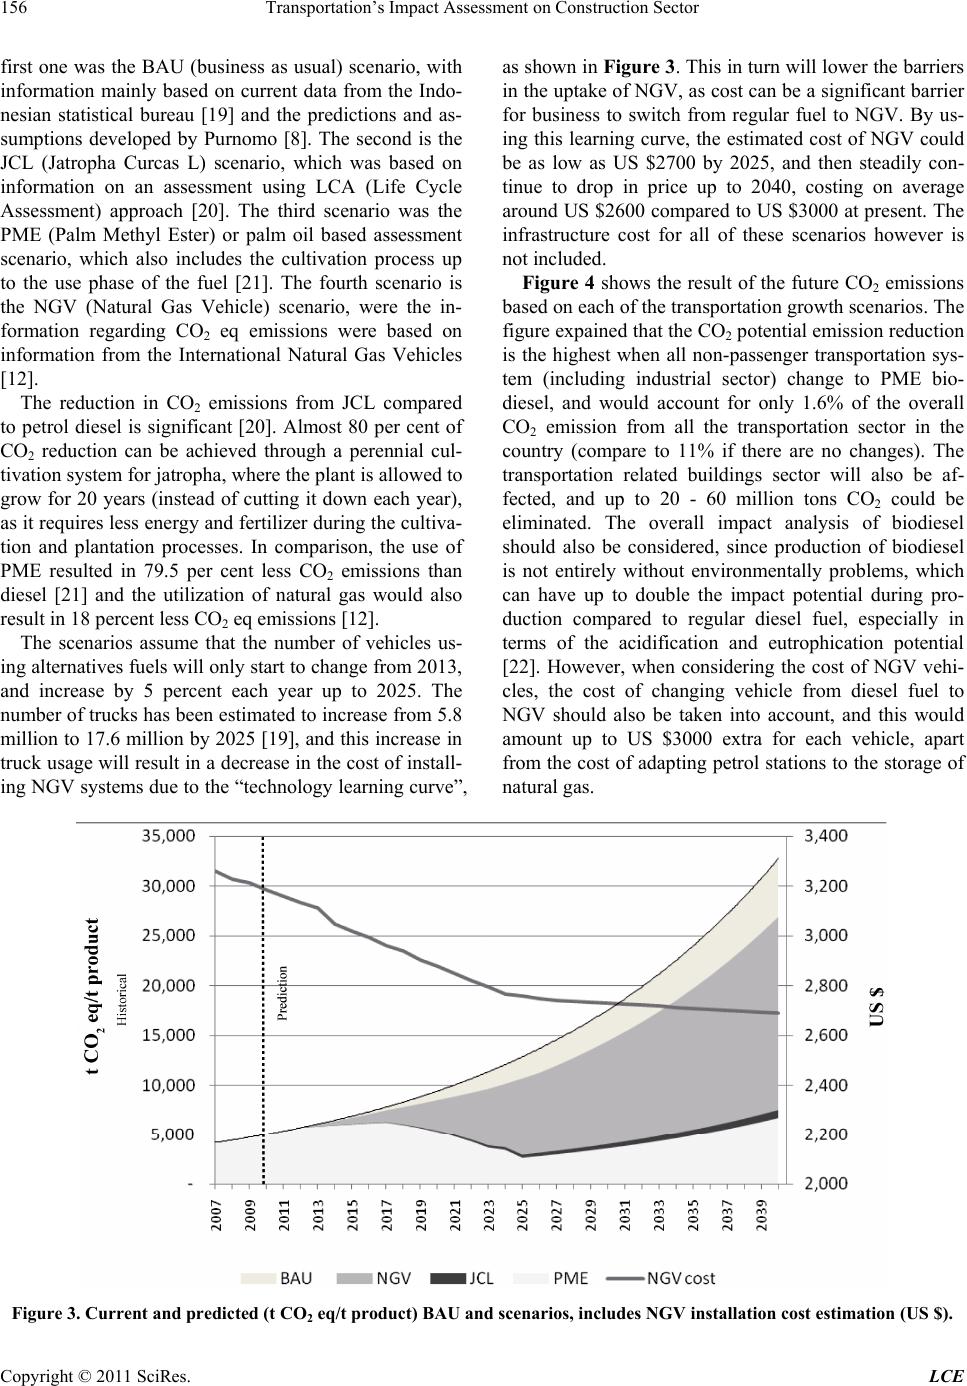 Transportation’s Impact Assessment on Construction Sector 156 first one was the BAU (business as usual) scenario, with information mainly based on current data from the Indo- nesian statistical bureau [19] and the predictions and as- sumptions developed by Purnomo [8]. The second is the JCL (Jatropha Curcas L) scenario, which was based on information on an assessment using LCA (Life Cycle Assessment) approach [20]. The third scenario was the PME (Palm Methyl Ester) or palm oil based assessment scenario, which also includes the cultivation process up to the use phase of the fuel [21]. The fourth scenario is the NGV (Natural Gas Vehicle) scenario, were the in- formation regarding CO2 eq emissions were based on information from the International Natural Gas Vehicles [12]. The reduction in CO2 emissions from JCL compared to petrol diesel is significant [20]. Almost 80 per cent of CO2 reduction can be achieved through a perennial cul- tivation system for jatropha, where the plant is allowed to grow for 20 years (instead of cutting it down each year), as it requires less energy and fertilizer during the cultiv a- tion and plantation processes. In comparison, the use of PME resulted in 79.5 per cent less CO2 emissions than diesel [21] and the utilization of natural gas would also result in 18 percent less CO2 eq emissions [12]. The scenarios assume that the number of vehicles us- ing alternatives fuels will only start to ch ange from 2013, and increase by 5 percent each year up to 2025. The number of trucks has been estimated to increase from 5.8 million to 17.6 million by 2025 [19], and this increase in truck usage will result in a d ecrease in the cost of install- ing NGV systems due to the “technology learning curve”, as shown in Figure 3. This in turn will lower the barriers in the uptake of NGV, as cost can be a significant barrier for business to switch from regular fuel to NGV. By us- ing this learning curve, the estimated cost of NGV could be as low as US $2700 by 2025, and then steadily con- tinue to drop in price up to 2040, costing on average around US $2600 compared to US $3000 at present. The infrastructure cost for all of these scenarios however is not included. Figure 4 shows the result of the future CO2 emissions based on each of the transportation growth scenarios. The figure expained th at the CO2 potential emission reduction is the highest when all non-passenger transportation sys- tem (including industrial sector) change to PME bio- diesel, and would account for only 1.6% of the overall CO2 emission from all the transportation sector in the country (compare to 11% if there are no changes). The transportation related buildings sector will also be af- fected, and up to 20 - 60 million tons CO2 could be eliminated. The overall impact analysis of biodiesel should also be considered, since production of biodiesel is not entirely without environmentally problems, which can have up to double the impact potential during pro- duction compared to regular diesel fuel, especially in terms of the acidification and eutrophication potential [22]. However, when considering the cost of NGV vehi- cles, the cost of changing vehicle from diesel fuel to NGV should also be taken into account, and this would amount up to US $3000 extra for each vehicle, apart from the cost of adapting petrol stations to the storage of natural gas. Figure 3. Current and predicted (t CO2 eq/t product) BAU and scenarios, includes NGV installation cost estimation (US $). Copyright © 2011 SciRes. LCE 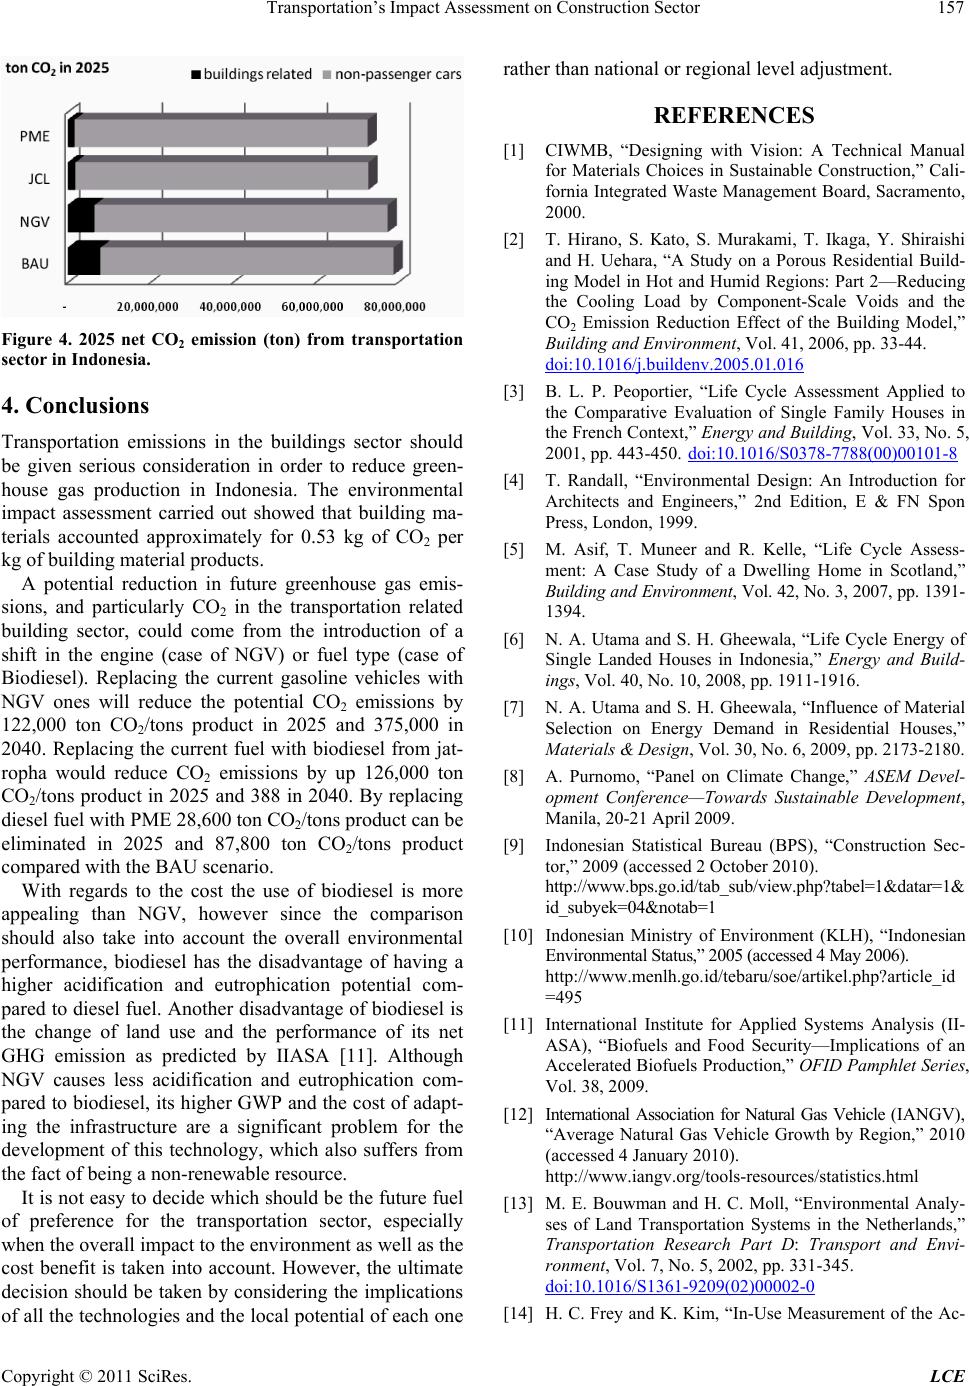 Transportation’s Impact Assessment on Construction Sector157 Figure 4. 2025 net CO2 emission (ton) from transportation sector in Indonesia. 4. Conclusions Transportation emissions in the buildings sector should be given serious consideration in order to reduce green- house gas production in Indonesia. The environmental impact assessment carried out showed that building ma- terials accounted approximately for 0.53 kg of CO2 per kg of building material products. A potential reduction in future greenhouse gas emis- sions, and particularly CO2 in the transportation related building sector, could come from the introduction of a shift in the engine (case of NGV) or fuel type (case of Biodiesel). Replacing the current gasoline vehicles with NGV ones will reduce the potential CO2 emissions by 122,000 ton CO2/tons product in 2025 and 375,000 in 2040. Replacing the current fuel with biodiesel from jat- ropha would reduce CO2 emissions by up 126,000 ton CO2/tons product in 2025 and 388 in 2040. By replacing diesel fuel with PME 28,600 ton CO2/tons product can be eliminated in 2025 and 87,800 ton CO2/tons product compared with the BAU scenario. With regards to the cost the use of biodiesel is more appealing than NGV, however since the comparison should also take into account the overall environmental performance, biodiesel has the disadvantage of having a higher acidification and eutrophication potential com- pared to diesel fuel. Another disadvantage of biodiesel is the change of land use and the performance of its net GHG emission as predicted by IIASA [11]. Although NGV causes less acidification and eutrophication com- pared to biodiesel, its higher GWP and the cost of adapt- ing the infrastructure are a significant problem for the development of this technology, which also suffers from the fact of being a non-renewable resource. It is not easy to decide which should be the future fuel of preference for the transportation sector, especially when the overall impact to th e enviro n ment as well as the cost benefit is taken into account. However, the ultimate decision should be taken by considering the implications of all the technologies and the lo cal potential of each one rather than nation al or regional level adjustment. REFERENCES [1] CIWMB, “Designing with Vision: A Technical Manual for Materials Choices in Sustainable Construction,” Cali- fornia Integrated Waste Management Board, Sacramento, 2000. [2] T. Hirano, S. Kato, S. Murakami, T. Ikaga, Y. Shiraishi and H. Uehara, “A Study on a Porous Residential Build- ing Model in Hot and Humid Regions: Part 2—Reducing the Cooling Load by Component-Scale Voids and the CO2 Emission Reduction Effect of the Building Model,” Building and Environment, Vol. 41, 2006, pp. 33-44. doi:10.1016/j.buildenv.2005.01.016 [3] B. L. P. Peoportier, “Life Cycle Assessment Applied to the Comparative Evaluation of Single Family Houses in the French Context,” Energy and Building, Vol. 33, No. 5, 2001, pp. 443-450. doi:10.1016/S0378-7788(00)00101-8 [4] T. Randall, “Environmental Design: An Introduction for Architects and Engineers,” 2nd Edition, E & FN Spon Press, London, 1999. [5] M. Asif, T. Muneer and R. Kelle, “Life Cycle Assess- ment: A Case Study of a Dwelling Home in Scotland,” Building and Environment, Vol. 42, No. 3, 2007, pp. 139 1- 1394. [6] N. A. Utama and S. H. Gheewala, “Life Cycle Energy of Single Landed Houses in Indonesia,” Energy and Build- ings, Vol. 40, No. 10, 2008, pp. 1911-1916. [7] N. A. Utama and S. H. Gheewala, “Influence of Material Selection on Energy Demand in Residential Houses,” Materials & Design, Vol. 30, No. 6, 2009, pp. 2173-2180. [8] A. Purnomo, “Panel on Climate Change,” ASEM Devel- opment Conference—Towards Sustainable Development, Manila, 20-21 April 2009. [9] Indonesian Statistical Bureau (BPS), “Construction Sec- tor,” 2009 (accessed 2 October 2010). http://www.bps.go.id/tab_sub/view.php? tabel=1&datar=1& id_subyek=04¬ab=1 [10] Indonesian Ministry of Environment (KLH), “Indonesian Environmental Status,” 2005 (accessed 4 May 2006). http://www.menlh.go.id/tebaru/soe/artikel.php?article_id =495 [11] International Institute for Applied Systems Analysis (II- ASA), “Biofuels and Food Security—Implications of an Accelerated Biofuels Production,” OFID Pamphlet Series, Vol. 38, 2009. [12] International Association for Natural Gas Vehicle (IANGV), “Average Natural Gas Vehicle Growth by Region,” 2010 (accessed 4 January 2010). http://www.iangv.org/tools-resources/statistics.html [13] M. E. Bouwman and H. C. Moll, “Environmental Analy- ses of Land Transportation Systems in the Netherlands,” Transportation Research Part D: Transport and Envi- ronment, Vol. 7, No. 5, 2002, pp. 331-345. doi:10.1016/S1361-9209(02)00002-0 [14] H. C. Frey and K. Kim, “In-Use Measurement of the Ac- Copyright © 2011 SciRes. LCE 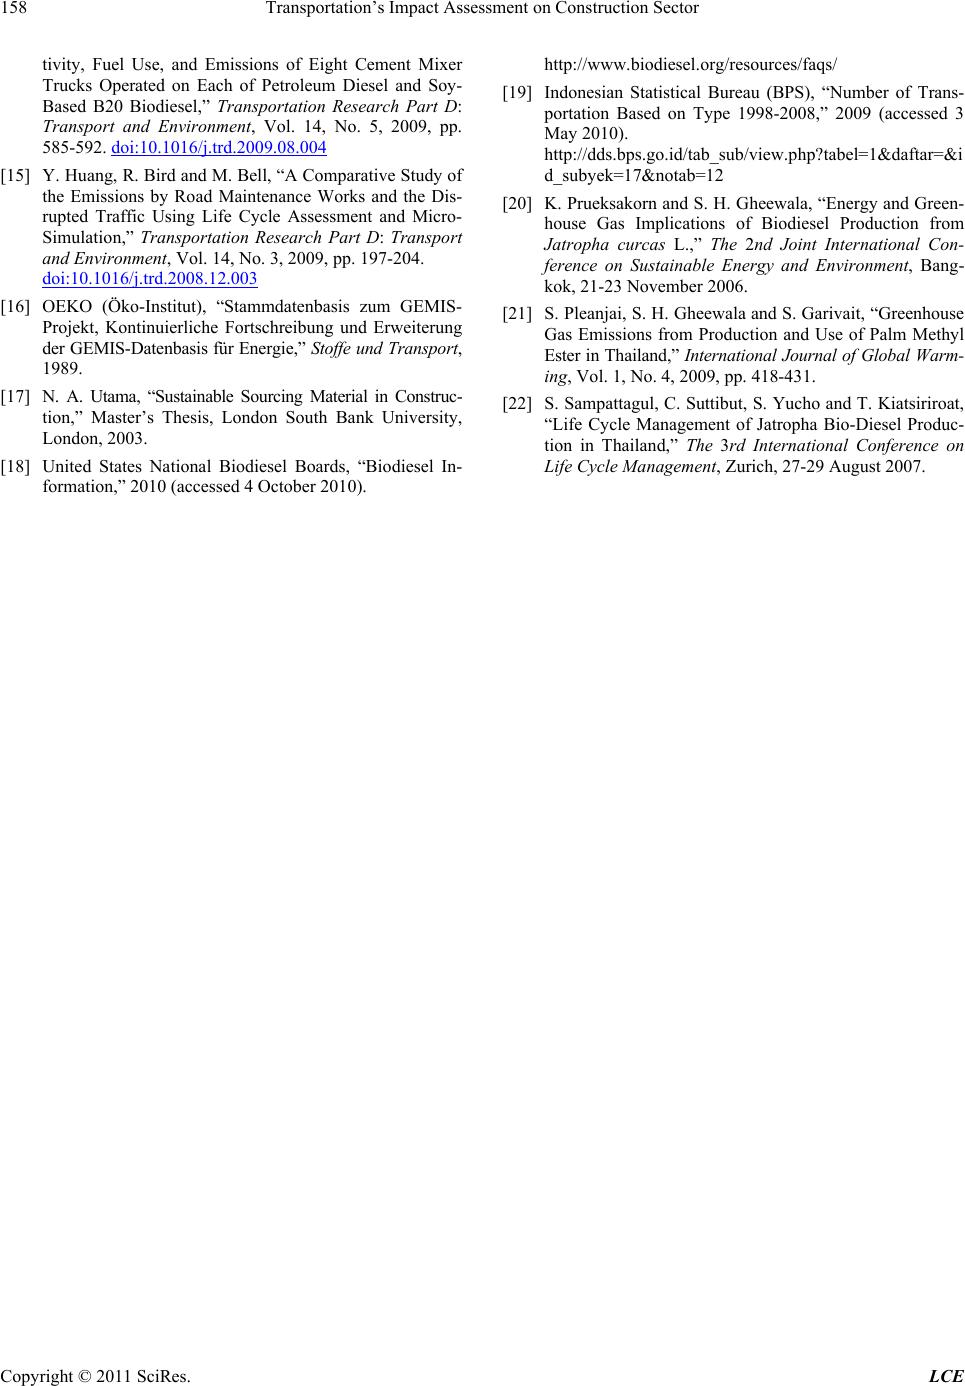 Transportation’s Impact Assessment on Construction Sector 158 tivity, Fuel Use, and Emissions of Eight Cement Mixer Trucks Operated on Each of Petroleum Diesel and Soy- Based B20 Biodiesel,” Transportation Research Part D: Transport and Environment, Vol. 14, No. 5, 2009, pp. 585-592. doi:10.1016/j.trd.2009.08.004 [15] Y. Huang, R. Bird and M. Bell, “A Comparative Study of the Emissions by Road Maintenance Works and the Dis- rupted Traffic Using Life Cycle Assessment and Micro- Simulation,” Transportation Research Part D: Transport and Environment, Vol. 14, No. 3, 2009, pp. 197-204. doi:10.1016/j.trd.2008.12.003 [16] OEKO (Öko-Institut), “Stammdatenbasis zum GEMIS- Projekt, Kontinuierliche Fortschreibung und Erweiterung der GEMIS-Datenbasis für Energi e,” Stoffe und Transport, 1989. [17] N. A. Utama, “Sustainable Sourcing Material in Construc- tion,” Master’s Thesis, London South Bank University, London, 2003. [18] United States National Biodiesel Boards, “Biodiesel In- formation,” 2010 (accessed 4 October 2010). http://www.biodiesel.org/resources/faqs/ [19] Indonesian Statistical Bureau (BPS), “Number of Trans- portation Based on Type 1998-2008,” 2009 (accessed 3 May 2010). http://dds.bps.go.id/tab_sub/view.php?tabel=1&daftar=&i d_subyek=17¬ab=12 [20] K. Prueksakorn and S. H. Gheewala, “Energy and Green- house Gas Implications of Biodiesel Production from Jatropha curcas L.,” The 2nd Joint International Con- ference on Sustainable Energy and Environment, Bang- kok, 21-23 November 2006. [21] S. Pleanjai, S. H. Gheewala and S. Garivait, “Greenhouse Gas Emissions from Production and Use of Palm Methyl Ester in Thailand,” International Journal of Global Warm- ing, Vol. 1, No. 4, 2009, pp. 418-431. [22] S. Sampattagul, C. Suttibut, S. Yucho and T. Kiatsiriroat, “Life Cycle Management of Jatropha Bio-Diesel Produc- tion in Thailand,” The 3rd International Conference on Life Cycle Management, Zurich, 27-29 August 2007. Copyright © 2011 SciRes. LCE |