

Paper Menu >>
Journal Menu >>
 Journal of Environmental Protection, 2011, 2, 1002-1007 doi:10.4236/jep.2011.27115 Published Online September2011 (http://www.SciRP.org/journal/jep) Copyright © 2011 SciRes. JEP Assessment of Natural Uranium in the Ground Water around Jaduguda Uranium Mining Complex, India N. K. Sethy1*, R. M. Tripathi2, V. N. Jha1, S. K. Sahoo2, A. K. Shukla2, V. D. Puranik2 1Environmental Assessment Division, Bhabha Atomic Research Centre, Health Physics Unit, Jaduguda Mines, Jharkhand, India; 2Bhabha Atomic Research Centre, Mumbai, India. Email: *[email protected] Received May 16th, 2011; revised July 15th, 2011; accepted August 27th, 2011. ABSTRACT Ground water ecosystem surrounding the uranium processing facility at Jaduguda, India has been studied for natural uranium distribution. Annual intake of uranium through drinking water for members of public residing around the ura- nium complex is found to be in the range of 41.8 Bq·y–1 - 44.4 Bq·y–1. The intake and ingestion dose is appreciably low (<2 Sv·y–1) which is far below the WHO recommended level of 100 Sv·y–1. The excess life time radiological risk due to uranium natural in drinking water is insignificant and found to be of the order of 10–6. Even the highest concentra- tion of uranium was found to be 28 g·l–1 is away (at 1.5 to 5 km distance) from mining industry and well below the acceptable limit. The ground water in the area around the uranium facility is not affected by the mining activity. The ground water in three zones is safe and reflects the natural distribution of uranium. Keywords: Natural Uranium, Ingestion Dose, Radiological Risk 1. Introduction 1.1 General Description Rapid industrialization and subsequent waste disposal has been a concern for ground water contamination. Ground water is the major source of drinking water in many parts India. Industrial activities, metal mining and waste depositary may contribute to the nearby ground water sources by radionuclide migration. Mining and processing of uranium in the east-Singbhum region of Jharkhand has been started in early sixties. Uranium ore is mined from a cluster of mines (Jaduguda, Bhatin and Narwapahar, Turamundih, Bagjata, Mauldih) spreading in the region and processed at centralized ore-processing plant at Jaduguda using hydrometallurgy technique. As the ore is of very low grade (<0.05% U3O8), a huge quantity of process waste (tailings) is generated and dis- posed safely in tailings ponds. Tailings pond is an engi- neered having valley with natural hills on three sides and earthen bund forming the fourth side. Engineering fea- tures of the earthen bund ensures the decantation of dis- solved radionuclides, which are treated further for re- moval of the toxins (U, 226Ra and heavy metals) prior to their discharge into the aquatic ecosystem. The change in physicochemical characteristics of tailings over the pe- riod may take place leading to dissolution of some of the contaminants. The migration of these contaminants into the adjoining ground water sources can be anticipated. Evaluation of ingestion dose and subsequent risk due to intake of water to population residing around the tailings pond is the subject matter of this study. The mining complex comprises of uranium mines, ore processing plant and tailings ponds. The study area is situated at Jaduguda (22˚30'N and long. 85˚40'E) in the East Singbhum district of Jharkhand, India. The area is well known for its wide mineral deposits and receives >1000 mm of rain fall annually. The maximum temperature in summer is >45˚C and minimum is <7˚C during winter. 1.2. Health Hazard of Uranium Toxicity of uranium has been established by animal studies and human data from uranium miners and work- ers with accidental exposures indicate that uranium af- fects the proximal tubules of the kidney; at very high acute doses, tubular degeneration and necrosis (that is, death of tissue) may occur a few days after the intake of  Assessment of Natural Uranium in the Ground water around Jaduguda Uranium Mining Complex, India1003 uranium [1]. Kidney is generally considered to be the critical organ for uranium through water or food. The uranyl ion forms bicarbonate, citrate and UO3(CO2)3 complexes in blood plasma [2]. The UO2++ ion binds with the red blood cells. During the purification of blood in kidney, it is filtered from the blood and then recom- bines with the cell surface ligands. Studies on uranium toxicity studies in human have been described elsewhere [3,4]. Though, intake of uranium by members of the pub- lic can occur through various routes. However the prin- cipal route of ingestion of uranium is through drinking water [5] and to a lesser extent through the foodstuff. Intake of uranium through drinking water by population residing around the uranium mining area has been con- sidered in the present study. United States Environmental Protection Agency (EPA) has classified uranium as a group- A human carcinogen. It has prescribed maximum contaminant level goal (MCLG) for uranium as 0 (zero) in 1991(zero tolerance). In drinking water, EPA suggests maximum contaminant level as (MCL) of 30 g·l–1 [6]. In Canada, the proposed interim maximum acceptable level is (IMAC) of 20 g·l–1, whereas World Health Or- ganization (WHO) strictly recommended a reference level as 2 g·l–1 [7]. 2. Materials and Methods 2.1. Sampling and Analysis Grab samples (5 lit) were collected from open wells and tube wells situated at various distances in the public do- main. The area around the uranium mining Industry is divided into three zones i.e. <1.5 km, 1.5 to 5 km and >5 km. Ground water samples were collected from these three zones. Sample locations were selected covering three measure season of the area (October to March, April to June and August to September) on the basis of public utility and down stream direction from uranium industry. More number of samples was collected from downstream side of the Uranium Industry. Samples were brought to the laboratory filtered and preserved in acidic medium. About 100 ml of water sample is evaporated to dryness and 20 ml of 0.25 N electronic grade pure H2SO4 is added and reflux for 30 minutes in a hot plate. It is then cooled and transferred to a separating funnel/tube. Then 20 ml of alamine-benzene (2% alamine in 98% benzene) solution is added and the mixture is shaken for few minutes with occasionally opening the mouth of the separating tube to vent off the gases formed inside. The aqueous phase is drained out and 0.1 ml from organic phase is taken for planchatting in a platinum disc. The basic principle of estimation of natural uranium in envi- ronmental sample is to quantitatively transfer the trace amount of uranium present in the sample aliquot to a small platinum disc and measure the intensity of flores- cence of uranium compound. A small volume (0.1 ml) of organic media containing the uranium is transferred to platinum disc, fused with 250 mg of NaF-Na2CO3 (15:85) fusion mixture at 800˚C for 3 minutes. Cooled and fluo- rescence intensity was measured in ECIL, make Fluori- meter (Model No: FL6224A) [8]. UV radiation of excitation wavelength 3650Å is irra- diated on the platinum disc containing fused sample and emitted florescence of 5546Å wavelength is unique to uranium [9]. Intensity of fluorescence is proportional to the amount of uranium present in the sample. Standard (1 ug/ml) and blank were processed simultaneously and uranium was estimated by using the formula Sample readingBlank reading UμgStandardreadingBlank reading The uranium content of the original sample was ob- tained from the above equation by further applying the sampling parameters. The advantage of this method is aqueous to organic ratio is not critical and may be varied over a wide range. There is no need of any salting out reagent and organic phase can directly planchatted. The disadvantage of this method is that the fusion mixture is hygroscopic and measurement of fluorescence intensity should be measured without giving much delay. The de- tection limit of this method is 0.1 g. 2.2. Quality Control Quality assurance of the analytical procedure followed was determined by using certified reference materials (SRMs) produced by Canada Center for Mineral and Energy Technology (CANMET) and supplied by Bureau of analysed samples Ltd., UK. Environmental reference sample such as lake sediments (LKSD-1&3), stream sediment (STSD-1) and geochemical soil (TILL-1&2) were analysed for natural uranium. The result of the analysis is presented in Table 3. 3. Result and Discussions 3.1. Distribution of Uranium in water and Intake The histogram of uranium concentration in ground water around the uranium mining industry over the study pe- riod is presented in Figure 1. A year wise geometric mean concentration of uranium in the ground water sources in different distance zones is presented in Table 1. However, the maximum concentration of U(nat) within 1.6 km distance was observed at 11 g·l–1 with GM of 1.13 g·l–1 and GSD of 2.64 during the entire study period. The large variation in the uranium concen- tration is due to uneven distribution of uranium in the lithosphere. Further, the histogram plot (Figure 2) of the data set reveals that in majority of ground water sources Copyright © 2011 SciRes. JEP 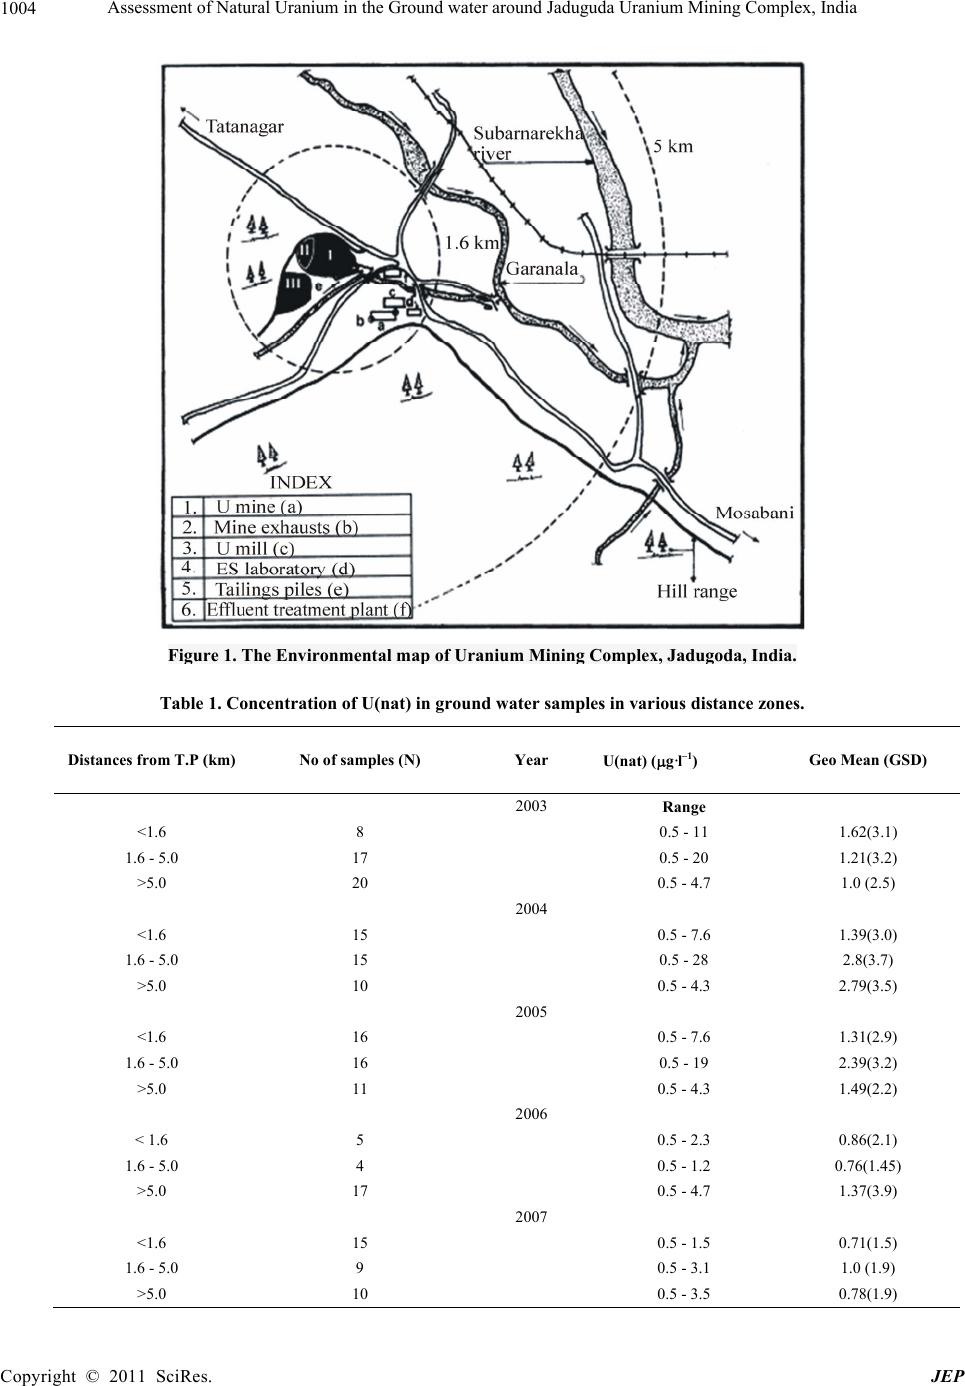 Assessment of Natural Uranium in the Ground water around Jaduguda Uranium Mining Complex, India 1004 Figure 1. The Environmental map of Uranium Mining Complex, Jadugoda, India. Table 1. Concentration of U(nat) in ground water samples in various distance zones. Distances fr om T.P (km) No of samples (N) Year U(nat) (g·l–1) Geo Mean (GSD) 2003 Range <1.6 8 0.5 - 11 1.62(3.1) 1.6 - 5.0 17 0.5 - 20 1.21(3.2) >5.0 20 0.5 - 4.7 1.0 (2.5) 2004 <1.6 15 0.5 - 7.6 1.39(3.0) 1.6 - 5.0 15 0.5 - 28 2.8(3.7) >5.0 10 0.5 - 4.3 2.79(3.5) 2005 <1.6 16 0.5 - 7.6 1.31(2.9) 1.6 - 5.0 16 0.5 - 19 2.39(3.2) >5.0 11 0.5 - 4.3 1.49(2.2) 2006 < 1.6 5 0.5 - 2.3 0.86(2.1) 1.6 - 5.0 4 0.5 - 1.2 0.76(1.45) >5.0 17 0.5 - 4.7 1.37(3.9) 2007 <1.6 15 0.5 - 1.5 0.71(1.5) 1.6 - 5.0 9 0.5 - 3.1 1.0 (1.9) >5.0 10 0.5 - 3.5 0.78(1.9) Copyright © 2011 SciRes. JEP 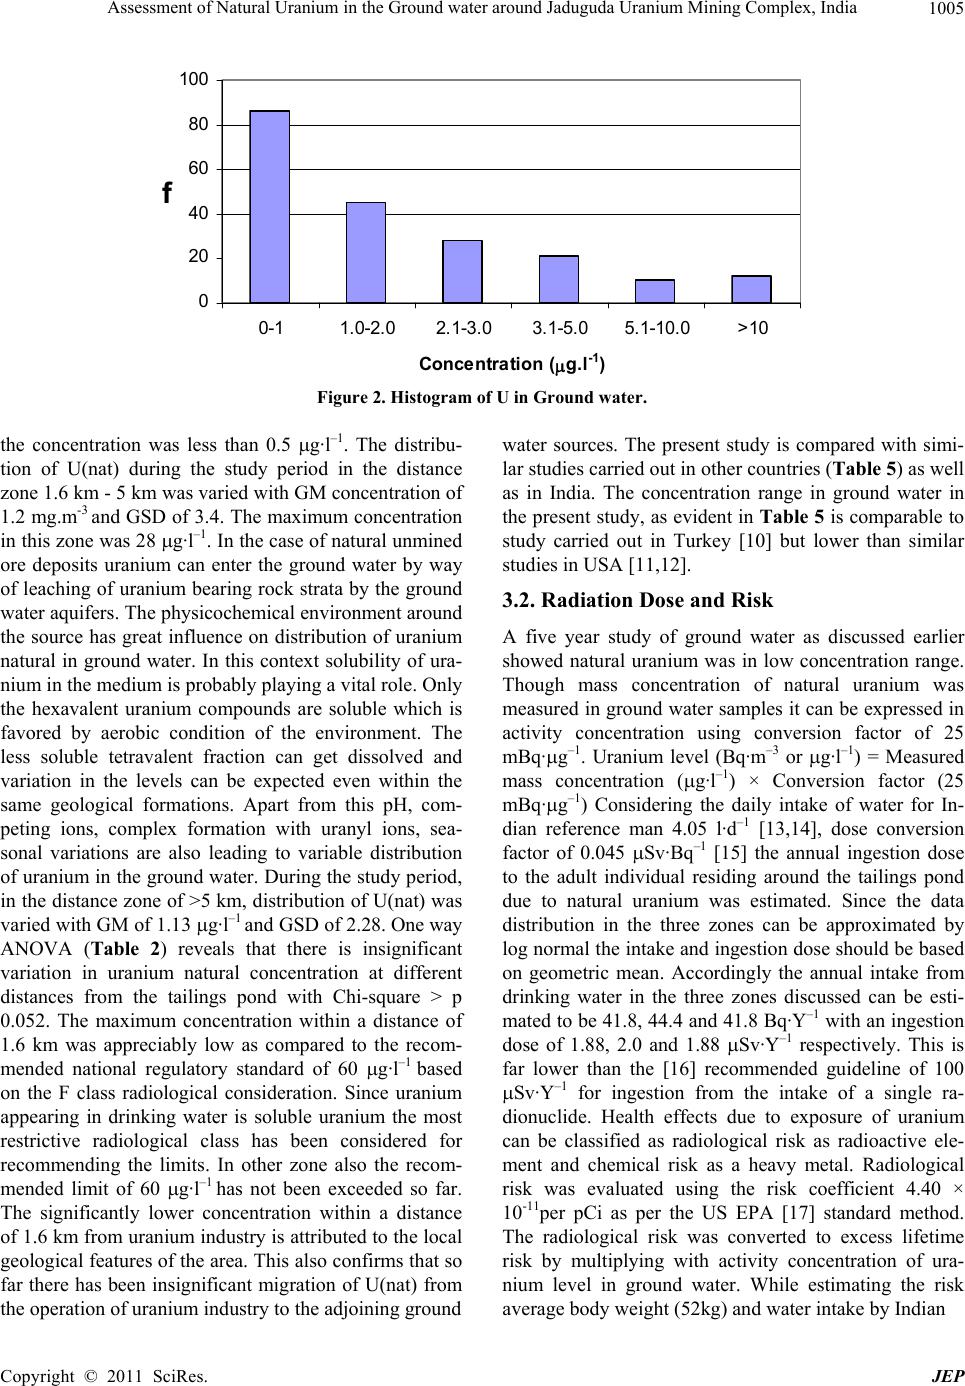 Assessment of Natural Uranium in the Ground water around Jaduguda Uranium Mining Complex, India Copyright © 2011 SciRes. JEP 1005 0 20 40 60 80 100 0-11.0-2.0 2.1-3.0 3.1-5.05.1-10.0>10 Conce ntration (g.l -1 ) f Figure 2. Histogram of U in Ground water. the concentration was less than 0.5 g·l–1. The distribu- tion of U(nat) during the study period in the distance zone 1.6 km - 5 km was varied with GM concentration of 1.2 mg.m-3 and GSD of 3.4. The maximum concentration in this zone was 28 g·l–1. In the case of natural unmined ore deposits uranium can enter the ground water by way of leaching of uranium bearing rock strata by the ground water aquifers. The physicochemical environment around the source has great influence on distribution of uranium natural in ground water. In this context solubility of ura- nium in the medium is probably playing a vital role. Only the hexavalent uranium compounds are soluble which is favored by aerobic condition of the environment. The less soluble tetravalent fraction can get dissolved and variation in the levels can be expected even within the same geological formations. Apart from this pH, com- peting ions, complex formation with uranyl ions, sea- sonal variations are also leading to variable distribution of uranium in the ground water. During the study period, in the distance zone of >5 km, distribution of U(nat) was varied with GM of 1.13 g·l–1 and GSD of 2.28. One way ANOVA (Table 2) reveals that there is insignificant variation in uranium natural concentration at different distances from the tailings pond with Chi-square > p 0.052. The maximum concentration within a distance of 1.6 km was appreciably low as compared to the recom- mended national regulatory standard of 60 g·l–1 based on the F class radiological consideration. Since uranium appearing in drinking water is soluble uranium the most restrictive radiological class has been considered for recommending the limits. In other zone also the recom- mended limit of 60 g·l–1 has not been exceeded so far. The significantly lower concentration within a distance of 1.6 km from uranium industry is attributed to the local geological features of the area. This also confirms that so far there has been insignificant migration of U(nat) from the operation of uranium industry to the adjoining ground water sources. The present study is compared with simi- lar studies carried out in other countries (Table 5) as well as in India. The concentration range in ground water in the present study, as evident in Tabl e 5 is comparable to study carried out in Turkey [10] but lower than similar studies in USA [11,12]. 3.2. Radiation Dose and Risk A five year study of ground water as discussed earlier showed natural uranium was in low concentration range. Though mass concentration of natural uranium was measured in ground water samples it can be expressed in activity concentration using conversion factor of 25 mBq·g–1. Uranium level (Bq·m–3 or g·l–1) = Measured mass concentration (g·l–1) × Conversion factor (25 mBq·g–1) Considering the daily intake of water for In- dian reference man 4.05 l·d–1 [13,14], dose conversion factor of 0.045 Sv·Bq–1 [15] the annual ingestion dose to the adult individual residing around the tailings pond due to natural uranium was estimated. Since the data distribution in the three zones can be approximated by log normal the intake and ingestion dose should be based on geometric mean. Accordingly the annual intake from drinking water in the three zones discussed can be esti- mated to be 41.8, 44.4 and 41.8 Bq·Y–1 with an ingestion dose of 1.88, 2.0 and 1.88 Sv·Y–1 respectively. This is far lower than the [16] recommended guideline of 100 Sv·Y–1 for ingestion from the intake of a single ra- dionuclide. Health effects due to exposure of uranium can be classified as radiological risk as radioactive ele- ment and chemical risk as a heavy metal. Radiological risk was evaluated using the risk coefficient 4.40 × 10⁻¹¹per pCi as per the US EPA [17] standard method. The radiological risk was converted to excess lifetime risk by multiplying with activity concentration of ura- nium level in ground water. While estimating the risk average body weight (52kg) and water intake by Indian  Assessment of Natural Uranium in the Ground water around Jaduguda Uranium Mining Complex, India 1006 Table 2. Kruskal-Wallis One-Way ANOVA for U(nat) variation around tailings pond. Source SS df MS Chi Square Prob > Chi-Square Distance 10898.2 2 54449.1 5.89 0.052 Error 270313.3 150 1802.09 Total 281211.5 152 Table 3. Concentration of Uranium in certified reference materials. Reference Material Unit Certified ConcentrationObserved Concentration LKSD 1 g·g–1 9.7 8.8 ± 0.4 LKSD 3 g·g–14.6 4.4 ± 1.2 TILL 1 g·g–12.2 1.9 ± 0.6 TILL 3 g·g–12.1 1.8 ± 0.5 STSD-1 g·g–18.0 7.8 ± 1.3 Table4. Excess Radiological Risk for ground water Uranium at various distance regions (2003-07). Distance U(mg·m–3) Geo mean Excess Radiological Risk <1.5 km 2.29 6.06 × 10⁻⁶ 1.5 km - 5 km 1.62 4.31 × 10⁻⁶ >5 km 1.17 3.11 × 10⁻⁶ Table 5. Comparison of uranium concentration in drinking water in different countries. Country Range of U(g·l–1) References Turkey 0.24 - 17.65 Kumru at al. [10] South Greenland 0.5 - 1.0 Brown et al [18] USA 0.01 - 652 Cothern et al [11] Kuwait 0.02 - 2.48 Bou-Rabee et al [12] Jordan 0.04 - 1400 Smith et al [19] Central Austrlia >20 Hostetler et al [20] Cochin, India 0.34 - 2.54 Prabhu R.S. et al [21] Jaduguda, India 0.50 - 28 Present Study reference man (4.05 liter per day) were considered. The average life expectancy in India is 60 years was consid- ered as total exposure period. Finally the radiological risk coefficient was estimated as 1.06 × 10⁻⁴ in the Indian scenario. The illustrative calculation is: Risk Factor (per Bq·l–1) = Risk coefficient (4.40 E - 11) × water ingestion rate (4.05 l·day–1) total exposure dura- tion (21,900 day) × conversion factor (27 pCi·Bq–1) = 1.06 × 10⁻⁴ Bq·l–1. Excess life time cancer Risk = uranium level (Bq.l-1) x Risk factor (1.06 × 10⁻⁴ Bq·l–1 ). The radiological risk estimated is presented in Table 4. The risk was found to be in the order of 10–6 and much below the acceptable radiological risk of 10–3 [7]. Hence, the radiological risk due to natural uranium in ground water might be acceptable and the uranium mining in- dustry has insignificant impact in the ground water ura- nium concentration of the study area. 4. Conclusions The distribution of U(nat) in ground water reflects the natural background of the area. The variation in concen- tration at different distances may be attributed to the geological features of the area and the physicochemical environment around the source. A slight reduced ura- nium concentration in the <1.5 km or closest to uranium industry may be attributed to the soil/rock type around the ground water sources. The highest concentration of uranium was found to be 28 g·l–1 is away (1.5 to 5 km distance zone) from mining industry. The intake and in- gestion dose is appreciably low (2 Sv·Y–1) which is far below the WHO recommended level of 100 Sv·Y–1. The risk due to radiological is acceptable and very low. It can be concluded that the ground water around the uranium Copyright © 2011 SciRes. JEP  Assessment of Natural Uranium in the Ground water around Jaduguda Uranium Mining Complex, India1007 industry at Jaduguda is not affected by the uranium min- ing activity. The drinking water studied in three different distance zones of uranium mining facility found to be safe. REFERENCES [1] “Ask the Expert,” Health Physics Society, April 2002. http://www.hps.org/publicinformation/ate/q1906.html [2] P. W. Durbin, “Metabolic Model for Uranium,” In: R. H. Moore, Ed, Biokinetics and Analysis in Man 1984, United States Uranium Registry, National Technical Information Service, Springfield, 1984. [3] J. B. Hursh and N. L. Spoor, “Data on Man,” In: H. C. Hodge, J. N. Stannard and J. B. Hursh, Eds., Uranium, Plutonium, Transplutonium Elements, Springer-Verlag, Berlin, 1973, pp. 197-239. [4] A. J. Lussenhop, J. C. Gallimore, W. H. Sweet, E. G. Struxness and J. Robinson, “The Toxicity in Man of Hexavalent Uranium Following Intravenous Administra- tion,” American Journal of Roentgenology, Vol. 79, No. 1, 1958, pp. 83-100. [5] S. C. Morris and A. F. Meinhold, “Probabilistic Risk Assessment of Nephrotoxic Effect of Uranium in Drink- ing Water,” Health Physics, Vol. 69, No. 6, 1995, pp. 897-908. doi:10.1097/00004032-199512000-00003 [6] U.S. EPA, Draft Guidelines for Carcinogen Risk Assess- ment (Review Draft, July 1999), U. S. Environmental Protection Agency, Risk Assessment Forum, Washington, D.C., 1999. [7] D. C. Shin, Y. S. Kim, J. Y. Moon, H. S. Park, J. Y. Kim and S. K. Park, “International Trends in Risk Manage- ment of Groundwater Radionuclides,” Journal of Envi- ronmental Toxicology, Vol. 17, No. 4, 2002, pp. 273-284. [8] K. P. Eappan and P. M. Markose, “Amine Extraction for Uranium Estimation,” Bulletin of Radiation Protection, Vol. 9, 1986, pp. 83-86 [9] I. M. Kolthoff and P. J. Eiving, “Treatise on Analytical Chemistry, Part II. Vol. 9,” Wiley, New York, 1962, pp. 102-111. [10] M. N. Kumru, “Distribution of Radionuclides in Sedi- ments and Soils along the Buyuk Mendres River,” Pro- ceeding of Pakistan Academy of Sciences, Vol.32, 1995, pp. 51-56 [11] C. R. Cotheren and W. L. Lappenbusch, “Occurance of Uranium in Drinking Water in the US,” Health Physics, Vol. 45, No. 1, 1983, pp. 89-99. doi:10.1097/00004032-198307000-00009 [12] F. Bou-Rabee, “Estimating the Concentration of Uranium in Some Environmental Samples in Kuwait after the 1991 Gulf War,” Applied Radiation and Isotopes, Vol. 46. No. 4, 1995, pp. 217-220. doi:10.1016/0969-8043(94)00122-G [13] B. M. Raghunath and S. D. Soman, “Water Intake Data for Indian Reference Man,” Indian Journal of Environ- mental Health, Vol. 2, 1969, pp. 1-7. [14] H. S. Dang, D. D. Jaiswal, M. Parameswaran and S. Krishnamony, “Physical, Anatomical, Physiological and Metabolic Data for Reference Indian Man—A Proposal,” Bhabha Atomic Research Centre, Mumbai, 1994. [15] “Dose Coefficients for Intakes of Radionuclides by Workers,” International Commission on Radiological Protection Series, Annals of the ICRP, Elsevier Health Sciences, Amsterdam, 1995. [16] WHO, Guidelines for Drinking-water Quality, Volume 1, Recommendations, 2004. [17] SEPA, National Primary Drinking Water Regulation Ra- dionuclide, Final Rule, 2000. [18] A. Brown, A. Steenfelt and H. Kunzennorf, “Uranium Districts Defined by Reconnaissance Geo Chemistry in South Greenland,” Journal of Geochemical Exploration, Vol. 19, No. 1-3, 1983, pp. 127-145. doi:10.1016/0375-6742(83)90013-4 [19] B. Smith, A. E. Powel, A. Milodowski, et al., “Identifica- tion, Investigation and Remediation of Ground Water Containing Elevated Level of Uranium-Series Radionu- clides: A Case Study from the Easteron Mediterranean,” Proceddings of the 3rd International Conference on the Geology of the Easteren Mediterranean, Nicosia, Cyprus, 2000. [20] S. Hostetler, J. Wischisen and G. Jacbson, “Ground Water Quality in the Papunya-Kingtore Region Northen Terri- tory,” Austrilian Geological Survey Organization, Can- berra, 1998. [21] R. S. Prabhu, R. Sathyapriya, S. K. Sahoo and S. Maha- patra, “Ingestion Dose Due to Natural Uranium to the Public through Drinking Water Pathways in Two Districts of Keral,” Proceedings of 16th National Symposium on Environment, Hisar, 2008, pp. 551-555. Copyright © 2011 SciRes. JEP |