

Paper Menu >>
Journal Menu >>
 Journal of Environmental Protection, 2011, 2, 974-981 doi:10.4236/jep.2011.27112 Published Online September2011 (http://www.SciRP.org/journal/jep) Copyright © 2011 SciRes. JEP Metanalysis: Respiratory Effects in the General Population Exposed to Urban Pollution Angela Sancini, Francesco Tomei, Assunta Capozzella, Alessandro Pacchiarotti, Simone De Sio, Gianfranco Tomei*, Paola Palermo, Manuela Ciarrocca University of Rome “Sapienza”, Rome, Italy. Email: *[email protected] Received March 30th, 2011; revised July 14th, 2011; accepted August 24th, 2011. ABSTRACT Aim: The purpose of this study was to evaluate spirometric lung function parameters in the general population exposed to urban pollution and confirm the existence of an association between exposure to environmental pollutants and effects from these products and which respiratory parameters are associated to urban pollution in general population. Methods: This study is a systematic research of all articles on the assessment of respiratory effects on general population exposed to urban pollution, excluding studies on adolescents and children. The research included articles from January 2008 to May 2009. In the articles included in our meta-analysis, the exposed group is represented by general population aged between 15 and 75 years for both genders, resident in very polluted urban areas, while the control group is represented by general population resident in rural and suburban areas, where pollution is lower. Results: The results confirm the presence of statistica lly significant effects of urban pollu tion on the respiratory system for cough, phlegm, shortness of breath/breathlessness, wheezing, FVC, FEV1, PEFR, chronic bronchitis, bronchial asthma, rhinitis, emphysema. Keywords: Urban Pollution, Respiratory Symptoms on General Population , Lung Disease, Environmental Exposure 1. Introduction On the basis of the assessment conducted by WHO, urban pollution is a very significant public health problem. Studies of assessment have invariably shown that adverse effects of air pollution on health are substantial. Measures of containment have produced a reduction of urban pollution levels, but results of recent studies continue to emphasize acute and chronic effects on health, even when these levels are low. Epidemiological research has consistently documented a wide range of adverse effects to human health for exposure to pollutants: it has been documented a wide range of adverse health outcomes due to short and long term exposure to air pollutant concentration levels for urban populations. Numerous clinical and toxicological studies have provided significant information about the specific effects of pollutants and the possible mechanisms of action these effects have. General population is daily exposed to pollutants of various kinds. These pollutants are made up of chemical and physical (i.e. noise). Furthermore, the presence of high levels of air pollu- tion is connected to respiratory symptoms and disease in various European and non European countries: in the U.S., the presence of chronic bronchitis was significantly associated with fine particle pollution [1]. In Italy it was shown that residents in a rural area have prevalence rates of respiratory symptoms lower than children who live in urban areas [21,22]. Another important European study has shown, in adults, an increased risk of developing a framework of bronchitis resulting from exposure to traffic pollution from motor vehicles [2]. The respiratory symptoms of 40 - 59 year old women, who spent much of their time at home, was related to the proximity of their residence to high motor vehicle traffic areas[15]. Other studies to re- member in this context are conducted on a population of at least 10 years in metropolitan areas or rural areas, where there has been a significant association between symptoms of chronic obstructive respiratory disease and high levels of particulates [3]. The purpose of this study was to evaluate spirometric lung function parameters in the general population ex- posed to urban pollution and confirm the existence of an  Metanalysis: Respiratory Effects in the General Population Exposed to Urban Pollution975 association between exposure to environmental pollu- tants and effects from these products and which respira- tory parameters are associated to urban pollution in gen- eral population. 2. Materials and Methods This study has been conducted with a systematic research of all articles on the assessment of respiratory effects in the general population exposed to urban pollution, excluding studies on adolescents and children. The research included articles from January 2008 (year of enactment of Presidential Decree 203/88: “Implementa- tion of directives CEE n. 80/779, 82/884, 84/360 and 85/203 that pertain to air quality directives, relatively to specific pollutant and the pollution producted by industry, pursuant to art. 15 of Law of April 16, 1987, number 183”) to May 2009. We used the following electronic search engines, available online: Biomedcentral MEDLINE/ PubMed MEDLINE/ National Library of Medicine (NLM) MEDLINE Plus Nioshtic-2 Scopus TOXNET/Toxline Furthermore we examined the acts of national con- gresses organized by S.I.M.L.I.I. (Italian Society of Oc- cupational Health and Industrial Hygiene) and by A.I.D.I.I. (Italian Association of Industrial Hygienist) and many books of Environmental health. For all search engines we used the following key words: Air pollution (or pollutant) and urban (or rural or general) population Urban pollution (or pollutants) and urban (or rural or general) population Urban air pollution and urban (or rural or general) population Urban atmospheric pollution (or pollutant) and urban (or rural or general) population Ambient air (pollution) and urban (or rural or general) population Ambient exposure and urban (or rural or general) population Environmental exposure and urban (or rural or gen- eral) population Particulate matter (PM) and urban (or rural or general) population Urban particulate matter (UPM) and urban (or rural or general) population Ultrafine particulate matter and urban (or rural or general) population Ultrafine particles (fine particles) and urban (or rural or general) population Concentrated ambient fine particles (CAP) and urban (or rural or general) population Volatile organic compounds (VOCs) and urban (or rural or general) population Suspended particulate matter (SPM) and urban (or rural or general) population Total suspended particulate matter (TSPM) and urban (or rural or general) population Traffic emissions (air pollution) and urban (or rural or general) population Urban traffic and urban (or rural or general) popula- tion Road traffic (pollution) and urban (or rural or general) population High (or heavy) traffic density and urban (or rural or general) population Of the 976 publications we found, 85 turned out to be inherent with the aim of our study and only 22 responded to the following inclusion criteria: 1) Case-Control studies, studies in which the experimental group was composed of subjects vulnerable to urban pollution and the control group was made up of subjects exposed to a lower degree of urban pollution; 2) Studies that reported results in numerical terms of media and standard deviation (for the continues variables) or of frequency (for not continue variables); their main characteristics are reported in Tables 1-3. We tried to contact the authors of publications in which the results were expressed in unvailable numeric form, to obtain substantial data but did not have any answer. 3. Description of Participants In the articles included in our meta-analysis, the exposed group is represented by general population aged between 15 and 75 years for both gender, resident in most polluted urban areas, while the control group is re- presented by general population resident in rural and suburban areas, where pollution is lower. The numbers of participants included in this meta- analysis is 48.848; the number of cases is 22.414 while the number of controls is 26.434. In the studies, where is specified, total number of male subjects in the case group is 10.357 while the number of female is 10.965. In the studies, where is specified, total number of male subjects in the control group is 13.457 while the number of female is 12.136. 4. Data Organization After a careful analysis of selected studies we have identified the most frequently studied variables on the Copyright © 2011 SciRes. JEP 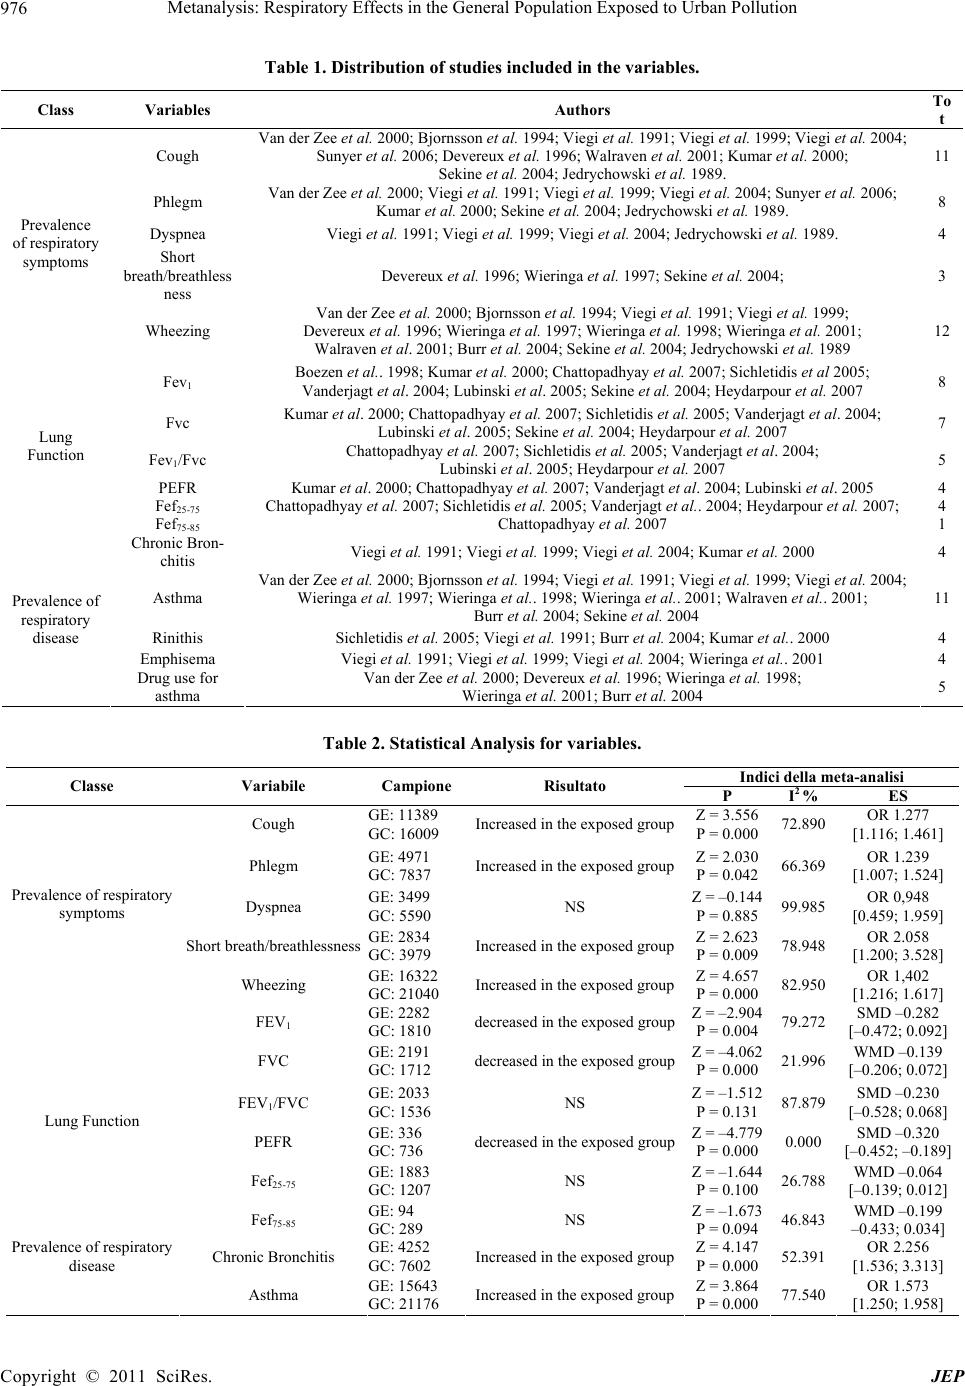 Metanalysis: Respiratory Effects in the General Population Exposed to Urban Pollution 976 Table 1. Distribution of studies included in the variables. Class Variables Authors To t Cough Van der Zee et al. 2000; Bjornsson et al. 1994; Viegi et al. 1991; Viegi et al. 1999; Viegi et al. 2004; Sunyer et al. 2006; Devereux et al. 1996; Walraven et al. 2001; Kumar et al. 2000; Sekine et al. 2004; Jedrychowski et al. 1989. 11 Phlegm Van der Zee et al. 2000; Viegi et al. 1991; Viegi et al. 1999; Viegi et al. 2004; Sunyer et al. 2006; Kumar et al. 2000; Sekine et al. 2004; Jedrychowski et al. 1989. 8 Dyspnea Viegi et al. 1991; Viegi et al. 1999; Viegi et al. 2004; Jedrychowski et al. 1989. 4 Short breath/breathless ness Devereux et al. 1996; Wieringa et al. 1997; Sekine et al. 2004; 3 Prevalence of respiratory symptoms Wheezing Van der Zee et al. 2000; Bjornsson et al. 1994; Viegi et al. 1991; Viegi et al. 1999; Devereux et al. 1996; Wieringa et al. 1997; Wieringa et al. 1998; Wieringa et al. 2001; Walraven et al. 2001; Burr et al. 2004; Sekine et al. 2004; Jedrychowski et al. 1989 12 Fev1 Boezen et al.. 1998; Kumar et al. 2000; Chattopadhyay et al. 2007; Sichletidis et al 2005; Vanderjagt et al. 2004; Lubinski et al. 2005; Sekine et al. 2004; Heydarpour et al. 2007 8 Fvc Kumar et al. 2000; Chattopadhyay et al. 2007; Sichletidis et al. 2005; Vanderjagt et al. 2004; Lubinski et al. 2005; Sekine et al. 2004; Heydarpour et al. 2007 7 Fev1/Fvc Chattopadhyay et al. 2007; Sichletidis et al. 2005; Vanderjagt et al. 2004; Lubinski et al. 2005; Heydarpour et al. 2007 5 PEFR Kumar et al. 2000; Chattopadhyay et al. 2007; Vanderjagt et al. 2004; Lubinski et al. 2005 4 Fef25-75 Chattopadhyay et al. 2007; Sichletidis et al. 2005; Vanderjagt et al.. 2004; Heydarpour et al. 2007; 4 Lung Function Fef75-85 Chattopadhyay et al. 2007 1 Chronic Bron- chitis Viegi et al. 1991; Viegi et al. 1999; Viegi et al. 2004; Kumar et al. 2000 4 Asthma Van der Zee et al. 2000; Bjornsson et al. 1994; Viegi et al. 1991; Viegi et al. 1999; Viegi et al. 2004; Wieringa et al. 1997; Wieringa et al.. 1998; Wieringa et al.. 2001; Walraven et al.. 2001; Burr et al. 2004; Sekine et al. 2004 11 Rinithis Sichletidis et al. 2005; Viegi et al. 1991; Burr et al. 2004; Kumar et al.. 2000 4 Emphisema Viegi et al. 1991; Viegi et al. 1999; Viegi et al. 2004; Wieringa et al. . 2001 4 Prevalence of respiratory disease Drug use for asthma Van der Zee et al. 2000; Devereux et al. 1996; Wieringa et al. 1998; Wieringa et al. 2001; Burr et al. 2004 5 Table 2. Statistical Analysis for variables. Indici della meta-analisi Classe Variabile CampioneRisultato P I2 % ES Cough GE: 11389 GC: 16009 Increased in the exposed groupZ = 3.556 P = 0.000 72.890 OR 1.277 [1.116; 1.461] Phlegm GE: 4971 GC: 7837 Increased in the exposed groupZ = 2.030 P = 0.042 66.369 OR 1.239 [1.007; 1.524] Dyspnea GE: 3499 GC: 5590 NS Z = –0.144 P = 0.885 99.985 OR 0,948 [0.459; 1.959] Short breath/breathlessness GE: 2834 GC: 3979 Increased in the exposed groupZ = 2.623 P = 0.009 78.948 OR 2.058 [1.200; 3.528] Prevalence of respiratory symptoms Wheezing GE: 16322 GC: 21040 Increased in the exposed groupZ = 4.657 P = 0.000 82.950 OR 1,402 [1.216; 1.617] FEV1 GE: 2282 GC: 1810 decreased in the exposed groupZ = –2.904 P = 0.004 79.272 SMD –0.282 [–0.472; 0.092] FVC GE: 2191 GC: 1712 decreased in the exposed groupZ = –4.062 P = 0.000 21.996 WMD –0.139 [–0.206; 0.072] FEV1/FVC GE: 2033 GC: 1536 NS Z = –1.512 P = 0.131 87.879 SMD –0.230 [–0.528; 0.068] PEFR GE: 336 GC: 736 decreased in the exposed groupZ = –4.779 P = 0.000 0.000 SMD –0.320 [–0.452; –0.189] Fef25-75 GE: 1883 GC: 1207 NS Z = –1.644 P = 0.100 26.788 WMD –0.064 [–0.139; 0.012] Lung Function Fef75-85 GE: 94 GC: 289 NS Z = –1.673 P = 0.094 46.843 WMD –0.199 –0.433; 0.034] Chronic Bronchitis GE: 4252 GC: 7602 Increased in the exposed groupZ = 4.147 P = 0.000 52.391 OR 2.256 [1.536; 3.313] Prevalence of respiratory disease Asthma GE: 15643 GC: 21176 Increased in the exposed groupZ = 3.864 P = 0.000 77.540 OR 1.573 [1.250; 1.958] Copyright © 2011 SciRes. JEP 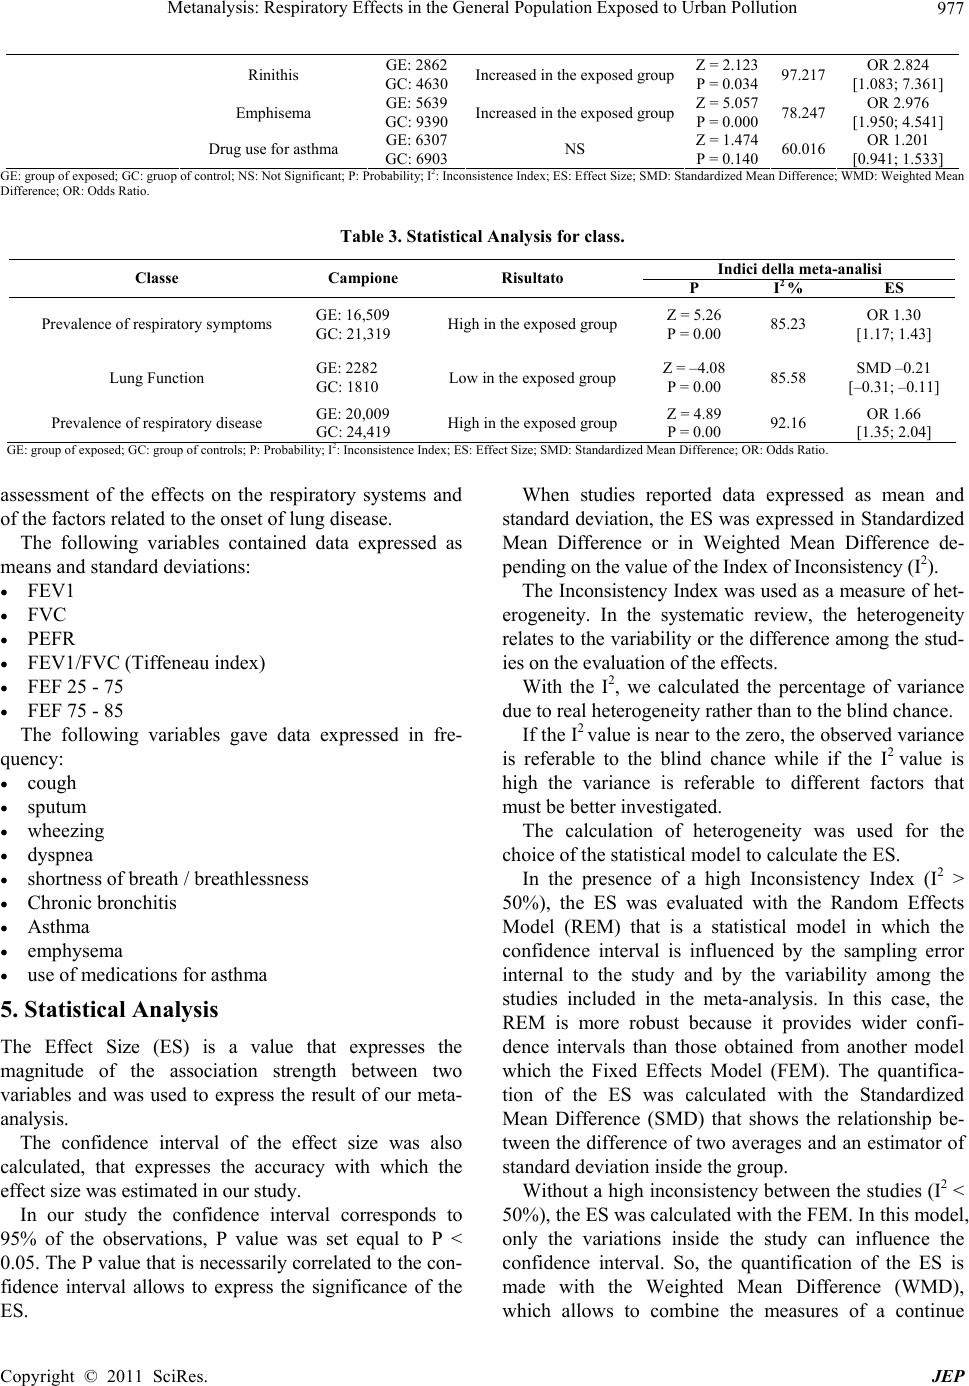 Metanalysis: Respiratory Effects in the General Population Exposed to Urban Pollution Copyright © 2011 SciRes. JEP 977 Rinithis GE: 2862 GC: 4630 Increased in the exposed groupZ = 2.123 P = 0.034 97.217 OR 2.824 [1.083; 7.361] Emphisema GE: 5639 GC: 9390 Increased in the exposed groupZ = 5.057 P = 0.000 78.247 OR 2.976 [1.950; 4.541] Drug use for asthma GE: 6307 GC: 6903 NS Z = 1.474 P = 0.140 60.016 OR 1.201 [0.941; 1.533] GE: group of exposed; GC: gruop of control; NS: Not Significant; P: Probability; I2: Inconsistence Index; ES: Effect Size; SMD: Standardized Mean Difference; WMD: Weighted Mean Difference; OR: Odds Ratio. Table 3. Statistical Analysis for class. Indici della meta-analisi Classe Campione Risultato P I2 % ES Prevalence of respiratory symptoms GE: 16,509 GC: 21,319 High in the exposed group Z = 5.26 P = 0.00 85.23 OR 1.30 [1.17; 1.43] Lung Function GE: 2282 GC: 1810 Low in the exposed group Z = –4.08 P = 0.00 85.58 SMD –0.21 [–0.31; –0.11] Prevalence of respiratory disease GE: 20,009 GC: 24,419 High in the exposed group Z = 4.89 P = 0.00 92.16 OR 1.66 [1.35; 2.04] GE: group of exposed; GC: group of controls; P: Probability; I2: Inconsistence Index; ES: Effect Size; SMD: Standardized Mean Difference; OR: Odds Ratio. assessment of the effects on the respiratory systems and of the factors related to the onset of lung disease. The following variables contained data expressed as means and standard deviations: FEV1 FVC PEFR FEV1/FVC (Tiffeneau index) FEF 25 - 75 FEF 75 - 85 The following variables gave data expressed in fre- quency: cough sputum wheezing dyspnea shortness of breath / breathlessness Chronic bronchitis Asthma emphysema use of medications for asthma 5. Statistical Analysis The Effect Size (ES) is a value that expresses the magnitude of the association strength between two variables and was used to express the result of our meta- analysis. The confidence interval of the effect size was also calculated, that expresses the accuracy with which the effect size was estimated in our study. In our study the confidence interval corresponds to 95% of the observations, P value was set equal to P < 0.05. The P value that is necessarily correlated to the con- fidence interval allows to express the significance of the ES. When studies reported data expressed as mean and standard deviation, the ES was expressed in Standardized Mean Difference or in Weighted Mean Difference de- pending on the value of the Index of Inconsistency (I2). The Inconsistency Index was used as a measure of het- erogeneity. In the systematic review, the heterogeneity relates to the variability or the difference among the stud- ies on the evaluation of the effects. With the I2, we calculated the percentage of variance due to real heterogeneity rather than to the blind chance. If the I2 value is near to the zero, the observed variance is referable to the blind chance while if the I2 value is high the variance is referable to different factors that must be better investigated. The calculation of heterogeneity was used for the choice of the statistical model to calculate the ES. In the presence of a high Inconsistency Index (I2 > 50%), the ES was evaluated with the Random Effects Model (REM) that is a statistical model in which the confidence interval is influenced by the sampling error internal to the study and by the variability among the studies included in the meta-analysis. In this case, the REM is more robust because it provides wider confi- dence intervals than those obtained from another model which the Fixed Effects Model (FEM). The quantifica- tion of the ES was calculated with the Standardized Mean Difference (SMD) that shows the relationship be- tween the difference of two averages and an estimator of standard deviation inside the group. Without a high inconsistency between the studies (I2 < 50%), the ES was calculated with the FEM. In this model, only the variations inside the study can influence the confidence interval. So, the quantification of the ES is made with the Weighted Mean Difference (WMD), which allows to combine the measures of a continue  Metanalysis: Respiratory Effects in the General Population Exposed to Urban Pollution 978 scale when average, standard deviation and numerosity of the sample are known parameters. The importance that is given to each study is determined by the precision of the estimator of the effect provided that all studies have measured the variable with the same rating scale. A dif- ference of 0.0 showed lack of difference among studied groups, for the measures of ES based on the differences (i.e. SMD and WMD).The ES was expressed in terms of Odds Ratio (OR), when the studies reported data ex- pressed in frequency. As described above, in the presence of a high degree of heterogeneity (I2 > 50%), the ES was assessed with the Random Effects Model (REM) while in the absence of high heterogeneity among studies (I2 < 50 %), the calcu- lation of the ES was performed with the Fixed Effects Model (FEM). A ratio of 1.0 indicates no difference among the stud- ied groups, for measures of ES based on the reports (i.e. OR) [4]. The results are been detected on the basis of the activ- ity of research after a convention between the University of Rome “Sapienza” (Unit of Occupational Medicine) and INAIL (National Institute for the Insurance against the Accident at Work). 6. Results From the elaboration of the data inherent to each class we had the following results [1-26]: The prevalence of respiratory symptoms, evaluated in 15 studies, on a total sample of 16.509 cases and 21.319 controls, appears significantly higher in the group of subjects exposed to urban pollution than in the group of less exposed subjects (OR 1.30 [1.18; 1.43]) the value of heterogeneity among the studies was I2 85.23. The lung function, evaluated in 8 studies, on a total sample of 2.282 cases and 1.810 controls, appears significantly lower in the group of less exposed sub- jects to urban pollution than in the group of less ex- posed subjects (SMD –0.21 [–0.31; –0.11]) the value of heterogeneity among the studies was I2 85.58. The prevalence of respiratory disease, evaluated in 13 studies, on a total sample of 20.009 cases and 24.419 controls, appears significantly higher in the group of subjects exposed to urban pollution than in the group of less exposed subjects (OR 1.66 [1.35; 2.04]) the value of heterogeneity among the studies was I2 92.16. The statistical analysis of data expressed as mean and standard deviation gave the following results (Table 2): The average FVC, evaluated in 7 studies, on a total sample of 2.191 cases and 1.712 controls, appears significantly lower in the group of subjects exposed to urban pollution than in the group of less exposed subjects (WMD –0.139 [–0.206; –0.072]) the value of heterogeneity among the studies was I2 21.996 (P = 0.000). The average FEV1, evaluated in 8 studies, on a total sample of 2.282 cases and 1.810 controls, appears significantly lower in the group of subjects exposed to urban pollution than in the group of less exposed subjects (SMD –0.282 [–0.472; –0.092]) the value of heterogeneity among the studies was I2 79.272 (P = 0.004). The PEFR average evaluated in 4 studies, on a total sample of 336 cases and 736 controls, appears sig- nificantly lower in the group of subjects exposed to urban pollution than in the group of less exposed subjects (SMD –0.320 [–0.452; –0.189]) the value of heterogeneity among the studies was (I2 0.00; P = 0.000). For all other evaluated parameters (FEV1/FVC, FEF25-75, FEF75-85) there were no statistically sig- nificant differences in the comparison of values found in the exposed group and in the group of less ex- posed. The statistical treatment of data expressed in frequency gave the following results (Table 2): Prevalence of respiratory symptoms: cough (OR 1.277 [1.116 to 1.461]; I2 72.890, P 0.000), phlegm (OR 1.239 [1.007 to 1.524]; I2 66.369, P 0.042), wheezing (OR 1.402 [1.216 to 1.617]; I2 82.950, P 0.000), shortness of breath/breathlessness (OR 2.058 [1.200 to 3.528]; I2 78.948, P 0.009), increased sig- nificantly in the group of subjects exposed to urban air pollution compared to the group of less exposed; Prevalence of respiratory disease: chronic bronchitis (OR 2.256 [1.536 to 3.313]; I2 52.391, P 0.000), bronchial asthma (OR 1.573 [1.250 to 1.980]; I2 77.540, P 0.000), rhinitis (OR 2.824 [1.083 to 7.361]; I2 97.217, P 0.034) and emphysema (OR 2.976 [1.954 to 4.541]; I2 78.247, P 0.000) increased significantly in the group of subjects exposed to urban air pollution compared with subjects less exposed. As to the other parameters no statistically significant differences appeared in the comparison of the frequen- cies found in the two groups. 7. Discussion The results of our meta-analysis allow to confirm the evidence of the effects of urban pollution on the respira- tory system, although the mechanisms of action have been clarified only in part (Committee the Environmental and Occupational Health Assembly of the American Thoracic Society 1996). The effects of pollutants on the respiratory system de- Copyright © 2011 SciRes. JEP  Metanalysis: Respiratory Effects in the General Population Exposed to Urban Pollution979 pend on the type of pollutant, its concentration in the environment, on the duration of exposure and ventilatory capacity [11]. Our results in line with other studies in the scientific literature support the hypothesis that the reduction of some parameters of lung function such as FVC, FEV1 and PEFR found in the general population living in urban areas, or in areas with high pollution, could be due to exposure to urban pollutants and depict a framework of obstructive syndrome [12]. In one study [5], conducted in the USA, there was a significant association between lung function and levels of suspended particles in the non-smoking adults exam- ined (NHANES I). The study showed that the increase of particulate was associated with a decrease of FVC: this association ceased approximately below 60 μg/m3 of particulate [10]. A reduction of respiratory capacity (FVC and FEV1) is also observed in the study of Pope III et al. 1993: in particular a decrease of 2% of FEV 1 for rise of PM10 of 100 g/m3 in the subjects examined resulted statistically significant, all the subjects were smokers with mild or moderate chronic obstructive lung disease [13]. Another study [7] that must be remembered was made in Cracovia on 1414 persons who hadn’t changed resi- dence in the last 8 years: a faster decrease of respiratory function was observed in persons living in an areas with SO2 and PM10 pollution compared people living in other areas. An association between previous chronic exposition to high levels of air pollution and respiratory function was found in non-smokers living in 2 areas characterized by different levels of pollution [16,17]. In an Italian study among subjects with BPCO and asthma, the results of the analysis show that an increase of environmental concentrations of PM10 and PM2,5 causes a decrease of respiratory function during the fol- lowing 24 h - 48 h [18-20]. A Dutch study shows a reverse correlation between FEV1 and nearness to a very busy freeway or between FEV1 and the number of heavy vehicles in a day [8]. The availability of controlled studies in the literature is rather small but the number of subjects studied is quite high. Many studies [22-24] show a disparity between the number of those who constitute the experimental group and the size of the control group with the resulting dis- tortion of the results. However, the processing of the data available, grouped by the three classes, allowed us to demonstrate an im- pairment of the respiratory system characterized by: 1) reduction in lung function (I2 98.23); 2) increased prevalence of the class of symptoms (I2 55.65); 3) increase in respiratory disease (I2 51.31). Among the class of respiratory symptoms, the results on the short breath/breathlessness and wheezing were the most sensitive. With an ES of 2.06 and 1.40 respectively, the meta- analysis indicates that within the population most ex- posed, shortness of breath/breathlessness and wheezing were observed more frequently than in individuals be- longing to the group of less exposed. Studies concerning the variable shortness of breath/ breathlessness and wheezing, show a low homogeneity represented by their high value of I2 (respectively 78.95 and 82.95) [25]. Among respiratory disease, variables with a high sen- sitivity that can be attributed to the effects of pollution include chronic bronchitis, emphysema with an ES of 2.25 and 2.97 respectively. The heterogeneity among the studies which analysed for the presence of chronic bronchitis is 52.39 instead of 78.24 for the variable emphysema [9]. Among the statis- tically significant results related to lung function the pa- rameters FVC, FEV1 and PEFR are all reduced, indicat- ing obstructive deficit as chronic effect in the exposed population. The ES of the FVC and FEV1 PEFR is re- spectively –0.14 and –0.28 –0.32 while the value of I2 is respectively 21.99, 79.27 and zero. The meta-analysis identified the variables that can be used as indicators of the effects of pollution on the respi- ratory system. Variables with low heterogeneity and high sensitivity as the PEFR and bronchitis may be considered useful indicators of exposure to urban pollutants [26]. The variables with high sensitivity and high heteroge- neity such as emphysema and shortness of breath/ breathlessness should be further explored in future stud- ies to verify their usefulness as indicators of exposure to urban pollution. 8. Conclusions In the light of the results is clear that the health of the population exposed to urban pollution must necessarily include a careful evaluation of the respiratory system through targeted surveys to the variables mentioned above with high sensitivity. REFERENCES [1] D. E. Abbey, B. E. Ostro, F. Petersen and R. J. Burchette, “Chronic Respiratory Symptoms Associated with Esti- mated Long-Term Ambient Concentrations of Fine Par- ticulates Less Than 2.5 Microns in Aerodynamic Diameter (PM2.5) and Other Air Pollutants,” Journal of Exposure Science and Environmental Epidemiology, Vol. 5, No. 2, 1995, pp. 137-159. [2] N. Künzli, R. Kaiser, S. Medina, M. Studnicka, O. Chanel, P. Filliger, M. Herry, F. Horak Jr., V. Puybonnieux- Tex- Copyright © 2011 SciRes. JEP  Metanalysis: Respiratory Effects in the General Population Exposed to Urban Pollution 980 ier, P. Quenel, J. Schneider, R. Seethaler, J. C. Vergnaud and H. Sommer, “Publichealth Impact of Outdoor and Traffic-Related Air Pollution: A European Assessment,” Lancet, Vol. 356, No. 9232, 2000, pp. 795-801. [3] D. E. Abbey, et al., “Long-Term Ambient Concentrations of Total Suspended Particulates, Ozone, and Sulfur Di- oxide and Respiratory Symptoms in a Nonsmoking Population,” Archives of Environmental Health, Vol. 48, No. 1, 1993, pp. 33-46. [4] M. Borestein, L. V. Hedges, J. P. T. Higgins and H. R. Rothstein, “Introduction to Meta-Analysis,” John Wiley and Sons, Ltd. Chichester, 2009. [5] L. G. Chestnut, J. Schwartz, D. A. Savitz, et al ., “Pulmo- nary Function and Ambient Particulate Matter: Epidemi- ological Evidence from NHANES I,” Archives of Envi- ronmental Health, Vol. 46, No. 3, 1991, pp. 135-144. doi:10.1080/00039896.1991.9937440 [6] B. Accordi and E. L. Palmieri, “L’atmosfera Terrestre e i suoi Fenomeni da Il Globo Terrestre e la Sua Evoluzione,” 3rd Edition, Bologna-Zanichelli Edizioni, Modena, 1991, pp. 273-307. [7] W. Jedrychowski and M. Krzyzanowski, “Ventilatory Lung Function and Chronic Chest Symptoms among the Inhabitants of Urban Areas with Various Levels of Acid Aerosols: Prospective Study in Cracow,” Environmental Health Perspectives, Vol. 79, 1989, pp. 101-107. doi:10.1289/ehp.8979101 [8] R. Van der Lende, T. Kok, R. Peset, H. Quanjer, J. P. Schouten and G. M. Orie, “Long-Term Exposure to Air Pollution and Decline in VC and FEV1: Recent Results from a Longitudinal Epidemiologic Study in the Nether- lands,” Chest, Vol. 80, No. S1, 1981, pp. 23-26. [9] E. Björnsson, P. Plaschke, E. Norrman, C. Janson, B. Lundbäck, A. Rosenhall, N. Lindholm, L. Rosenhall, E. Berglund and G. Boman, “Symptoms Related to Asthma and Chronic Bronchitis in Three Areas of Sweden,” European Respiratory Journal, Vol. 7, No. 12, 1994, pp. 2146-2153. [10] M. Boezen, J. Schouten, B. Rijcken, J. Vonk, J. Gerritsen, S. Van Der Zee, G. Hoek, B. Brunekreef and D. Postma, “Peak Expiratory Flow Variability, Bronchial Respon- siveness, and Susceptibility to Ambient Air Pollution in Adults,” American Journal of Respiratory and Critical Care Medicine, Vol. 158, 1998, pp. 1848-1854. [11] M. L. Burr, G. Karani, B. Davies, B. A. Holmes and K. L. Williams, “Effects on Respiratory Health of a Reduction in Air Pollution from Vehicle Exhaust Emissions,” Oc- cupational and Environmental Medicine, Vol. 61, No. 3, 2004, pp. 212-218. doi:10.1136/oem.2002.003244 [12] B. P. Chattopadhyay, A. Mukherjee, K. Mukherjee and A. Roychowdhury, “Exposure to Vehicular Pollution and Assessment of Respiratory Function in Urban Inhabi- tants,” Lung, Vol. 185, No. 5, 2007, pp. 263-270. doi:10.1007/s00408-007-9015-0 [13] G. Devereux, T. Ayatollahi, R. Ward, C. Bromly, S. J. Bourke, S. C. Stenton and D. J. Hendrick, “Asthma, Air- ways Responsiveness and Air Pollution in Two Contrast- ing Districts of Northern England,” Thorax, Vol. 51, No. 2, 1996, pp. 169-174. [14] H. Fereidoun, M. S. Nourddin, N. A. Rreza1, A. Mohsen, R. Ahmad and H. Pouria, “The Effect of Long-Term Ex- posure to Particulate Pollution on the Lung Function of Teheranian and Zanjanian Students,” Pakistan Journal of Physiology, Vol. 3, No. 2, 2007. [15] K. Kumar, C. E. Prasad, N. Balakrishna, K. Visweswara Rao and P. U. M. Reddy, “Respiratory Symptoms and Spirometric Observations in Relation to Atmospheric Pollutants in a Sample of Urban Population,” Asia-Pacific Journal of Public Health, Vol. 12, No. 2, 2000, p. 58. doi:10.1177/101053950001200202 [16] K. Sekine, M. Shima, Y. Nitta and M. Adachi, “Long Term Effects of Exposure to Automobile Exhaust on the Pulmonary Function of Female Adults in Tokyo, Japan,” Occupational and Environmental Medicine, Vol. 61, No. 4, 2004, pp. 350-357. doi:10.1136/oem.2002.005934 [17] L. Sichletidis, I. Tsiotsios, A. Gavriilidis, D. Chloros, I. Kottakis, E. Daskalopoulou and T. Konstantinidis, “Prevalence of Chronic Obstructive Pulmonary Disease and Rhinitis in Northern Greece,” Respiration, Vol. 72, No. 3, 2005, pp. 270-277. [18] J. Sunyer, D. Jarvis, T. Gotschi, R. Garcia-Esteban, B. Jacquemin, I. Aguilera, U. Ackerman, R. de Marco, B. Forsberg, T. Gislason, J. Heinrich, D. Norba¨ck, S. Vil- lani and N. Ku¨nzli, “Chronic Bronchitis and Urban Air Pollution in an international Study,” Occupational and Environmental Medicine, Vol. 63, No. 12, 2006, pp. 836-843. doi:10.1136/oem.2006.027995 [19] S. C. Van der Zee, G. Hoek, M. H. Boezen, J. P. Schouten, J. H. van Wijnen and B. Brunekreef, “Acute Effects of Air Pollution on Respiratory Health of 50±70 Yr Old Adults,” Eur Respir J, Vol. 15, No. 4, 2000, pp. 700-709. doi:10.1034/j.1399-3003.2000.15d13.x [20] D. J. VanderJagt, K. D. McClung, H. A. Kassam, M. S. Harkins and R. H. Glew, “Pulmonary Function of Herdsmen,” Journal of the National Medical Association, Vol. 96, No. 4, 2004, pp. 550-555. [21] G. Viegi, P. Paoletti, L. Carrozzi, M. Vellutini, E. Divig- giano, C. Di Pede, G. Pistelli, G. Giutini and M. D. Le- bowitzt, “Prevalence Rates of Respiratory Symptoms in Italian General Population Samples Exposed to Different Levels of Air Pollution,” Environmental Health Perspec- tives, Vol. 94, 1991, pp. 95-99. doi:10.2307/3431299 [22] G. Viegi, M. Pedreschi, S. Baldacci, L. Chiaffi, F. Pistelli, P. Modena, M. Vellutini, F. Di Pede and L. Carrozzi, “Prevalence Rates of Respiratory Symptoms and Diseases in General Population Samples of North and Central It- aly,” The International Journal of Tuberculosis and Lung Disease, Vol. 3, No. 11, 1999, pp. 1034-1042. [23] G. Viegi, G. Matteelli, A. Anginom, A. Scognamiglio, S. Baldacci, J. B. Soriano and L. Carrozzi, “The Propor- tional Venn Diagram of Obstructive Lung Disease in the Italian General Population,” Chest, Vol. 126, No. 4, 2004, pp. 1093-1101. [24] G. E. L. Walraven, O. A. Nyan, M. A. B. Van Der sande, W. A. S. Banya, S. M. Ceesay, P. J. M. Milligan and K. P. W. J. Mcadam, “Asthma, Smoking and Chronic Cough in Copyright © 2011 SciRes. JEP  Metanalysis: Respiratory Effects in the General Population Exposed to Urban Pollution Copyright © 2011 SciRes. JEP 981 Rural and Urban Adult Communities in the Gambia,” Clinical and Experimental Allergy, Vol. 31, No. 11, 2001, pp. 1679-1685. doi:10.1046/j.1365-2222.2001.01094.x [25] M. H. Wieringa, J. J. Weyler, F. J. Van Bastelaer, V. J. Nelen, M. P. Van Sprundel and P. A. Vermeire, “Higher Asthma Occurrence in an Urban Than a Suburban Area: Role of House Dust Mite Skin Allergy,” European Res- piratory Journal, Vol. 10, No. 7, 1997, pp. 1460-1466. doi:10.1183/09031936.97.10071460 [26] M. H. Wieringa, J. J. Weyler, V. J Nelen, K. J Van Hoof, F. J. Van Bastelaer, M. P. Van Spnindel and P. A. Ver- meire, “Prevalence of Respiratory Symptoms: Marked Differences within a Small Geographical Area,” Interna- tional Journal of Epidemiology, Vol. 27, No. 4, 1998, pp. 630-635. |