

Paper Menu >>
Journal Menu >>
 American Journal of Analytical Chemistry, 2011, 2, 619-625 doi:10.4236/ajac.2011.25070 Published Online September 2011 (http://www.SciRP.org/journal/ajac) Copyright © 2011 SciRes. AJAC On a New Mechanism for Separating two Components in a Stationary Flow through Mesopores Harald Morgner Wilhelm Ostwald Institute for Physical and Th eoretical Chemistry, University Leipzig, Leipzig, Germany E-mail: [email protected] Received February 24, 2011; revised April 6, 2011; accepted July 11, 2011 Abstract When simulating the behavior of fluids in a stationary flow through mesopores we have observed a phe- nomenon that may prove useful in some cases as basis for separating fluid components. The scheme works at constant temperature which makes it energy efficient as are other schemes like (molecular) sieves or chro- matography. Sieves rely on differences in molecular size and chromatography on different affinity of com- ponents to the solid material of the ‘packing’. The scheme presented here may sometimes complement the established techniques in that it is based on a different mechanism. The fluids to be separated can have the same molecular size and the same affinity to solid material they are in contact with. The only requirement for the scheme to work is that the miscibility behavior varies somewhat with pressure or density. From literature it is known that virtually any mixture reacts on strong variations of pressure. Even a mixture that behaves almost ideally at ambient pressure will show slight deviations from ideal miscibility when exposed to ex- treme pressure. The strong differences in pressure are not created by external means but by exploiting the spontaneous behavior of fluids in mesopores. If the experiment is designed correctly, strong pressure gradi- ents show up in mesopores that are far beyond any gradient that could be established by technical means. Our simulations are carried out for situations where pressure inside the pores varies between a few hundred bar positive pressure and a few hundred bar negative pressure while the pressure in the gas phase outside the pores amounts to ca.170 mbar. Keywords: Fluids in Mesopores, Negative Pressure States, Pressure Dependence of Miscibility 1. Introduction It is common knowledge that the vapor of a fluid may condense in mesopores even if the pressure of the gas reservoir is below the saturation pressure at the given temperature. It further is known that the density of the liquid formed in the pores is somewhat smaller than of the liquid under normal conditions at equilibrium. Thus, the situation of capillary condensation leads to so called ‘expanded’ liquids [1]. The related pressure in the liquid is not only small, but usually takes on even negative values. The occurrence of negative pressure in the pore turns out to be of importance for the phenomenon that we propose to employ for separation purposes. Negative pressure states in macroscopic systems have been ob- served long before by Torricelli and by Huygens, but are still today subject to investigations [2,3]. Recently, we have studied a fluid in a mesopore with two open ends, cf. upper panel of Figure 1. The bound- ary conditions were chosen so as to bring the system into a state pertaining to the curve of states COS(), i.e. to create a liquid in the pore. Usually, such a system is studied experimentally and by simulation with equal pressure in both gas reservoirs. We found that the liquid structure with negative pressure persists even, if a slight difference in gas pressure is applied between both gas reservoirs [4]. The fluid flows through the system, leav- ing the structure of the liquid phase in the pore unaf- fected. This stationary state remains stable over a range of pressure differences between both gas reservoirs [5], cf. Figure 2. So far we have not found an upper limit for the pres- sure difference. The flow does not affect noticeably the pressure profile in the pore compared to the equilibrium state. It is shown in Figure 3. A further observation has been made when a second 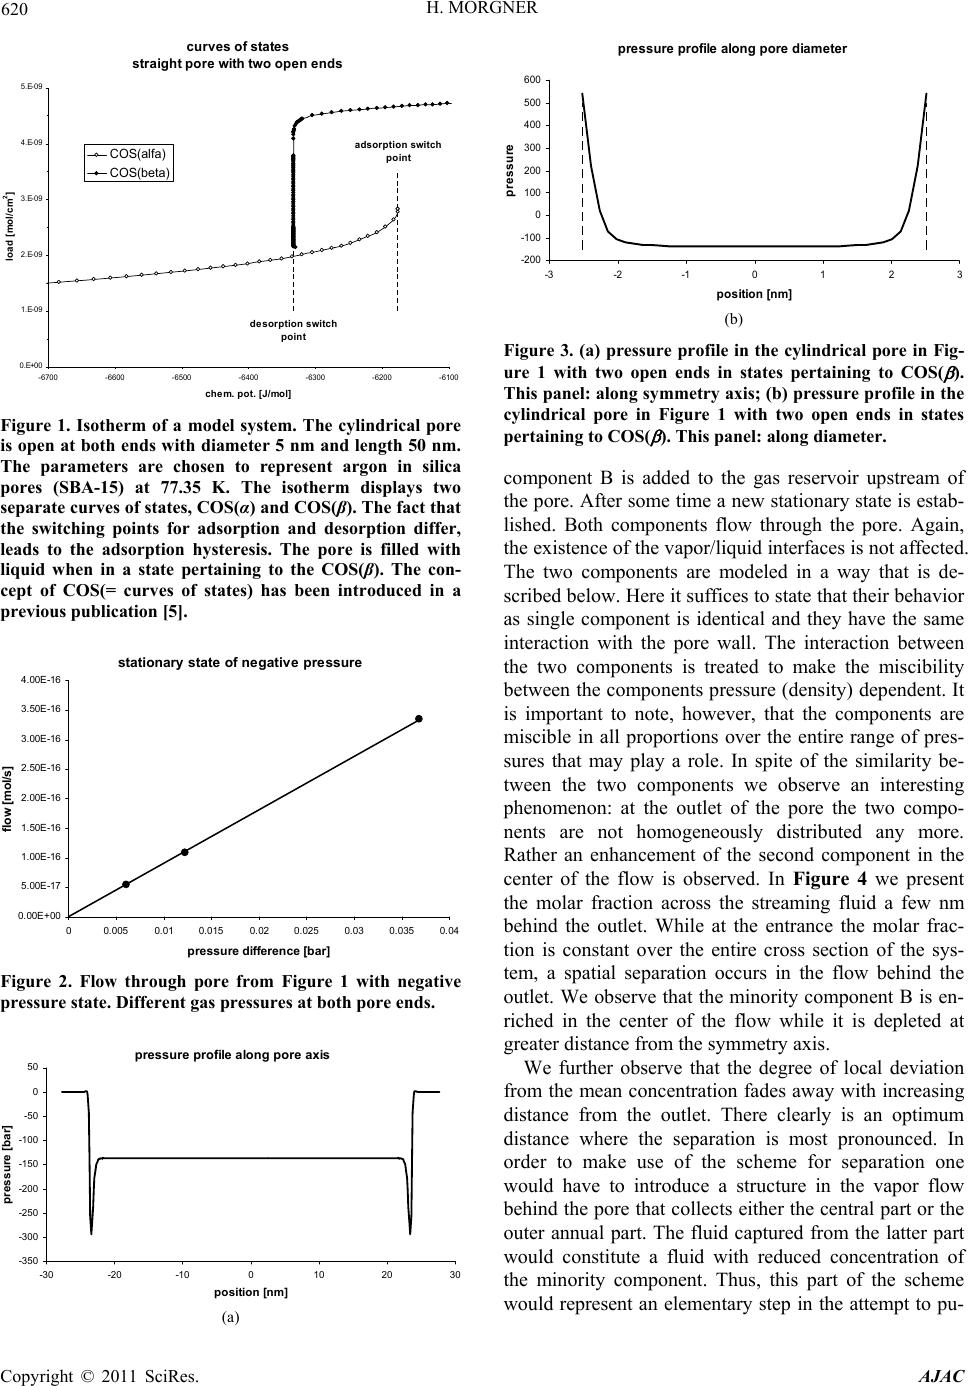 620 H. MORGNER curves of s tates straight pore with two open ends de sorption switch point adsorption switch point 0.E+00 1.E-09 2.E-09 3.E-09 4.E-09 5.E-09 -6700 -6600 -6500 -6400 -6300 -6200 -6100 chem. pot. [J/mol] load [ mol/cm 2 ] COS(alfa) COS(beta) Figure 1. Isotherm of a model system. The cylindrical pore is open at both ends with diameter 5 nm and length 50 nm. The parameters are chosen to represent argon in silica pores (SBA-15) at 77.35 K. The isotherm displays two separate curves of states, COS(α) and COS(β). The fact that the switching points for adsorption and desorption differ, leads to the adsorption hysteresis. The pore is filled with liquid when in a state pertaining to the COS(β). The con- cept of COS(= curves of states) has been introduced in a previous publication [5]. stationary state of negative pressure 0. 00 E+00 5.00E-17 1.00E-16 1.50E-16 2.00E-16 2.50E-16 3.00E-16 3.50E-16 4.00E-16 00.0050.01 0.0150.020.025 0.03 0.035 0.04 pressure di ff er ence [bar] flow [mol /s] Figure 2. Flow through pore from Figure 1 with negative pressure state. Different gas pressures at both pore ends. pressure profile along pore axis -350 -300 -250 -200 -150 -100 -50 0 50 -30 -20 -100102030 position [nm] pres sure [bar] (a) pressure profile along pore diameter -200 -100 0 100 200 300 400 500 600 -3-2-10 12 3 position [nm] pressure (b) Figure 3. (a) pressure profile in the cylindrical pore in Fig- ure 1 with two open ends in states pertaining to COS( ). This panel: along symmetry axis; (b) pressure profile in the cylindrical pore in Figure 1 with two open ends in states pertaining to COS( ). This panel: along diameter. component B is added to the gas reservoir upstream of the pore. After some time a new stationary state is estab- lished. Both components flow through the pore. Again, the existence of the vapor/liquid interfaces is not affected. The two components are modeled in a way that is de- scribed below. Here it suffices to state that their behavior as single component is identical and they have the same interaction with the pore wall. The interaction between the two components is treated to make the miscibility between the components pressure (density) dependent. It is important to note, however, that the components are miscible in all proportions over the entire range of pres- sures that may play a role. In spite of the similarity be- tween the two components we observe an interesting phenomenon: at the outlet of the pore the two compo- nents are not homogeneously distributed any more. Rather an enhancement of the second component in the center of the flow is observed. In Figure 4 we present the molar fraction across the streaming fluid a few nm behind the outlet. While at the entrance the molar frac- tion is constant over the entire cross section of the sys- tem, a spatial separation occurs in the flow behind the outlet. We observe that the minority component B is en- riched in the center of the flow while it is depleted at greater distance from the symmetry axis. We further observe that the degree of local deviation from the mean concentration fades away with increasing distance from the outlet. There clearly is an optimum distance where the separation is most pronounced. In order to make use of the scheme for separation one would have to introduce a structure in the vapor flow behind the pore that collects either the central part or the outer annual part. The fluid captured from the latter part would constitute a fluid with reduced concentration of the minority component. Thus, this part of the scheme would represent an elementary step in the attempt to pu- Copyright © 2011 SciRes. AJAC 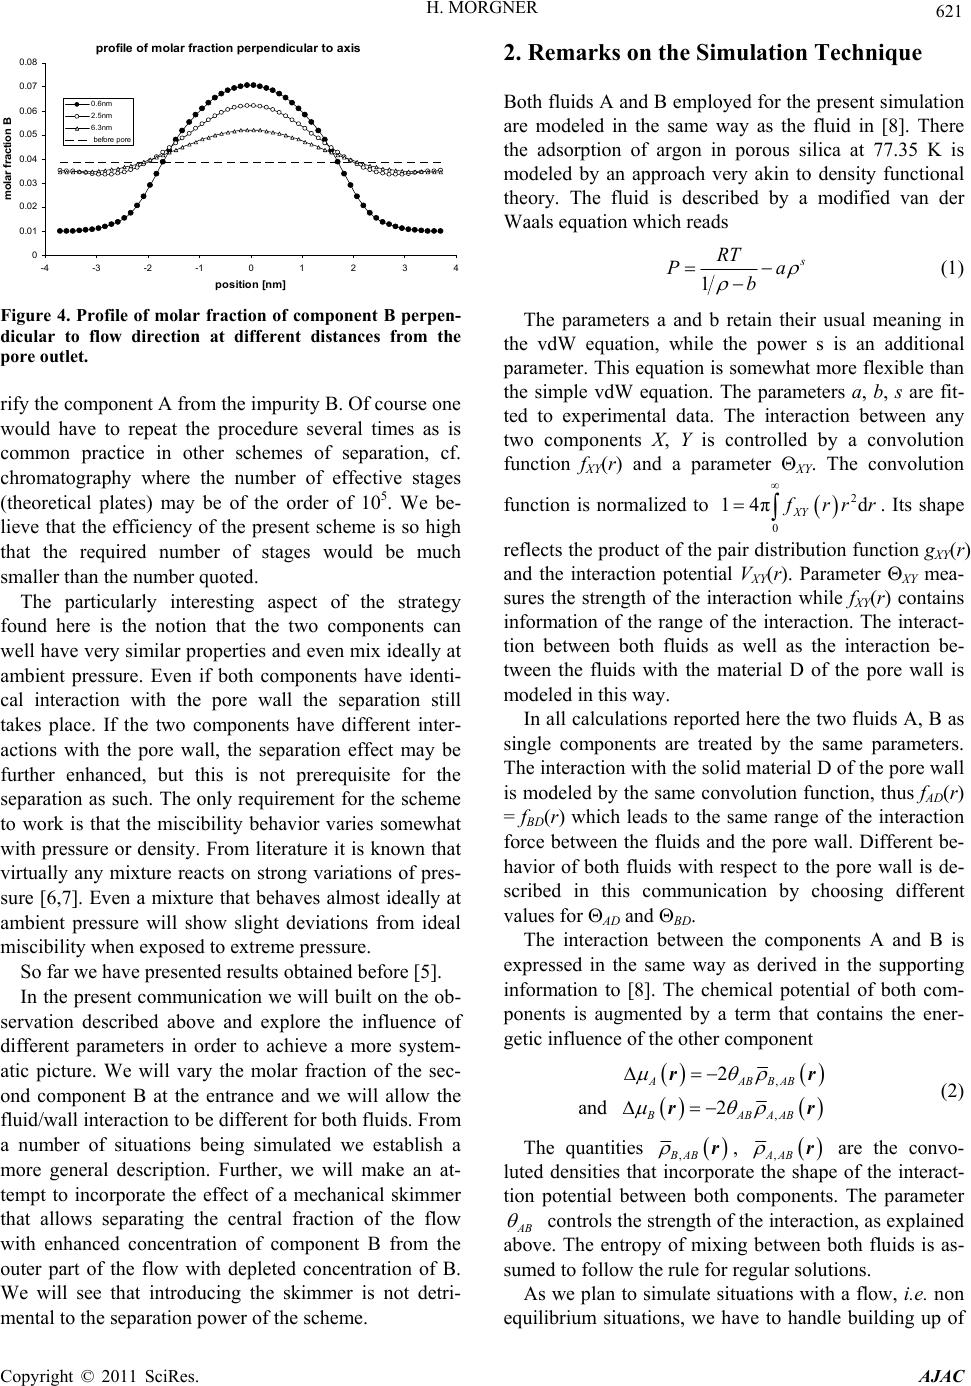 H. MORGNER 621 profile of molar fraction perpendicular to axis 0 0.01 0.02 0.03 0.04 0.05 0.06 0.07 0.08 -4-3-2-101234 position [nm] mol ar f ract ion B 0.6nm 2.5nm 6.3nm before pore Figure 4. Profile of molar fraction of component B perpen- dicular to flow direction at different distances from the pore outlet. rify the component A from the impurity B. Of course one would have to repeat the procedure several times as is common practice in other schemes of separation, cf. chromatography where the number of effective stages (theoretical plates) may be of the order of 105. We be- lieve that the efficiency of the present scheme is so high that the required number of stages would be much smaller than the number quoted. The particularly interesting aspect of the strategy found here is the notion that the two components can well have very similar properties and even mix ideally at ambient pressure. Even if both components have identi- cal interaction with the pore wall the separation still takes place. If the two components have different inter- actions with the pore wall, the separation effect may be further enhanced, but this is not prerequisite for the separation as such. The only requirement for the scheme to work is that the miscibility behavior varies somewhat with pressure or density. From literature it is known that virtually any mixture reacts on strong variations of pres- sure [6,7]. Even a mixture that behaves almost ideally at ambient pressure will show slight deviations from ideal miscibility when exposed to extreme pressure. So far we have presented results obtained before [5]. In the present communication we will built on the ob- servation described above and explore the influence of different parameters in order to achieve a more system- atic picture. We will vary the molar fraction of the sec- ond component B at the entrance and we will allow the fluid/wall interaction to be different for both fluids. From a number of situations being simulated we establish a more general description. Further, we will make an at- tempt to incorporate the effect of a mechanical skimmer that allows separating the central fraction of the flow with enhanced concentration of component B from the outer part of the flow with depleted concentration of B. We will see that introducing the skimmer is not detri- mental to the separation power of the scheme. 2. Remarks on the Simulation Technique Both fluids A and B employed for the present simulation are modeled in the same way as the fluid in [8]. There the adsorption of argon in porous silica at 77.35 K is modeled by an approach very akin to density functional theory. The fluid is described by a modified van der Waals equation which reads 1 s RT P ba (1) The parameters a and b retain their usual meaning in the vdW equation, while the power s is an additional parameter. This equation is somewhat more flexible than the simple vdW equation. The parameters a, b, s are fit- ted to experimental data. The interaction between any two components X, Y is controlled by a convolution function fXY(r) and a parameter XY. The convolution function is normalized to 2 0 14πd XY f rr r . Its shape reflects the product of the pair distribution function gXY(r) and the interaction potential VXY(r). Parameter XY mea- sures the strength of the interaction while fXY (r) contains information of the range of the interaction. The interact- tion between both fluids as well as the interaction be- tween the fluids with the material D of the pore wall is modeled in this way. In all calculations reported here the two fluids A, B as single components are treated by the same parameters. The interaction with the solid material D of the pore wall is modeled by the same convolution function, thus fAD(r) = fBD(r) which leads to the same range of the interaction force between the fluids and the pore wall. Different be- havior of both fluids with respect to the pore wall is de- scribed in this communication by choosing different values for AD and BD. The interaction between the components A and B is expressed in the same way as derived in the supporting information to [8]. The chemical potential of both com- ponents is augmented by a term that contains the ener- getic influence of the other component , , 2 and 2 AABBAB BABAAB rr rr (2) The quantities ,BAB r, ,AAB r are the convo- luted densities that incorporate the shape of the interact- tion potential between both components. The parameter AB controls the strength of the interaction, as explained above. The entropy of mixing between both fluids is as- sumed to follow the rule for regular solutions. As we plan to simulate situations with a flow, i.e. non equilibrium situations, we have to handle building up of Copyright © 2011 SciRes. AJAC 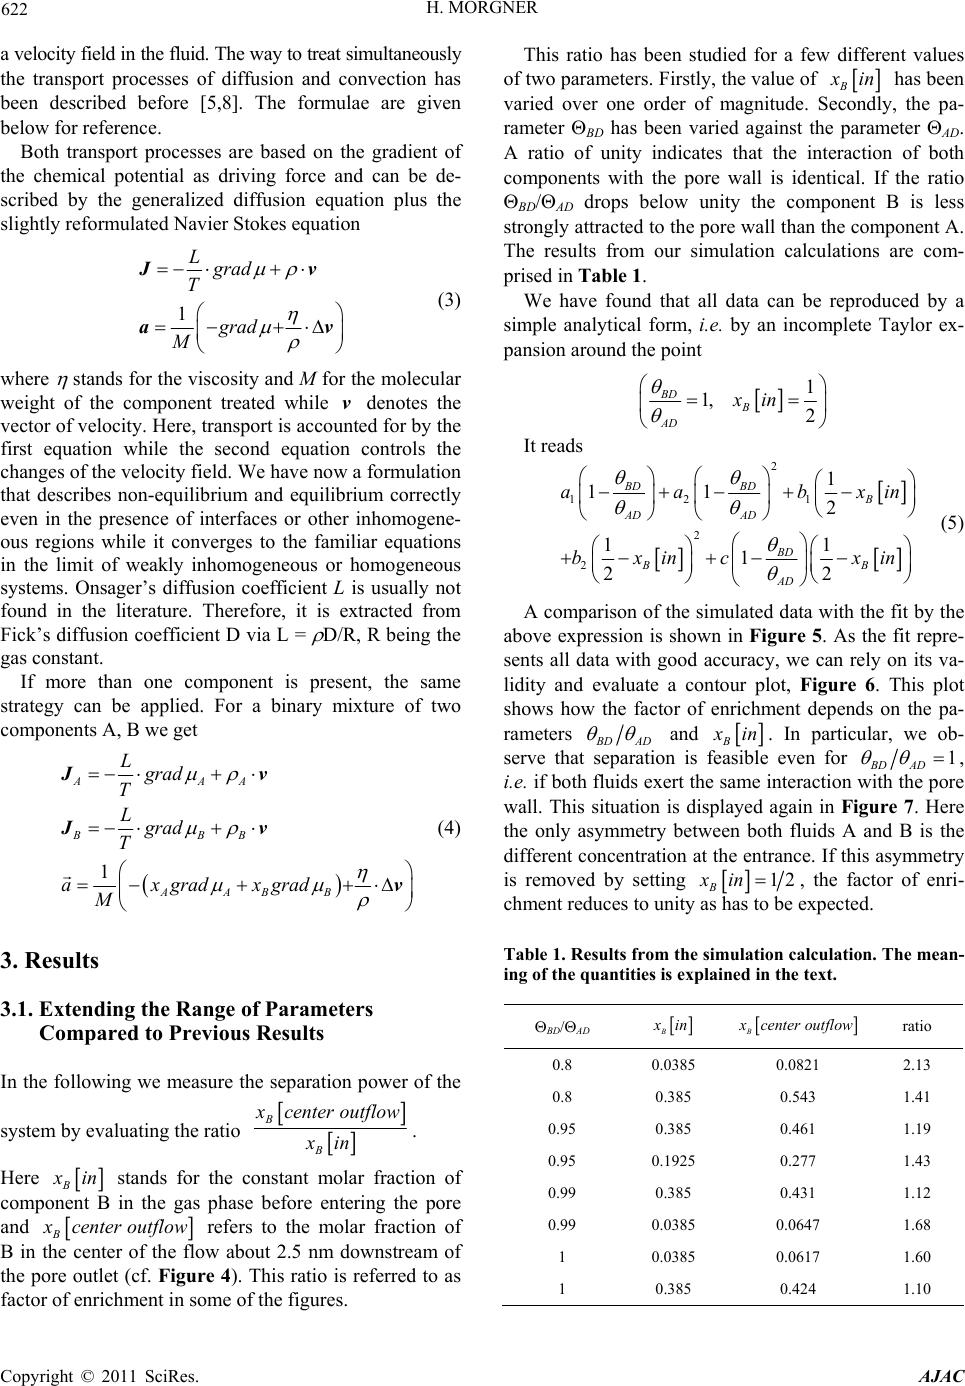 622 H. MORGNER a velocity field in the fluid. The way to treat simultaneously the transport processes of diffusion and convection has been described before [5,8]. The formulae are given below for reference. Both transport processes are based on the gradient of the chemical potential as driving force and can be de- scribed by the generalized diffusion equation plus the slightly reformulated Navier Stokes equation 1 Lgrad T grad M Jv a v (3) where stands for the viscosity and M for the molecular weight of the component treated while denotes the vector of velocity. Here, transport is accounted for by the first equation while the second equation controls the changes of the velocity field. We have now a formulation that describes non-equilibrium and equilibrium correctly even in the presence of interfaces or other inhomogene- ous regions while it converges to the familiar equations in the limit of weakly inhomogeneous or homogeneous systems. Onsager’s diffusion coefficient L is usually not found in the literature. Therefore, it is extracted from Fick’s diffusion coefficient D via L = D/R, R being the gas constant. v If more than one component is present, the same strategy can be applied. For a binary mixture of two components A, B we get 1 AAA BBB AABB Lgrad T Lgrad T ax gradx grad M Jv Jv v (4) 3. Results 3.1. Extending the Range of Parameters Compared to Previous Results In the following we measure the separation power of the system by evaluating the ratio B B x centeroutflow xin . Here B x in stands for the constant molar fraction of component B in the gas phase before entering the pore and B x center outflow refers to the molar fraction of B in the center of the flow about 2.5 nm downstream of the pore outlet (cf. Figure 4). This ratio is referred to as factor of enrichment in some of the figure This ratio has been studied for a few different values of two parameters. Firstly, the value of B x in has been varied over one order of magnitude. Secondly, the pa- rameter BD has been varied against the parameter AD. A ratio of unity indicates that the interaction of both components with the pore wall is identical. If the ratio BD/AD drops below unity the component B is less strongly attracted to the pore wall than the component A. The results from our simulation calculations are com- prised in Table 1. We have found that all data can be reproduced by a simple analytical form, i.e. by an incomplete Taylor ex- pansion around the point 1 1, 2 BD B AD xin It reads 2 12 1 2 2 1 11 2 11 1 22 BD BDB AD AD BD BB AD aa bx bx incx in in (5) A comparison of the simulated data with the fit by the above expression is shown in Figure 5. As the fit repre- sents all data with good accuracy, we can rely on its va- lidity and evaluate a contour plot, Figure 6. This plot shows how the factor of enrichment depends on the pa- rameters B DAD and B x in . In particular, we ob- serve that separation is feasible even for 1 BD AD , i.e. if both fluids exert the same interaction with the pore wall. This situation is displayed again in Figure 7. Here the only asymmetry between both fluids A and B is the different concentration at the entrance. If this asymmetry is removed by setting 12 B xin, the factor of enri- chment reduces to unity as has to be expected. Table 1. Results from the simulation calculation. The mean- ing of the quantities is explained in the text. BD/AD B x in B x center outflow ratio 0.8 0.0385 0.0821 2.13 0.8 0.385 0.543 1.41 0.95 0.385 0.461 1.19 0.95 0.1925 0.277 1.43 0.99 0.385 0.431 1.12 0.99 0.0385 0.0647 1.68 1 0.0385 0.0617 1.60 1 0.385 0.424 1.10 s. Copyright © 2011 SciRes. AJAC 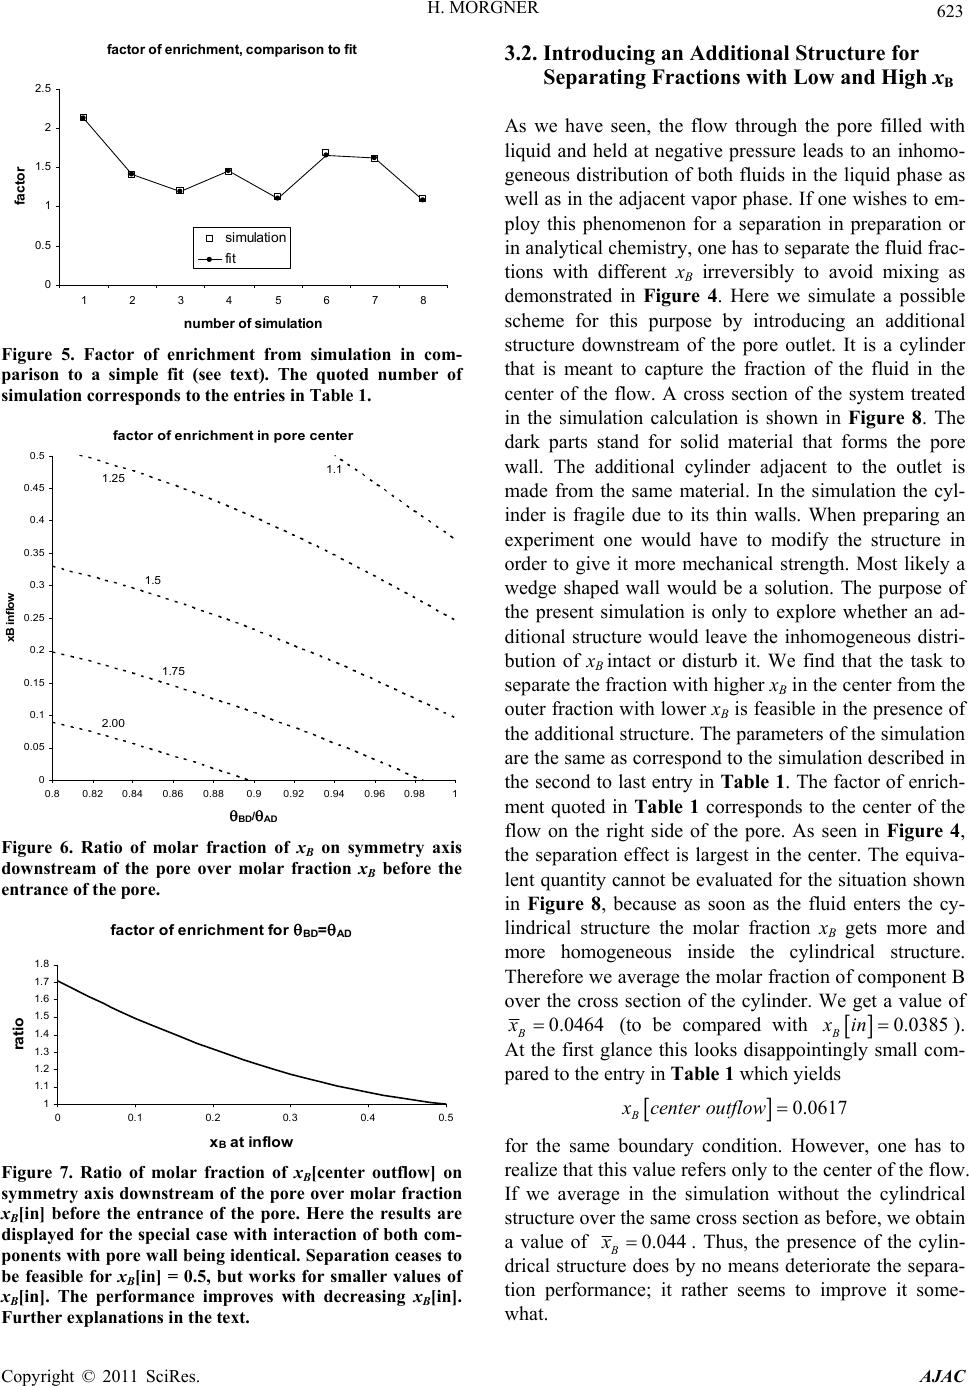 H. MORGNER 623 fa ct or of e nr i c hm ent , com par is on t o fit 0 0.5 1 1.5 2 2.5 12345678 number of si m ulati on facto r simulation fit Figure 5. Factor of enrichment from simulation in com- parison to a simple fit (see text). The quoted number of simulation corresponds to the entries in Table 1. f actor of enrichment in pore center 1.25 1.5 1.75 2.00 1.1 0 0.05 0.1 0.15 0.2 0.25 0.3 0.35 0.4 0.45 0.5 0.80.820.84 0.860.880.90.920.940.960.981 BD / AD xB infl ow Figure 6. Ratio of molar fraction of xB on symmetry axis downstream of the pore over molar fraction xB before the entrance of the pore. f acto r of enri ch m ent for BD = AD 1 1.1 1.2 1.3 1.4 1.5 1.6 1.7 1.8 00.1 0.2 0.3 0.4 0.5 x B at inflow rati o Figure 7. Ratio of molar fraction of xB[center outflow] on symmetry axis downstream of the pore over molar fraction xB[in] before the entrance of the pore. Here the results are displayed for the special case with interaction of both com- ponents with pore wall being ide ntical. Separation ceases to be feasible for xB[in] = 0.5, but works for smaller values of xB[in]. The performance improves with decreasing xB[in]. Further explanations in the text. 3.2. Introducing an Additional Structure for Separating Fractions with Low and High xB As we have seen, the flow through the pore filled with liquid and held at negative pressure leads to an inhomo- geneous distribution of both fluids in the liquid phase as well as in the adjacent vapor phase. If one wishes to em- ploy this phenomenon for a separation in preparation or in analytical chemistry, one has to separate the fluid frac- tions with different xB irreversibly to avoid mixing as demonstrated in Figure 4. Here we simulate a possible scheme for this purpose by introducing an additional structure downstream of the pore outlet. It is a cylinder that is meant to capture the fraction of the fluid in the center of the flow. A cross section of the system treated in the simulation calculation is shown in Figure 8. The dark parts stand for solid material that forms the pore wall. The additional cylinder adjacent to the outlet is made from the same material. In the simulation the cyl- inder is fragile due to its thin walls. When preparing an experiment one would have to modify the structure in order to give it more mechanical strength. Most likely a wedge shaped wall would be a solution. The purpose of the present simulation is only to explore whether an ad- ditional structure would leave the inhomogeneous distri- bution of xB intact or disturb it. We find that the task to separate the fraction with higher xB in the center from the outer fraction with lower xB is feasible in the presence of the additional structure. The parameters of the simulation are the same as correspond to the simulation described in the second to last entry in Tab le 1. The factor of enrich- ment quoted in Table 1 corresponds to the center of the flow on the right side of the pore. As seen in Figure 4, the separation effect is largest in the center. The equiva- lent quantity cannot be evaluated for the situation shown in Figure 8, because as soon as the fluid enters the cy- lindrical structure the molar fraction xB gets more and more homogeneous inside the cylindrical structure. Therefore we average the molar fraction of component B over the cross section of the cylinder. We get a value of 0.0464 B x (to be compared with 0.0385 B xin). At the first glance this looks disappointingly small com- pared to the entry in Table 1 which yields 0.0617 B xcenter outflow for the same boundary condition. However, one has to realize that this value refers only to the center of the flow. If we average in the simulation without the cylindrical structure over the same cross section as before, we obtain a value of 0.044 B x . Thus, the presence of the cylin- drical structure does by no means deteriorate the separa- tion performance; it rather seems to improve it some- what. Copyright © 2011 SciRes. AJAC 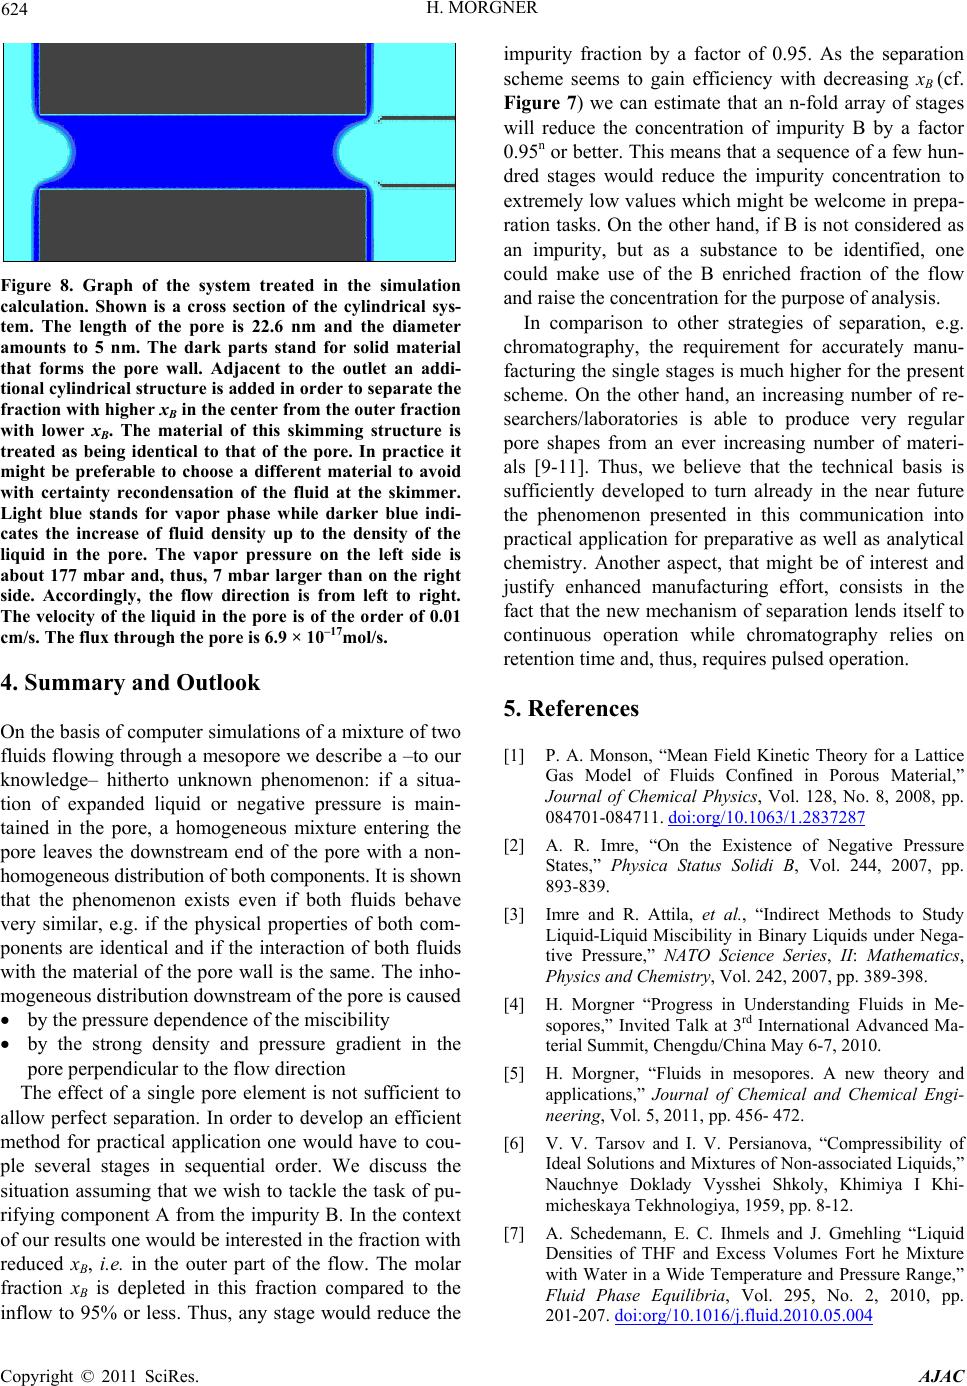 624 H. MORGNER Figure 8. Graph of the system treated in the simulation calculation. Shown is a cross section of the cylindrical sys- tem. The length of the pore is 22.6 nm and the diameter amounts to 5 nm. The dark parts stand for solid material that forms the pore wall. Adjacent to the outlet an addi- tional cylindrical structure is added in order to separate the fraction with higher xB in the center from the outer fraction with lower xB. The material of this skimming structure is treated as being identical to that of the pore. In practice it might be preferable to choose a different material to avoid with certainty recondensation of the fluid at the skimmer. Light blue stands for vapor phase while darker blue indi- cates the increase of fluid density up to the density of the liquid in the pore. The vapor pressure on the left side is about 177 mbar and, thus, 7 mbar larger than on the right side. Accordingly, the flow direction is from left to right. The velocity of the liquid in the pore is of the order of 0.01 cm/s. The flux through the pore is 6.9 × 10⁻¹⁷mol/s. 4. Summary and Outlook On the basis of computer simulations of a mixture of two fluids flowing through a mesopore we describe a –to our knowledge– hitherto unknown phenomenon: if a situa- tion of expanded liquid or negative pressure is main- tained in the pore, a homogeneous mixture entering the pore leaves the downstream end of the pore with a non- homogeneous distribution of both components. It is shown that the phenomenon exists even if both fluids behave very similar, e.g. if the physical properties of both com- ponents are identical and if the interaction of both fluids with the material of the pore wall is the same. The inho- mogeneous distribution downstream of the pore is caused by the pressure dependence of the miscibility by the strong density and pressure gradient in the pore perpendicular to the flow direction The effect of a single pore element is not sufficient to allow perfect separation. In order to develop an efficient method for practical application one would have to cou- ple several stages in sequential order. We discuss the situation assuming that we wish to tackle the task of pu- rifying component A from the impurity B. In the context of our results one would be interested in the fraction with reduced xB, i.e. in the outer part of the flow. The molar fraction xB is depleted in this fraction compared to the inflow to 95% or less. Thus, any stage would reduce the impurity fraction by a factor of 0.95. As the separation scheme seems to gain efficiency with decreasing xB (cf. Figure 7) we can estimate that an n-fold array of stages will reduce the concentration of impurity B by a factor 0.95n or better. This means that a sequence of a few hun- dred stages would reduce the impurity concentration to extremely low values which might be welcome in prepa- ration tasks. On the other hand, if B is not considered as an impurity, but as a substance to be identified, one could make use of the B enriched fraction of the flow and raise the concentration for the purpose of analysis. In comparison to other strategies of separation, e.g. chromatography, the requirement for accurately manu- facturing the single stages is much higher for the present scheme. On the other hand, an increasing number of re- searchers/laboratories is able to produce very regular pore shapes from an ever increasing number of materi- als [9-11]. Thus, we believe that the technical basis is sufficiently developed to turn already in the near future the phenomenon presented in this communication into practical application for preparative as well as analytical chemistry. Another aspect, that might be of interest and justify enhanced manufacturing effort, consists in the fact that the new mechanism of separation lends itself to continuous operation while chromatography relies on retention time and, thus, requires pulsed operation. 5. References [1] P. A. Monson, “Mean Field Kinetic Theory for a Lattice Gas Model of Fluids Confined in Porous Material,” Journal of Chemical Physics, Vol. 128, No. 8, 2008, pp. 084701-084711. doi:org/10.1063/1.2837287 [2] A. R. Imre, “On the Existence of Negative Pressure States,” Physica Status Solidi B, Vol. 244, 2007, pp. 893-839. [3] Imre and R. Attila, et al., “Indirect Methods to Study Liquid-Liquid Miscibility in Binary Liquids under Nega- tive Pressure,” NATO Science Series, II: Mathematics, Physics and Chemistry, Vol. 242, 2007, pp. 389-398. [4] H. Morgner “Progress in Understanding Fluids in Me- sopores,” Invited Talk at 3rd International Advanced Ma- terial Summit, Chengdu/China May 6-7, 2010. [5] H. Morgner, “Fluids in mesopores. A new theory and applications,” Journal of Chemical and Chemical Engi- neering, Vol. 5, 2011, pp. 456- 472. [6] V. V. Tarsov and I. V. Persianova, “Compressibility of Ideal Solutions and Mixtures of Non-associated Liquids,” Nauchnye Doklady Vysshei Shkoly, Khimiya I Khi- micheskaya Tekhnologiya, 1959, pp. 8-12. [7] A. Schedemann, E. C. Ihmels and J. Gmehling “Liquid Densities of THF and Excess Volumes Fort he Mixture with Water in a Wide Temperature and Pressure Range,” Fluid Phase Equilibria, Vol. 295, No. 2, 2010, pp. 201-207. doi:org/10.1016/j.fluid.2010.05.004 Copyright © 2011 SciRes. AJAC  H. MORGNER Copyright © 2011 SciRes. AJAC 625 [8] H. Morgner, “Computer Simulation on Static and Dy- namic Properties during Transient Sorption of Fluids in Mesoporous Materials,” The Journal of Physical Chem- istry C, Vol. 114, 2010, pp. 8877-83. doi:org/10.1021/jp903717b [9] M. B. Yue, W. Q. Jiao, Y. M. Wanga and M.-Y. He, “CTAB-Directed Synthesis of Mesoporous Calumina Promoted by Hydroxy Polyacids,” Microporous and Mesoporous Mate rials, Vol. 132, No. 2, 2010, pp. 226- 231. doi:org/10.1016/j.micromeso.2010.03.002 [10] J. X. Jiang, J. H. Yu and A. Corma, “Extra-Large-Pore Zeolites: Bridging the Gap between Micro and Mesopor- ous Structures,” Angewwandte Chemie International Edi- tion, Vol. 49, No. 18, 2010, pp. 3120-3145. doi:org/10.1002/anie.200904016 [11] B. Lorenzo, M. Giampaolo, L. F. Liu, L. Woo, G. Ulrich and C. Benoit, “Capillary Condensation and Evaporation in Alumina Nanopores with Controlled Modulations,” Langmuir, Vol. 26, 2010, pp. 11894-11898. doi:org/10.1021/la1011082 |