

Paper Menu >>
Journal Menu >>
 Modern Economy, 2011, 2, 584-588 doi:10.4236/me.2011.24065 Published Online September 2011 (http://www.SciRP.org/journal/me) Copyright © 2011 SciRes. ME On a Theme by Williamson: A Stochastic Model for the Evolution of Global Labor Markets since 1830 Fariba Hashemi Swiss Federal Institute of Technology, Lausanne, Switzerland E-mail: [email protected] Received June 14, 20 11; revised July 22, 2011; accepted August 1, 2011 Abstract The cross-sectional distribution of wages has so far been neglected compared to the study of income differ- ences across countries over time. We propose a stochastic model, building on the theory of diffusion pro- cesses, in order to describe the evolution of global labor markets since 1830. The model is applied to em- pirical data collected by Williamson, in order to describe the level and the variation of wages for 15 countries. The empirical application validates the proposed method. Keywords: Evolution of Global Labor Markets, Spatial Dynamics, Stochastic Analysis 1. Introduction The economics literature is rich with studies which ex- amine wage differentials across countries over time. The dynamics in the cross-sectional distribution of wages have been relatively neglected however. The main ob jec- tive of this paper is to examine the disequilibrium pro- cess of wage adjustment in face of an exogenous shock. We hypothesize that the growth distribution of wages can be generated by a single stochastic process that builds upon the theory of diffusion. A drift-diffusion model is proposed which describes the dynamics of cross-sectional distribution of real wages. The dynamics of the model are governed by the speed of diffusion of knowledge, the mobility o f capital and lab or, and decline in transportation costs which come along with integration and globalization. An empirical application of the pro- posed model to the level and variation of real wages using data collected by Williamson for 1 5 co untries from 1830 - 1988 tests the validity of th e metho d. 2. Theoretical Framework In a classic study of global labor markets, Jeffrey Willi- amson [1] explores the debate over the economic con- vergence of currently industrialized nations and high- lights a number of shortcomings which include limita- tions in data availability. Williamson offers a new data base consisting of purchasing-power-parity-adjusted real wage rates for unskilled labor. The new data base has several advantages over the standard GNP estimates, as factor prices generally, and real wages specifically, are likely more suitable measures for the analysis of econo- mic performance and standards of living. This difference becomes significant und er condition s of incomplete co m- modity price equalization. Moreover, labor participation rates differ across space and over time in an environment of migration and differential rates of population growth. Both these considerations hold true with greater strength the farther back in history we look. This paper explores the dynamics in the evolving dis- tribution of real wages across Williamson’s data. Willi- amson describes his data via four ‘regimes’. We explore whether there is an equilibrium distribution of wages in general and to what extent it is ‘regime’ dependent. Our picture of world development is one where some econo- mic forces push in the direction of convergence whilst other forces are divergent. Globalization typically rein- forces the convergent trend through the flow of capital towards capital poor economies and through trade- induced factor price equalization. At the same time, a decline in transportation costs, and faster population growth lead to divergence [2-5]. Con sistent with this ob- servation, a model is proposed to describe the fluctu- ations over time in the density of cross-sectional distri- bution of real wages. It is hypothesized that these flows follow simple stochastic laws that can be described with five param e t er s 1. 1Our study is in the spirit of probabilistic models which study city and firm sizes [6-8]. Our suggestion is that these models could provide interesting insights, if applied to the spatial dynamics of real wages as well.  F. HASHEMI585 Consider a region consisting of a constant number of countries with different levels of wages. The set of wages forms a distribution which evolves over time. Fierce competition in labor markets generates some sta- tionary equilibrium distribution of real wages with a cer- tain mean and variance, towards which the ensemble of countries considered tend. The equilibrium is a result of tension between counteracting forces of convergence and divergence. Convergence is a result of adjustment of capital-labor ratios to common steady-state levels, starting from different initial values [9,10]. Call this the drift spread, driven by diminishing returns to capital. A counteracting diffusion spread is at work, driven by bottlenecks in the flow of labor and capital and by random effects, which cause a spread of wages from high density towards lower density. Diffusion of knowledge and learning [11-16] is limited by the presence of obstacles in the form of trade barriers and the like. Consistent with the above, the following drift-diffu- sion model is proposed to express the wage adjustment process with noise, describing diffusion of shocks across space: 2 2 f f usf ts s where f denotes probability density, denotes the mean of the stationary equilibrium distribution, u s de- notes wages, the wage adjustment rate, and a di- ffusion parameter2. 3. Empirical Analysis The empirical analysis uses Williamson’s data [1] which consists of purchasing power parity adjusted real wage rates for unskilled labo r recorded from 1830 - 1988. The data is for the following 15 countries3: Argentina, Aus- tralia, Belgium, Canada, Denmark, France, Great Britain, Germany, Ireland, Italy, Netherlands, Norway, Spain, Sweden and USA. The evidence presented by Williamson suggests that there have been four distinct global labor market ‘regi- mes’ since 1830. In this paper, we adopt Williamson’s four regimes: (1) 1830-1869, (2) 1870-1913, (3) 1914- 1945, and (4) 1946-1988. The first is associated with early industrialization in Belgium, Denmark, France, Great Britain, Germany, Ireland, Italy, Netherlands, No r- way, Spain and Sweden, settlement in Australia, Argen- tina, Canada and the United States, international migra- tions, high transport costs on commodity trade, and ba- rriers to trade. The second covers the age of industria- lization and free international migration, the Victorian boom amidst an age of imperialism, and a general world boom under free trade and the gold standard. The third covers the two World Wars and the interwar period when world commodity and factor markets break down. The fourth is the po s t W orl d Wa r II period. The evolution of the distribution of real wages for the 15 countries across the four time periods has been investigated. Table 1 reports the descriptive of the four phases (regi mes). It can be observed that in general, real wages rose sharply, especially in regime 4. At the same time, the distribution of real wages became more heterogeneous. Table 1 reports a lower mean wage (M = 58.28) as com- pared with the reported mean wage of Phase 2 (M = 90.95), Phase 3 (M = 124.38), and Phase 4 (M = 280 .49) . However, although Phase 1 displays a lower mean, it dis- plays less fluctuations, suggesting a relatively stable labor market. In what follows, we test the reliance of these developments on five parameters: the initial mean wage 0, the initial standard deviation 0 u , the mean wage at stationary equilibrium , the velocity of con- vergence to stationary equilibrium u , and the diffusion parameter . 3.1. Estimation The model has been fitted to the log real wage distri- bution of the four populations as a function of time, using the non-linear least-squares estimation using a two-step procedure. First, the values for 0, and uu were estimated using the first moment of the distribution. In the second step, the values for and 0 were computed using the second moment. Tables 2-5 report estimates for the five model parameters, along with the standard errors and t-values for the four phases respec- tively. Table 1. Descriptive of the four Phases. N MinimumMaximum Mean Std. Deviation Phase 14048.38 67.58 58.28 4.02 Phase 24464.93 126.67 90.95 15.96 Phase 32591.93 141.47 124.38 15.99 Phase 443144.23 417.53 280.49 97.60 Table 2. Phase 1 Parameter estimates. Parameter Value Std Error t-value λ 1.24 1.02 0.02 u 1.27 0.03 3.43 u0 1.15 0.03 5.31 σ0 1.07 0.04 2.31 ε 0.57 0.05 4.53 2For an elaboration of this model see [17-21] and the Appendix. 3Williamson [1] reports data for 11 countries. We are grateful to Wil- liamson for data on the remaining countries, which were collected and received post-publication. Copyright © 2011 SciRes. ME  F. HASHEMI 586 Table 3. Phase 2 Parameter estimates. Parameter Value Std Error t-value λ 1.64 1.06 0.59 u 1.56 0.03 0.85 u0 1.30 0.03 15.52 σ0 1.16 0.04 15.12 ε 0.63 0.05 3.12 Table 4. Phase 3 Parameter estimates. Parameter Value Std Error t-value λ 1.78 0.76 0.05 u 1.92 0.03 3.34 u0 1.97 0.03 7.93 σ0 1.65 0.03 5.23 ε 1.03 0.04 3.37 Table 5. Phase 4 Parameter estimates. Parameter Value Std Error t-value λ 2.09 2.08 0.08 u 2.32 1.04 6.00 u0 2.13 0.04 7.10 σ0 1.95 0.04 4.06 ε 1.25 0.04 5.67 It can be observed that the parameter estimates con- form to the real data presented in the descriptive analysis. Phase 1 displays the smallest estimate for wages as compared to Phase 2, Phase 3, and Phase 4. Moreover, Phase 1 displays the lowest standard error as compared to all other Phases, suggesting that the predictive model developed in this paper, captures most of what is hap- pening in the real data. To ascertain this, one may look at the evolution of actual versus predicted distributions. Figures 1-4 grap- hically illustrate the evolution of the distribution of real wages over time, superimposed on histograms which describe the time evolution of the distribution of wages in the data across the four Phases. The solid curves in these figures illustrate the distribution of real wages as predicted by the model, and the dotted curves illustrate the distribution of real wages in the data. The vertical axes in these figures denote frequency, and the horizontal axes denote real wages in logarithms. These figures illu- strate that the neat pattern which we see in the fitted log normals is being pulled out of a set of histograms whose shape is irregular. It can be inferred from these illu- strations that the predicted values generated by the model are reliable in characterizing the actual data. The following observations can be made concerning our results: Figure 1. Phase 1 (selected years 1830 and 1869). Figure 2. Phase 2 (selected years 1870 and 1913). 1. The mean and variance of all four distributions are clearly evolving, corresponding to our theoretical pre- dictions. 2. The value for the wage adjustment rate is positive for all four sub-periods and varies from sample to sample as expected. 3. The value for the diffusion parameter is small and positive for all four sub-periods, conforming to our theoretical predictions. The diffusive is: 2=. lim t t The results predict that if we start with a normal Copyright © 2011 SciRes. ME  F. HASHEMI587 Figure 3. Phase 3 (selected years 1914 and 1945). Figure 4. Phase 4 (selected years 1946 and 1988). distribution and let the mode l drive the distribution, the distribution variance will tend toward a constant and concentrated around a mean which is largest in order of importance for Phase 4, Phase 3, Phase 1 and Phase 2. u 4. Conclusions An empirical application of the proposed model to the dynamics in four subperiods following the classification of Williamson [1] illustrates the applicability of our method. The empirical analysis confirms the results by Williamson and offers some new insights. Like Willi- amson, we find a significant variance in the rate of con- vergence since the mid-19th century, suggesting that the world economic environment mattered a great deal, and that the forces driving convergence are likely to have had very different quantitative significance within different epochs. Our results are consistent with historical obs- ervation that dramatic convergence took place from 1870 to 1913 as international trade boomed and capital flows, as well as international migrations rose. Long-run con- vergence slowed down and eventually ceased during and between the World Wars while world commodity trade and capital markets collapsed and international mig- rations slowed due to quotas and a Great Depression. Convergence resumed after World War II while inter- national trade and flows of capital and labor picked up. 5. References [1] J. Williamson, “The Evolution of Global Labour Markets since 1830: Background Evidence and Hypotheses,” Ex- plorations in Economic History, Vol. 32, No. 2, 1995, pp. 141- 196. doi:org/10.1006/exeh.1995.1006 [2] P. Krugman, “Increasing Returns and Economic Geogra- phy,” Journal of Political Economy, Vol. 99, No. 3, 1991, pp. 483-499. doi:org/10.1086/261763 [3] M. Fujita, P. Krugman and T. Mori, “On the Evolution of Hierarchical Urban Systems,” European Economic Re- view, Vol. 43, No. 2, 1999, pp. 209-251. doi:org/10.1016/S0014-2921(98)00066-X [4] D. Levine and S. Modica, “Anti-Malthus: Evolution, Population, and the Maximization of Free Resources,” 2011 (Forthcoming). [5] J. Hirshleifer, “The Dark Side of the Force: Economic Foundations of Conflict Theory,” Cambridge University Press, Cambridge, 2001. [6] P. Krugman, “The Self-Organizing Economy,” Blackwell Publishers, Oxford, 1996. [7] R. Axtel, “Zip distribution of US firm sizes,” Science, Vol. 293, No. 5536, 2001, pp. 1818-1820. doi:org/10.1126/science.1062081 [8] F. Hashemi, “A Dynamic Model of Size Distribution of Firms Applied to U.S. Biotechnology and Trucking In- dustries,” Small Business Economics, Vol. 21, No. 1, 2003, pp. 27-36. doi:org/10.1023/A:1024433203253 [9] R. Lucas, “Trade and the Diffusion of the Industrial Re- volution,” American Economic Journal: Macroeconomics, Vol. 1, No. 1, 2009, pp. 1-25. doi:org/10.1257/mac.1.1.1 [10] R. Barro and X. Sala-i-Martin, “Technological Diffusion, Convergence, and Growth,” Journal of Economic Growth, Vol. 2, 1997, p. 126. doi:org/10.1023/A:1009746629269 [11] D. Fudenberg and D. Levine, “Learning and Equilib- rium,” Annual Review of Economics, Vol. 1, 2009, pp. 385-419. doi:org/10.1146/annurev.economics.050708.142930 [12] D. Levine, “Neuroeconomics,” 2011 (Forthcoming). Copyright © 2011 SciRes. ME 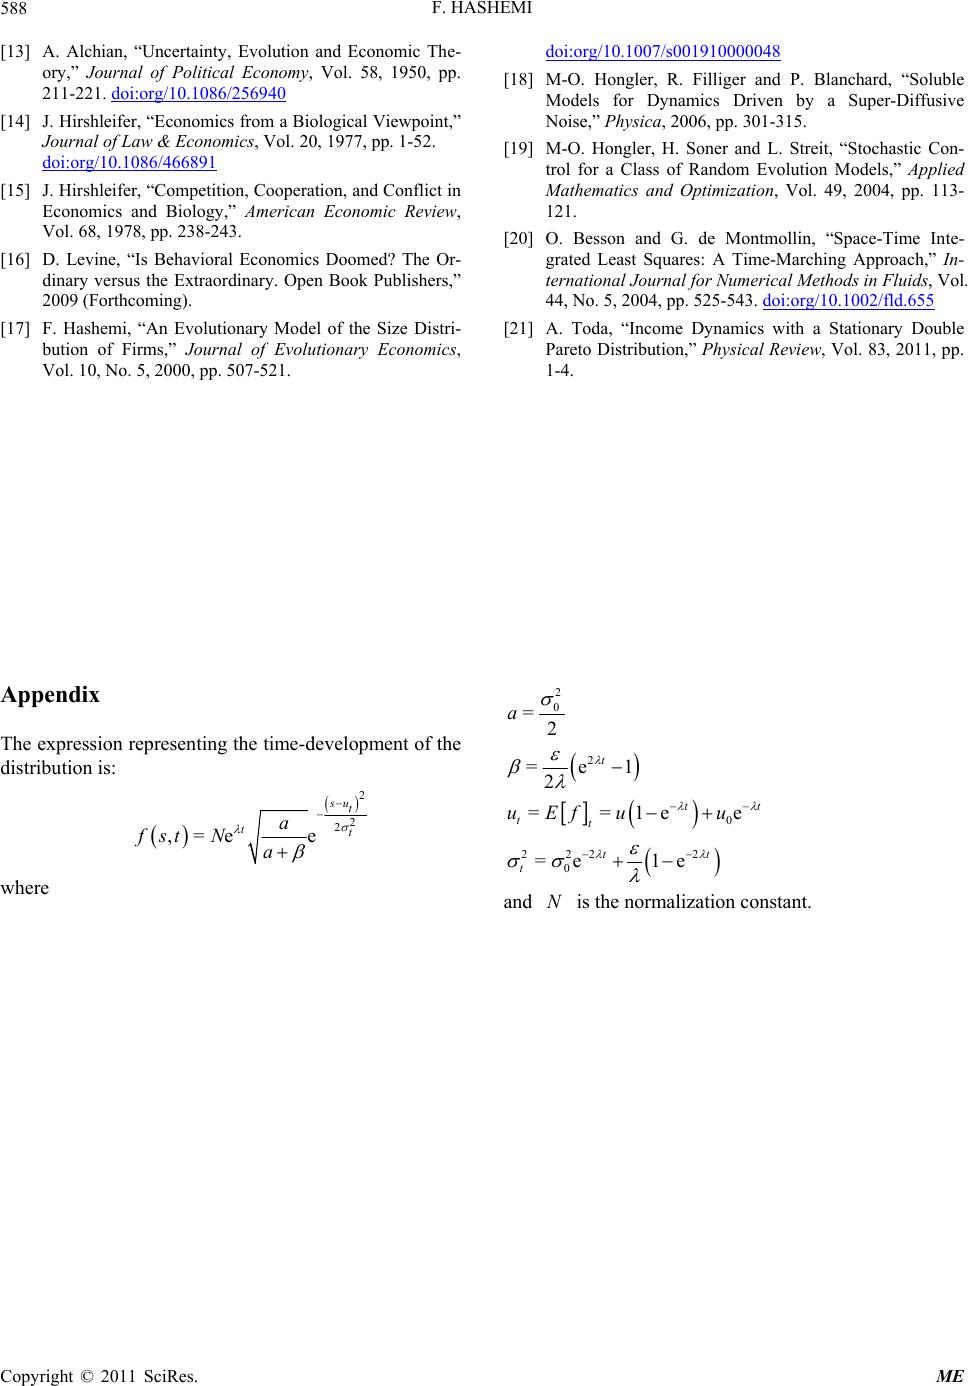 F. HASHEMI Copyright © 2011 SciRes. ME 588 [13] A. Alchian, “Uncertainty, Evolution and Economic The- ory,” Journal of Political Economy, Vol. 58, 1950, pp. 211-221. doi:org/10.1086/256940 [14] J. Hirshleifer, “Economics from a Biological Viewpoint,” Journal of Law & Economics, Vol. 20, 1977, pp. 1-52. doi:org/10.1086/466891 [15] J. Hirshleifer, “Competition, Cooperation, and Conflict in Economics and Biology,” American Economic Review, Vol. 68, 1978, pp. 238-243. [16] D. Levine, “Is Behavioral Economics Doomed? The Or- dinary versus the Extraordinary. Open Book Publishers,” 2009 (Forthcoming). [17] F. Hashemi, “An Evolutionary Model of the Size Distri- bution of Firms,” Journal of Evolutionary Economics, Vol. 10, No. 5, 2000, pp. 507-521. doi:org/10.1007/s001910000048 [18] M-O. Hongler, R. Filliger and P. Blanchard, “Soluble Models for Dynamics Driven by a Super-Diffusive Noise,” Physica, 2006, pp. 301-315. [19] M-O. Hongler, H. Soner and L. Streit, “Stochastic Con- trol for a Class of Random Evolution Models,” Applied Mathematics and Optimization, Vol. 49, 2004, pp. 113- 121. [20] O. Besson and G. de Montmollin, “Space-Time Inte- grated Least Squares: A Time-Marching Approach,” In- ternational Journal for Numerical Methods in Fluids, Vol. 44, No. 5, 2004, pp. 525-543. doi:org/10.1002/fld.655 [21] A. Toda, “Income Dynamics with a Stationary Double Pareto Distribution,” Physical Review, Vol. 83, 2011, pp. 1-4. Appendix 2 0 =2 a The expression representing the time-development of the distribution is: 2 =e1 2 t 2 2 2 ,=ee su t tt a fstNa 0 ==1e e tt tt uEf uu 222 2 0 =e 1e tt t where and is the normalization constant. N |