

Paper Menu >>
Journal Menu >>
 Modern Economy, 2011, 2, 538-545 doi:10.4236/me.2011.24059 Published Online September 2011 (http://www.SciRP.org/journal/me) Copyright © 2011 SciRes. ME Effects of Exchange Rate Volatility on Trade in Some Selected Sub-Saharan African Countries David Olayungbo, Olalekan Yinusa, Anthony Akinlo Department of economics, obafemi Awolow o Uni versi t y , Ile-Ife, Nigeria E-mail: [email protected] Received April 2, 2011; revised June 2, 2011; accepted June 15, 2011 Abstract The paper investigates the impact of exchange rate volatility on trade in 40 selected sub-Saharan African countries for the period 1986-2005. The study employs a gravity model with pooled ordinary least square (POLS) allowing for fixed effect and panel Generalized Method of Moments (GMM) techniques. The results of the analysis show that the net effect of exchange rate volatility on aggregate trade was positive using the two approaches. In the way the results show that there is not much difference between the impact of ex- change rate volatility on primary and manufactured trade as well as between ECOWAS and non-ECOWAS countries. However, the results should be interpreted with caution as the history of exchange rate volatility is still relatively young compared with the developed countries. Keywords: Exchange Rate Volatility, Trade, Sub-Saharan Africa 1. Introduction Foreign exchange rate for sub-Saharan African countries have been highly volatile following introduction of the structural adjustment reforms since early 1980s. A cen- tral question has been the effect of such high exchange rate volatility on the growth of foreign trade. In the de- veloped and other industrialized economies, several studies have provided empirical evidence on the rela- tionship between exchange rate volatility and trade. In general, most of these studies have concluded that ex- change rate volatility deters the growth of foreign trade. However, little is known about the extent this conclusion may be true for sub-Saharan African countries consider- ing their peculiar characteristics including low exports volume and dominance of primary commodities in the aggregate exports. Essentially, studies of the experience with sub-Saharan African countries have been very few, due mainly to the unavailability of sufficient time series data1. This article examines the impact of exchange rate volatility on trade for forty sub-Saharan African coun- tries. The paper adds to existing literature in many ways. One, the paper focuses specifically on sub-Saharan Afri- can countries as against many others that merely only included few African countries as part of larger sample. Moreover, this study covers more Sub-Saharan African countries compared with few existing studies in Sub Sa- haran countries. Also, we examine the differential impact of exchange of rate volatility on both primary and manu- factured exports in the sub region2. Finally, we examine the impact of regional grouping on the relationship be- tween exchange rate volatility and trade in the region. Essentially, this study is important for two main rea- sons. One, the effect of the exchange rate volatility on trade has significant impact on the reforms in the sub-region. If exchange rate volatility adversely affects trade, the export expansion programme will be jeopard- ized. Moreover, the intended effect of the current trade liberalization policy being implemented in the sub region may be dammed thereby precipitating a balance of pay- ment crisis. The paper is organized as follows. In Section 2, we discuss an overview of exchange rate management and trade development in the region, in Section 3, we equally examine the specification of the model. Data sources and variable definitions are described in Section 4. In Section 1Few recent studies that focus exclusively on African Countries data include [1], [2] and [3]. Out of the forty five countries that make up the sub-Saharan African countries only five countries such as Eritrea, Somalia, United Republic of Tanzania, Guinea Bissau and Comoros are excluded from our sample due to unavailability of data. 2Indeed, it has been observed in the literature that total trade aggregate tends to hide substantial variation across sectors. There is the need to look at some of the components of the aggregate trade. 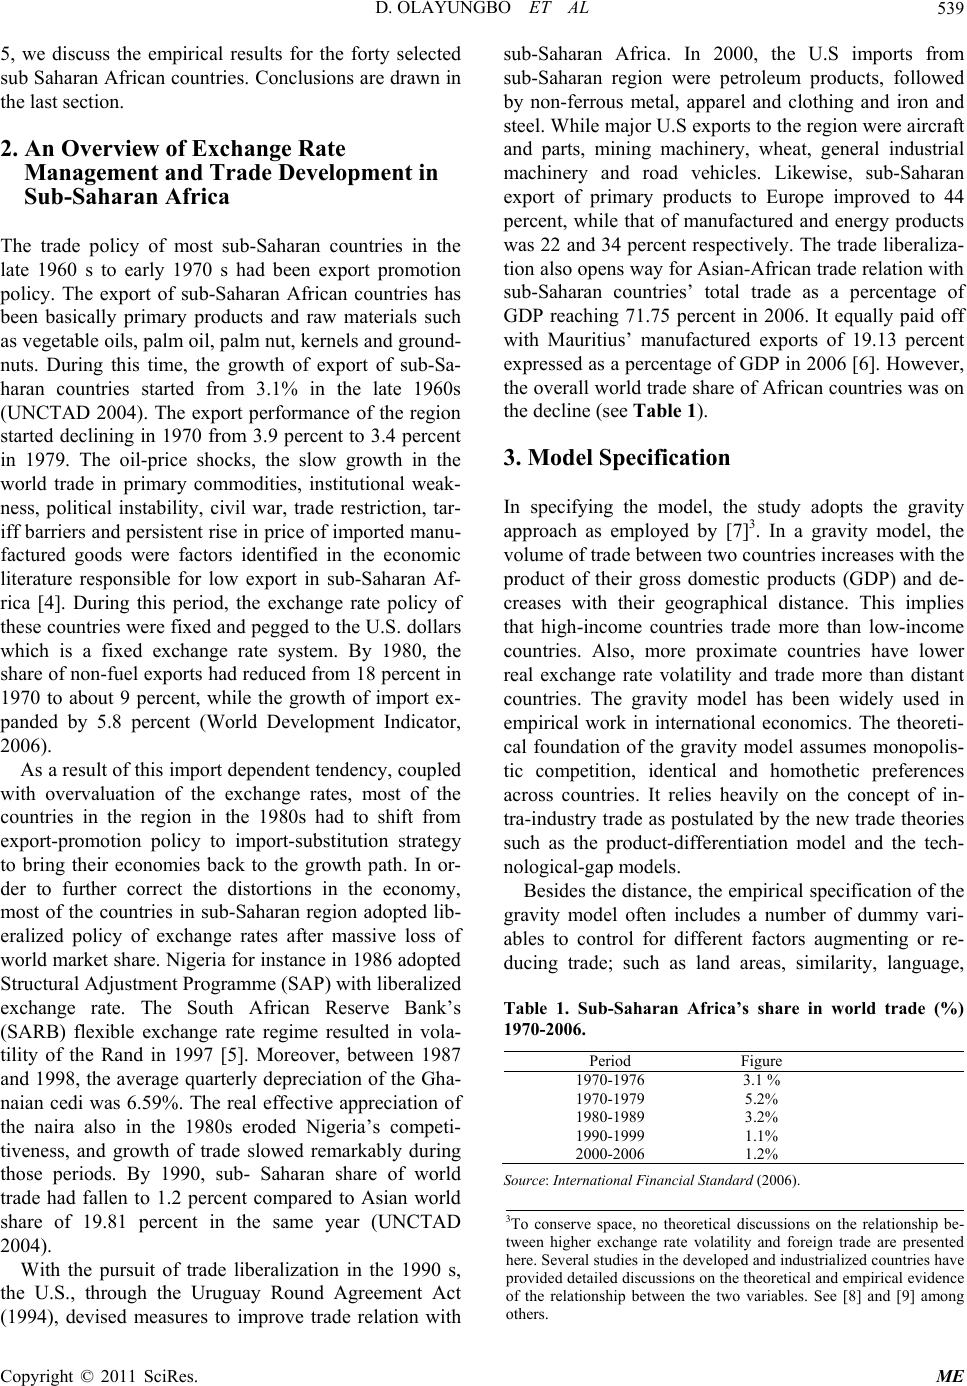 D. OLAYUNGBO ET AL539 5, we discuss the empirical results for the forty selected sub Saharan African countries. Conclusions are drawn in the last section. 2. An Overview of Exchange Rate Management and Trade Development in Sub-Saharan Africa The trade policy of most sub-Saharan countries in the late 1960 s to early 1970 s had been export promotion policy. The export of sub-Saharan African countries has been basically primary products and raw materials such as vegetable oils, palm oil, palm nut, kernels and ground- nuts. During this time, the growth of export of sub-Sa- haran countries started from 3.1% in the late 1960s (UNCTAD 2004). The export performance of the region started declining in 1970 from 3.9 percent to 3.4 percent in 1979. The oil-price shocks, the slow growth in the world trade in primary commodities, institutional weak- ness, political instability, civil war, trade restriction, tar- iff barriers and persistent rise in price of imported manu- factured goods were factors identified in the economic literature responsible for low export in sub-Saharan Af- rica [4]. During this period, the exchange rate policy of these countries were fixed and pegged to the U.S. dollars which is a fixed exchange rate system. By 1980, the share of non-fuel exports had reduced from 18 percent in 1970 to about 9 percent, while the growth of import ex- panded by 5.8 percent (World Development Indicator, 2006). As a result of this import dependent tendency, coupled with overvaluation of the exchange rates, most of the countries in the region in the 1980s had to shift from export-promotion policy to import-substitution strategy to bring their economies back to the growth path. In or- der to further correct the distortions in the economy, most of the countries in sub-Saharan region adopted lib- eralized policy of exchange rates after massive loss of world market share. Nigeria for instance in 1986 adopted Structural Adjustment Programme (SAP) with liberalized exchange rate. The South African Reserve Bank’s (SARB) flexible exchange rate regime resulted in vola- tility of the Rand in 1997 [5]. Moreover, between 1987 and 1998, the average quarterly depreciation of the Gha- naian cedi was 6.59%. The real effective appreciation of the naira also in the 1980s eroded Nigeria’s competi- tiveness, and growth of trade slowed remarkably during those periods. By 1990, sub- Saharan share of world trade had fallen to 1.2 percent compared to Asian world share of 19.81 percent in the same year (UNCTAD 2004). With the pursuit of trade liberalization in the 1990 s, the U.S., through the Uruguay Round Agreement Act (1994), devised measures to improve trade relation with sub-Saharan Africa. In 2000, the U.S imports from sub-Saharan region were petroleum products, followed by non-ferrous metal, apparel and clothing and iron and steel. While major U.S exports to the region were aircraft and parts, mining machinery, wheat, general industrial machinery and road vehicles. Likewise, sub-Saharan export of primary products to Europe improved to 44 percent, while that of manufactured and energy products was 22 and 34 percent respectively. The trade liberaliza- tion also opens way for Asian-African trade relation with sub-Saharan countries’ total trade as a percentage of GDP reaching 71.75 percent in 2006. It equally paid off with Mauritius’ manufactured exports of 19.13 percent expressed as a percentage of GDP in 2006 [6]. However, the overall world trade share of African countries was on the decline (see Table 1). 3. Model Specification In specifying the model, the study adopts the gravity approach as employed by [7]3. In a gravity model, the volume of trade between two countries increases with the product of their gross domestic products (GDP) and de- creases with their geographical distance. This implies that high-income countries trade more than low-income countries. Also, more proximate countries have lower real exchange rate volatility and trade more than distant countries. The gravity model has been widely used in empirical work in international economics. The theoreti- cal foundation of the gravity model assumes monopolis- tic competition, identical and homothetic preferences across countries. It relies heavily on the concept of in- tra-industry trade as postulated by the new trade theories such as the product-differentiation model and the tech- nological-gap models. Besides the distance, the empirical specification of the gravity model often includes a number of dummy vari- ables to control for different factors augmenting or re- ducing trade; such as land areas, similarity, language, Table 1. Sub-Saharan Africa’s share in world trade (%) 1970-2006. Period Figure 1970-1976 3.1 % 1970-1979 5.2% 1980-1989 3.2% 1990-1999 1.1% 2000-2006 1.2% Source: Inte rnational Financial Standard (2006). 3To conserve space, no theoretical discussions on the relationship be- tween higher exchange rate volatility and foreign trade are presented here. Several studies in the developed and industrialized countries have p rovided detailed discussions on the theoretical and empirical evidence of the relationship between the two variables. See [8] and [9] among others. Copyright © 2011 SciRes. ME 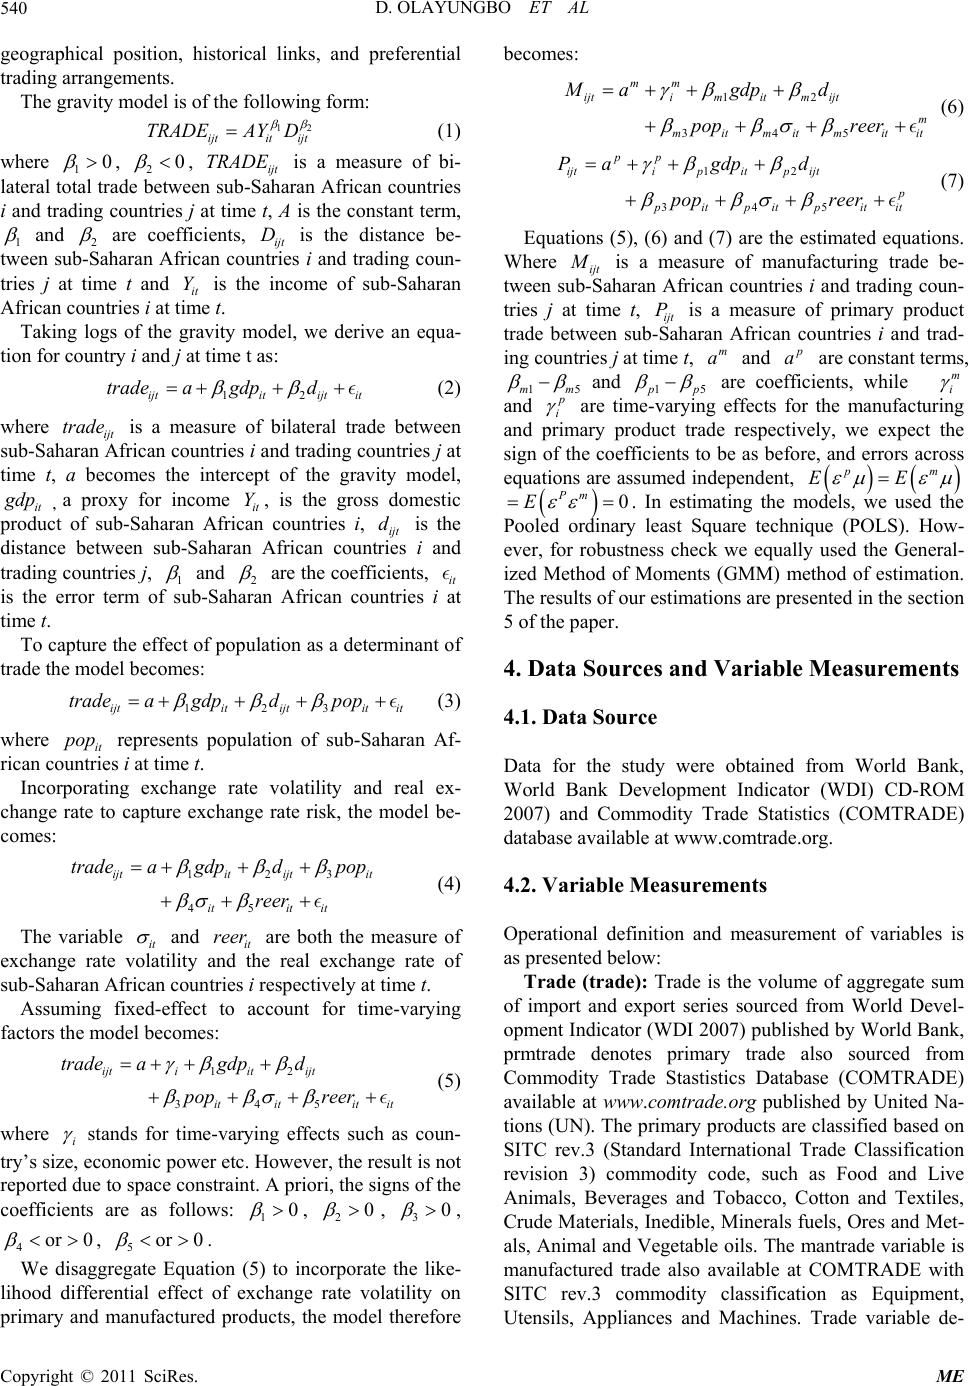 D. OLAYUNGBO ET AL 540 geographical position, historical links, and preferential trading arrangements. The gravity model is of the following form: 12 ijtit ijt TRADEAY D (1) where 10 0, 2 T, ijt is a measure of bi- lateral total trade between sub-Saharan African countries i and trading countries j at time t, A is the constant term, 1 RADE and 2 are coefficients, ijt is the distance be- tween sub-Saharan African countries i and trading coun- tries j at time t and it is the income of sub-Saharan African countries i at time t. D Y Taking logs of the gravity model, we derive an equa- tion for country i and j at time t as: 12ijtitijt it trade agdpd (2) where ijt is a measure of bilateral trade between sub-Saharan African countries i and trading countries j at time t, a becomes the intercept of the gravity model, it trade g dp d , a proxy for income it Y, is the gross domestic product of sub-Saharan African countries i, ijt is the distance between sub-Saharan African countries i and trading countries j, 1 and 2 are the coefficients, it is the error term of sub-Saharan African countries i at time t. To capture the effect of population as a determinant of trade the model becomes: 123ijtitijtit it trade agdpdpop (3) where it represents population of sub-Saharan Af- rican countries i at time t. pop Incorporating exchange rate volatility and real ex- change rate to capture exchange rate risk, the model be- comes: 123ijtit ijtit trade agdpdpop 45it it it reer (4) The variable it and it are both the measure of exchange rate volatility and the real exchange rate of sub-Saharan African countries i respectively at time t. reer Assuming fixed-effect to account for time-varying factors the model becomes: 12ijtiit ijt trade agdpd 34 5ititit it pop reer (5) where i stands for time-varying effects such as coun- try’s size, economic power etc. However, the result is not reported due to space constraint. A priori, the signs of the coefficients are as follows: 10 2 , 0 , 30 , 4or 0 5or0, . We disaggregate Equation (5) to incorporate the like- lihood differential effect of exchange rate volatility on primary and manufactured products, the model therefore becomes: 12 mm ijtimitm ijt Magdp d 34 5 m mit mit mitit pop reer (6) 12 pp ijtipitp ijt 345 p p itp itpitit pop reer P agdpd (7) Equations (5), (6) and (7) are the estimated equations. Where ijt M is a measure of manufacturing trade be- tween sub-Saharan African countries i and trading coun- tries j at time t, ijt is a measure of primary product trade between sub-Saharan African countries i and trad- ing countries j at time t, and P m a p a are constant terms, 15mm and 15 p p are coefficients, while m i and p i are time-varying effects for the manufacturing and primary product trade respectively, we expect the sign of the coefficients to be as before, and errors across equations are assumed independent, pm EE Pm 0E . In estimating the models, we used the Pooled ordinary least Square technique (POLS). How- ever, for robustness check we equally used the General- ized Method of Moments (GMM) method of estimation. The results of our estimations are presented in the section 5 of the paper. 4. Data Sources and Variable Measurements 4.1. Data Source Data for the study were obtained from World Bank, World Bank Development Indicator (WDI) CD-ROM 2007) and Commodity Trade Statistics (COMTRADE) database available at www.comtrade.org. 4.2. Variable Measurements Operational definition and measurement of variables is as presented below: Trade (trade): Trade is the volume of aggregate sum of import and export series sourced from World Devel- opment Indicator (WDI 2007) published by World Bank, prmtrade denotes primary trade also sourced from Commodity Trade Stastistics Database (COMTRADE) available at www.comtrade.org published by United Na- tions (UN). The primary products are classified based on SITC rev.3 (Standard International Trade Classification revision 3) commodity code, such as Food and Live Animals, Beverages and Tobacco, Cotton and Textiles, Crude Materials, Inedible, Minerals fuels, Ores and Met- als, Animal and Vegetable oils. The mantrade variable is manufactured trade also available at COMTRADE with SITC rev.3 commodity classification as Equipment, Utensils, Appliances and Machines. Trade variable de- Copyright © 2011 SciRes. ME 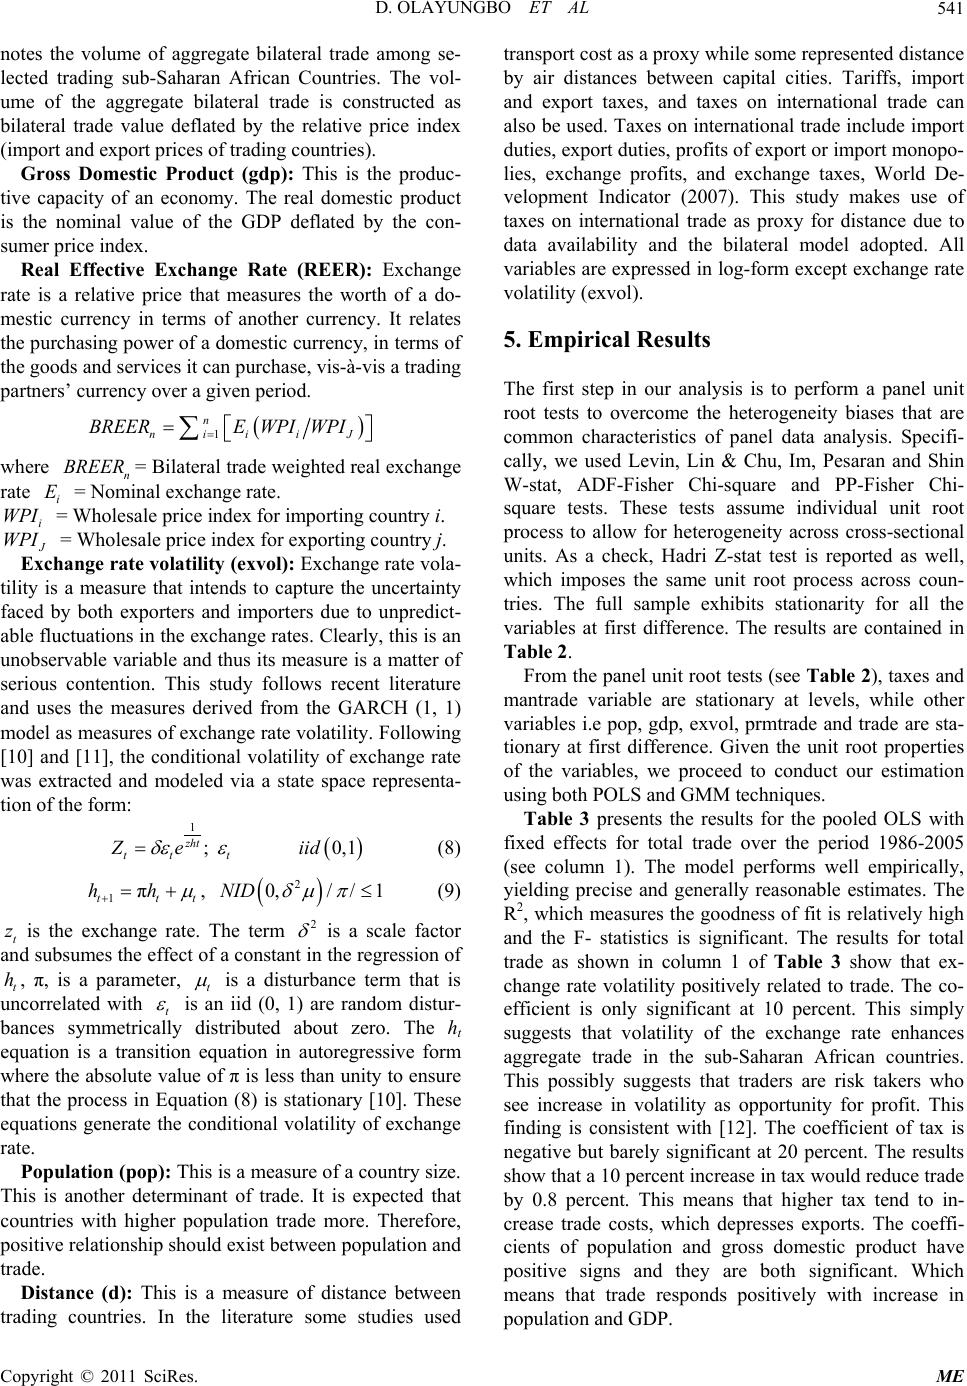 D. OLAYUNGBO ET AL541 notes the volume of aggregate bilateral trade among se- lected trading sub-Saharan African Countries. The vol- ume of the aggregate bilateral trade is constructed as bilateral trade value deflated by the relative price index (import and export prices of trading countries). Gross Domestic Product (gdp): This is the produc- tive capacity of an economy. The real domestic product is the nominal value of the GDP deflated by the con- sumer price index. Real Effective Exchange Rate (REER): Exchange rate is a relative price that measures the worth of a do- mestic currency in terms of another currency. It relates the purchasing power of a domestic currency, in terms of the goods and services it can purchase, vis-à-vis a trading partners’ currency over a given period. 1 n niiiJ BREERE WPIWPI where n= Bilateral trade weighted real exchange rate = Nominal exchange rate. BREER i = Wholesale price index for importing country i. E i WPI J WPI = Wholesale price index for exporting country j. Exchange rate volat ility (exvol): Exchange rate vola- tility is a measure that intends to capture the uncertainty faced by both exporters and importers due to unpredict- able fluctuations in the exchange rates. Clearly, this is an unobservable variable and thus its measure is a matter of serious contention. This study follows recent literature and uses the measures derived from the GARCH (1, 1) model as measures of exchange rate volatility. Following [10] and [11], the conditional volatility of exchange rate was extracted and modeled via a state space representa- tion of the form: 1 ; zht tt t Ze (8) 0,1iid 1π ttt hh NID, (9) 2 0,/ /1 2 t is the exchange rate. The term z is a scale factor and subsumes the effect of a constant in the regression of t, π, is a parameter, t h is a disturbance term that is uncorrelated with t is an iid (0, 1) are random distur- bances symmetrically distributed about zero. The ht equation is a transition equation in autoregressive form where the absolute value of π is less than unity to ensure that the process in Equation (8) is stationary [10]. These equations generate the conditional volatility of exchange rate. Population (pop): This is a measure of a country size. This is another determinant of trade. It is expected that countries with higher population trade more. Therefore, positive relationship should exist between population and trade. Distance (d): This is a measure of distance between trading countries. In the literature some studies used transport cost as a proxy while some represented distance by air distances between capital cities. Tariffs, import and export taxes, and taxes on international trade can also be used. Taxes on international trade include import duties, export duties, profits of export or import monopo- lies, exchange profits, and exchange taxes, World De- velopment Indicator (2007). This study makes use of taxes on international trade as proxy for distance due to data availability and the bilateral model adopted. All variables are expressed in log-form except exchange rate volatility (exvol). 5. Empirical Results The first step in our analysis is to perform a panel unit root tests to overcome the heterogeneity biases that are common characteristics of panel data analysis. Specifi- cally, we used Levin, Lin & Chu, Im, Pesaran and Shin W-stat, ADF-Fisher Chi-square and PP-Fisher Chi- square tests. These tests assume individual unit root process to allow for heterogeneity across cross-sectional units. As a check, Hadri Z-stat test is reported as well, which imposes the same unit root process across coun- tries. The full sample exhibits stationarity for all the variables at first difference. The results are contained in Table 2. From the panel unit root tests (see Table 2), taxes and mantrade variable are stationary at levels, while other variables i.e pop, gdp, exvol, prmtrade and trade are sta- tionary at first difference. Given the unit root properties of the variables, we proceed to conduct our estimation using both POLS and GMM techniques. Table 3 presents the results for the pooled OLS with fixed effects for total trade over the period 1986-2005 (see column 1). The model performs well empirically, yielding precise and generally reasonable estimates. The R2, which measures the goodness of fit is relatively high and the F- statistics is significant. The results for total trade as shown in column 1 of Table 3 show that ex- change rate volatility positively related to trade. The co- efficient is only significant at 10 percent. This simply suggests that volatility of the exchange rate enhances aggregate trade in the sub-Saharan African countries. This possibly suggests that traders are risk takers who see increase in volatility as opportunity for profit. This finding is consistent with [12]. The coefficient of tax is negative but barely significant at 20 percent. The results show that a 10 percent increase in tax would reduce trade by 0.8 percent. This means that higher tax tend to in- crease trade costs, which depresses exports. The coeffi- cients of population and gross domestic product have positive signs and they are both significant. Which means that trade responds positively with increase in population and GDP. Copyright © 2011 SciRes. ME 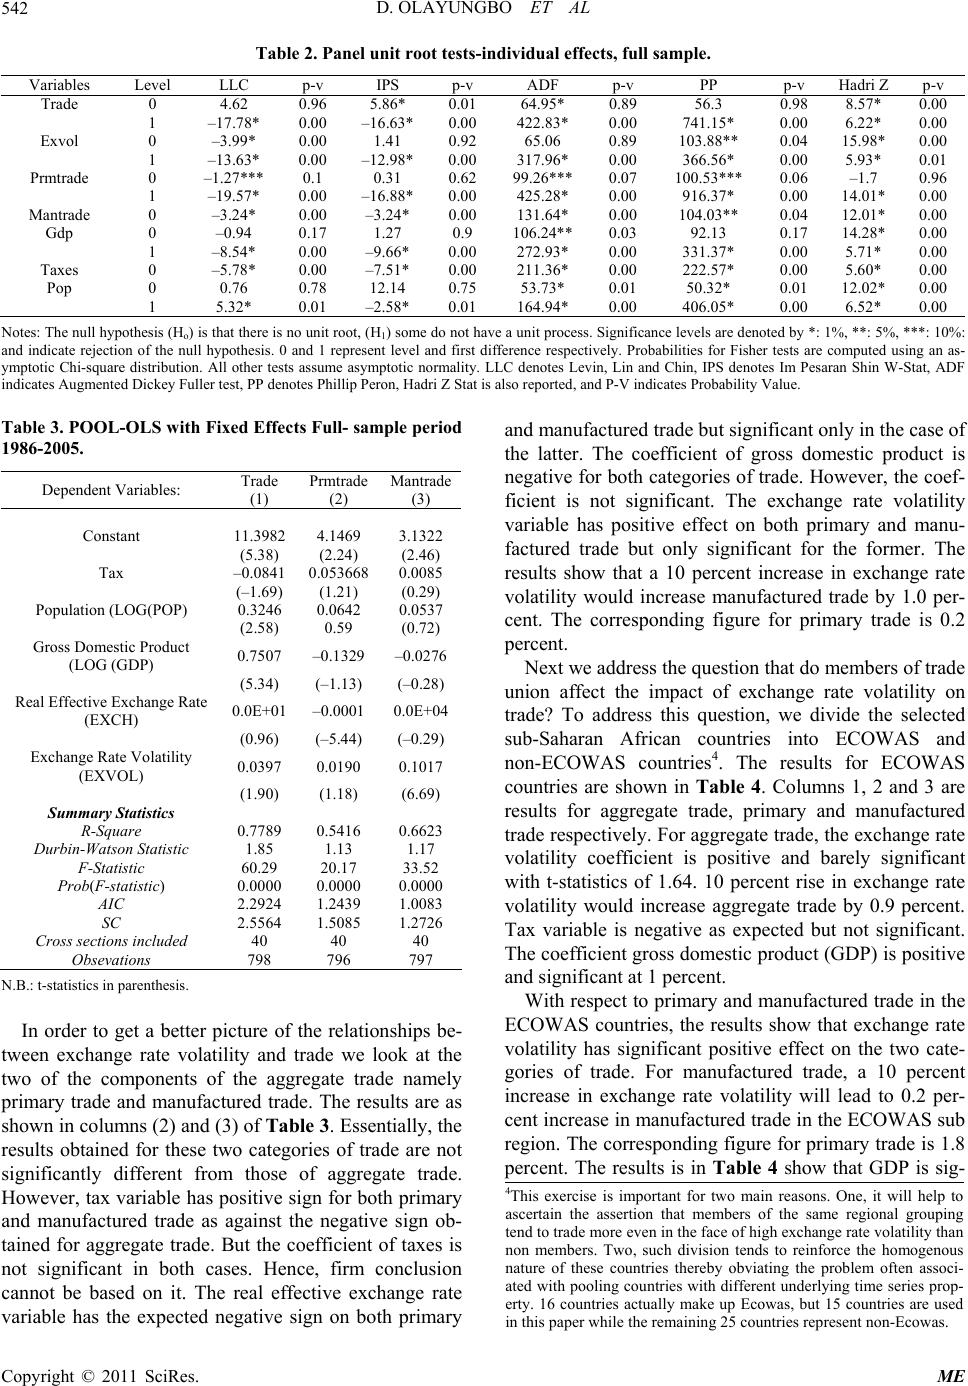 D. OLAYUNGBO ET AL Copyright © 2011 SciRes. ME 542 Table 2. Panel unit root tests-individual effects, full sample. Variables Level LLC p-v IPS p-v ADF p-v PP p-v Hadri Zp-v Trade 0 4.62 0.96 5.86* 0.01 64.95* 0.89 56.3 0.98 8.57* 0.00 1 –17.78* 0.00 –16.63* 0.00 422.83* 0.00 741.15* 0.00 6.22* 0.00 Exvol 0 –3.99* 0.00 1.41 0.92 65.06 0.89 103.88** 0.04 15.98*0.00 1 –13.63* 0.00 –12.98* 0.00 317.96* 0.00 366.56* 0.00 5.93* 0.01 Prmtrade 0 –1.27*** 0.1 0.31 0.62 99.26*** 0.07 100.53*** 0.06 –1.7 0.96 1 –19.57* 0.00 –16.88* 0.00 425.28* 0.00 916.37* 0.00 14.01*0.00 Mantrade 0 –3.24* 0.00 –3.24* 0.00 131.64* 0.00 104.03** 0.04 12.01*0.00 Gdp 0 –0.94 0.17 1.27 0.9 106.24** 0.03 92.13 0.17 14.28*0.00 1 –8.54* 0.00 –9.66* 0.00 272.93* 0.00 331.37* 0.00 5.71* 0.00 Taxes 0 –5.78* 0.00 –7.51* 0.00 211.36* 0.00 222.57* 0.00 5.60* 0.00 Pop 0 0.76 0.78 12.14 0.75 53.73* 0.01 50.32* 0.01 12.02*0.00 1 5.32* 0.01 –2.58* 0.01 164.94* 0.00 406.05* 0.00 6.52* 0.00 Notes: The null hypothesis (Ho) is that there is no unit root, (H1) some do not have a unit process. Significance levels are denoted by *: 1%, **: 5%, ***: 10%: and indicate rejection of the null hypothesis. 0 and 1 represent level and first difference respectively. Probabilities for Fisher tests are computed using an as- ymptotic Chi-square distribution. All other tests assume asymptotic normality. LLC denotes Levin, Lin and Chin, IPS denotes Im Pesaran Shin W-Stat, ADF indicates Augmented Dickey Fuller test, PP denotes Phillip Peron, Hadri Z Stat is also reported, and P-V indicates Probability Value. Table 3. POOL-OLS with Fixed Effects Full- sample period 1986-2005. Dependent Variables: Trade (1) Prmtrade (2) Mantrade (3) Constant 11.3982 4.1469 3.1322 (5.38) (2.24) (2.46) Tax –0.0841 0.053668 0.0085 (–1.69) (1.21) (0.29) Population (LOG(POP) 0.3246 0.0642 0.0537 (2.58) 0.59 (0.72) Gross Domestic Product (LOG (GDP) 0.7507 –0.1329 –0.0276 (5.34) (–1.13) (–0.28) Real Effective Exchange Rate (EXCH) 0.0E+01 –0.0001 0.0E+04 (0.96) (–5.44) (–0.29) Exchange Rate Volatility (EXVOL) 0.0397 0.0190 0.1017 (1.90) (1.18) (6.69) Summary Statistics R-Square 0.7789 0.5416 0.6623 Durbin-Watson Statistic 1.85 1.13 1.17 F-Statistic 60.29 20.17 33.52 Prob(F-statistic) 0.0000 0.0000 0.0000 AIC 2.2924 1.2439 1.0083 SC 2.5564 1.5085 1.2726 Cross sections included 40 40 40 Obsevations 798 796 797 N.B.: t-statistics in parenthesis. In order to get a better picture of the relationships be- tween exchange rate volatility and trade we look at the two of the components of the aggregate trade namely primary trade and manufactured trade. The results are as shown in columns (2) and (3) of Table 3 . Essentially, the results obtained for these two categories of trade are not significantly different from those of aggregate trade. However, tax variable has positive sign for both primary and manufactured trade as against the negative sign ob- tained for aggregate trade. But the coefficient of taxes is not significant in both cases. Hence, firm conclusion cannot be based on it. The real effective exchange rate variable has the expected negative sign on both primary and manufactured trade but significant only in the case of the latter. The coefficient of gross domestic product is negative for both categories of trade. However, the coef- ficient is not significant. The exchange rate volatility variable has positive effect on both primary and manu- factured trade but only significant for the former. The results show that a 10 percent increase in exchange rate volatility would increase manufactured trade by 1.0 per- cent. The corresponding figure for primary trade is 0.2 percent. Next we address the question that do members of trade union affect the impact of exchange rate volatility on trade? To address this question, we divide the selected sub-Saharan African countries into ECOWAS and non-ECOWAS countries4. The results for ECOWAS countries are shown in Table 4. Columns 1, 2 and 3 are results for aggregate trade, primary and manufactured trade respectively. For aggregate trade, the exchange rate volatility coefficient is positive and barely significant with t-statistics of 1.64. 10 percent rise in exchange rate volatility would increase aggregate trade by 0.9 percent. Tax variable is negative as expected but not significant. The coefficient gross domestic product (GDP) is positive and significant at 1 percent. With respect to primary and manufactured trade in the ECOWAS countries, the results show that exchange rate volatility has significant positive effect on the two cate- gories of trade. For manufactured trade, a 10 percent increase in exchange rate volatility will lead to 0.2 per- cent increase in manufactured trade in the ECOWAS sub region. The corresponding figure for primary trade is 1.8 percent. The results is in Table 4 show that GDP is sig- 4This exercise is important for two main reasons. One, it will help to ascertain the assertion that members of the same regional grouping tend to trade more even in the face of high exchange rate volatility than non members. Two, such division tends to reinforce the homogenous nature of these countries thereby obviating the problem often associ- ated with pooling countries with different underlying time series prop- erty. 16 countries actually make up Ecowas, but 15 countries are used in this paper while the remaining 25 countries represent non-Ecowas. 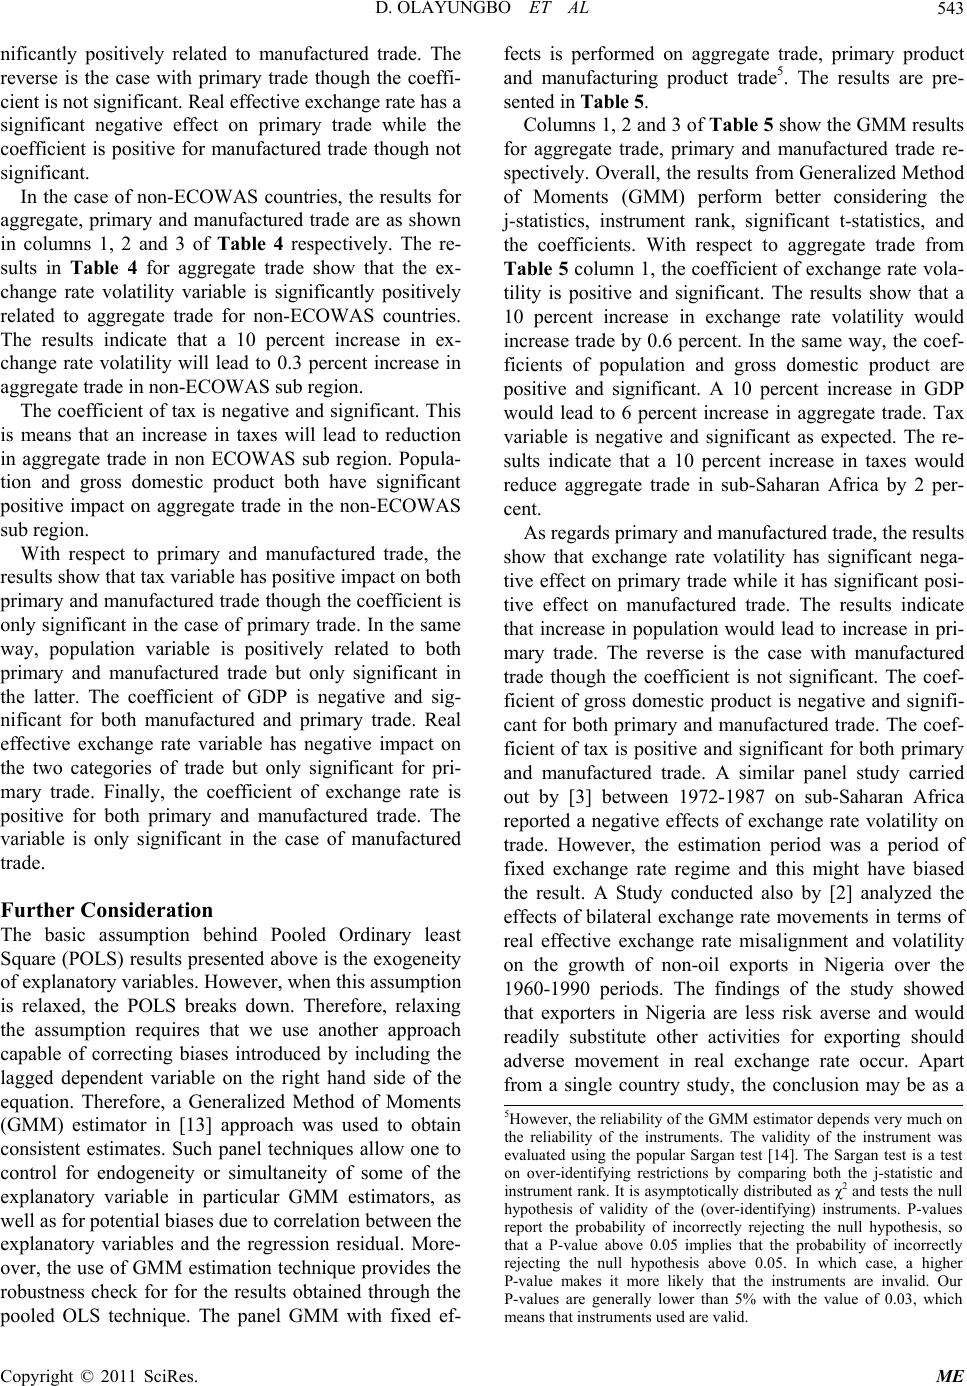 D. OLAYUNGBO ET AL543 nificantly positively related to manufactured trade. The reverse is the case with primary trade though the coeffi- cient is not significant. Real effective exchange rate has a significant negative effect on primary trade while the coefficient is positive for manufactured trade though not significant. In the case of non-ECOWAS countries, the results for aggregate, primary and manufactured trade are as shown in columns 1, 2 and 3 of Table 4 respectively. The re- sults in Table 4 for aggregate trade show that the ex- change rate volatility variable is significantly positively related to aggregate trade for non-ECOWAS countries. The results indicate that a 10 percent increase in ex- change rate volatility will lead to 0.3 percent increase in aggregate trade in non-ECOWAS sub region. The coefficient of tax is negative and significant. This is means that an increase in taxes will lead to reduction in aggregate trade in non ECOWAS sub region. Popula- tion and gross domestic product both have significant positive impact on aggregate trade in the non-ECOWAS sub region. With respect to primary and manufactured trade, the results show that tax variable has positive impact on both primary and manufactured trade though the coefficient is only significant in the case of primary trade. In the same way, population variable is positively related to both primary and manufactured trade but only significant in the latter. The coefficient of GDP is negative and sig- nificant for both manufactured and primary trade. Real effective exchange rate variable has negative impact on the two categories of trade but only significant for pri- mary trade. Finally, the coefficient of exchange rate is positive for both primary and manufactured trade. The variable is only significant in the case of manufactured trade. Further Consideration The basic assumption behind Pooled Ordinary least Square (POLS) results presented above is the exogeneity of explanatory variables. However, when this assumption is relaxed, the POLS breaks down. Therefore, relaxing the assumption requires that we use another approach capable of correcting biases introduced by including the lagged dependent variable on the right hand side of the equation. Therefore, a Generalized Method of Moments (GMM) estimator in [13] approach was used to obtain consistent estimates. Such panel techniques allow one to control for endogeneity or simultaneity of some of the explanatory variable in particular GMM estimators, as well as for potential biases due to correlation between the explanatory variables and the regression residual. More- over, the use of GMM estimation technique provides the robustness check for for the results obtained through the pooled OLS technique. The panel GMM with fixed ef- fects is performed on aggregate trade, primary product and manufacturing product trade5. The results are pre- sented in Table 5. Columns 1, 2 and 3 of Table 5 show the GMM results for aggregate trade, primary and manufactured trade re- spectively. Overall, the results from Generalized Method of Moments (GMM) perform better considering the j-statistics, instrument rank, significant t-statistics, and the coefficients. With respect to aggregate trade from Table 5 column 1, the coefficient of exchange rate vola- tility is positive and significant. The results show that a 10 percent increase in exchange rate volatility would increase trade by 0.6 percent. In the same way, the coef- ficients of population and gross domestic product are positive and significant. A 10 percent increase in GDP would lead to 6 percent increase in aggregate trade. Tax variable is negative and significant as expected. The re- sults indicate that a 10 percent increase in taxes would reduce aggregate trade in sub-Saharan Africa by 2 per- cent. As regards primary and manufactured trade, the results show that exchange rate volatility has significant nega- tive effect on primary trade while it has significant posi- tive effect on manufactured trade. The results indicate that increase in population would lead to increase in pri- mary trade. The reverse is the case with manufactured trade though the coefficient is not significant. The coef- ficient of gross domestic product is negative and signifi- cant for both primary and manufactured trade. The coef- ficient of tax is positive and significant for both primary and manufactured trade. A similar panel study carried out by [3] between 1972-1987 on sub-Saharan Africa reported a negative effects of exchange rate volatility on trade. However, the estimation period was a period of fixed exchange rate regime and this might have biased the result. A Study conducted also by [2] analyzed the effects of bilateral exchange rate movements in terms of real effective exchange rate misalignment and volatility on the growth of non-oil exports in Nigeria over the 1960-1990 periods. The findings of the study showed that exporters in Nigeria are less risk averse and would readily substitute other activities for exporting should adverse movement in real exchange rate occur. Apart from a single country study, the conclusion may be as a 5However, the reliability of the GMM estimator depends very much on the reliability of the instruments. The validity of the instrument was evaluated using the popular Sargan test [14]. The Sargan test is a test on over-identifying restrictions by comparing both the j-statistic and instrument rank. It is asymptotically distributed as χ2 and tests the null hypothesis of validity of the (over-identifying) instruments. P-values report the probability of incorrectly rejecting the null hypothesis, so that a P-value above 0.05 implies that the probability of incorrectly rejecting the null hypothesis above 0.05. In which case, a higher P-value makes it more likely that the instruments are invalid. Our P-values are generally lower than 5% with the value of 0.03, which means that instruments used are valid. Copyright © 2011 SciRes. ME  D. OLAYUNGBO ET AL 544 Table 4. POOL-OLS with Fixed Effects Full-sample period 1986-2005 (NON ECOWAS COUNTRIES) 25 countri es . Dependent Variables: trade 1 Prmtrade 2 Mantrade 3 Constant 10.9604 4.6812 1.9147 (3.65) (1.95) (1.48) Tax –0.1010 0.0817 0.0034 (–3.40) (1.53) (0.11) Population( LOG (POP) 0.4526 0.0907 0.1943 (3.34) (0.61) (2.37) Gross Domestic Product (LOG (GDP) 0.5232 –0.2951 –0.1681 (3.49) (–3.67) (–1.98) Real Effective Exchange Rate (EXCH) 0.0E+06 –0.0E+09 –0.0E+01 (2.70) (–6.28) (–0.10) Exchange Rate Volatility (EXVOL) 0.0338 0.0079 0.1044 (8.22) (1.08) (2.73) Summary Statistics R-Square 0.9472 0.5068 0.6571 Durbin-Watson Statistic 0.64 1.14 1.24 F-Statistic 311.62 18.74 34.15 Prob (F-statistic) 0.0000 0.0000 0.0000 AIC 0.5950 1.3901 1.3404 SC 0.8485 1.6441 1.5940 Cross sections included 25 25 25 Observations 520 519 520 Table 5. Panel generalized method of moments fixed effects (first difference) 1988-2005 (A ll coun tries). Variables: Trade 1 Prmtrade 2 Mantrade 3 LOG (TRADE (–1)), LOG (PRMTRADE (–1)), LOG (MANTRADE(–1)) 0.0520 0.2135 0.1343 (1.07) (53.3) (71.3) EXVOL 0.0568 –0.0341 0.1570 (3.75) (–5.73) (128.85) LOG (POP) 0.4270 0.0880 –0.0274 (2.83) (2.75) (–0.41) LOG (GDP) 0.5890 –0.6537 –0.8362 (12.4) (-34.9) (–24.04) LOG (TAX) –0.2257 0.0930 0.0789 (–7.04) (26.4) (17.4) SUMMARY STATISTICS j-statistic 35.70211 35.84797 38.02933 Instrument rank 42.00000 41.00000 40.00000 result of the data span not extending beyond 1990. 6. Concluding Remarks The purpose of this study is to examine the impact of exchange rate volatility on trade in sub-Saharan African countries. Therefore, we begin by specifying gravity model that incorporates exchange rate volatility as argu- ment. We then estimate the model using pooled OLS and GMM techniques for the period 1986-2005. Essentially, the results for aggregate trade show that exchange rate volatility tends to enhance trade in the sub-Saharan Af- rican region. This suggests that traders in the sub-region perceive increase in volatility as opportunity for profit making and thus ready to export more in the face of in- creased exchange rate volatility. The evidence reported here suggests that there is not much difference between the impact of exchange rate volatility on primary and manufactured trade as well as between ECOWAS and non-ECOWAS countries. However, the results should be interpreted with cau- tion because the history of exchange rate volatility is still very short in Sub-Saharan African countries compared to the developed countries. Therefore, its impact on the macro variables in these economies might not yet be substantial. 7. References [1] G. O. Akpokodje, “Exchange Rate Volatility and Exter- nal Trade Performance of Selected African Countries, 1973-2003,” A Ph. D Thesis Submitted to University of Ibadan, Nigeria, 2007. [2] O. Ogun, “Real Exchange Rate Movements Export Growth in Nigeria, 1960-1990,” AERC Research Paper 82, Nairobi, 1998. [3] D. Ghura and T. Grennes, “The Real Exchange Rate and Macroeconomic Performance in Sub-Saharan Africa,” Journal of Development Economic, Vol. 42, No. 2, 1993, pp. 155-174. doi:10.1016/0304-3878(93)90077-Z [4] A. Subramanian, “The Mauritian Success Story and its Lessons,” Wider Research Paper 2009/36, UNU-WIDER, Helsinki, 2009. [5] I. Bah and H. A. Amusa, “Real Exchange Rate Volatility and Foreign Trade: Evidence from South Africa’s Export to the United States,” The African Finance Journal, Vol. 5, No. 2, 2003, pp. 1-20. [6] World Bank, “World Development Indicators,” World Bank, Washinton DC, 2006. [7] E. Helpman, “Imperfect Competition and Inter National Trade: Evidence from Fourteen Indus Trial Countries,” In: M. Spence and H. Hazard, Eds., International Competi- tiveness, Cambridge, Ballinger, 1987. pp. 197-220. [8] M. D. Mckenzie, “The Impact of Exchange Rate Volatil- ity on International Trade Flows,” Journal of Economic Surveys, Vol. 13, No. 1, 1999, pp. 71-106. doi:10.1111/1467-6419.00075 [9] R. Anderton and F. Skudelny, “Exchange Rate Volatility and Euro Area Imports,” European Central Bank Work- ing Paper No. 64, 2001. [10] N. S. Ndung’u, “Liberalization of the Foreign Exchange Market and Short Term Capital Flows Problem,” AERC Research Paper 109, Nairobi, 2001. [11] D.O. Yinusa, “Exchange Rate Variability, Currency Sub- stitution and Monetary Policy in Nigeria (1986-2001),” An Unpublished Ph.D Thesis, Depart Economics, Obafemi Awolowo University, Ile-Ife, Nigeria, 2005. [12] A. Asseery and D. A. Peel, “The Effect of Exchange Rate Volatility on Export-Some New Estimates,” Economic Copyright © 2011 SciRes. ME  D. OLAYUNGBO ET AL Copyright © 2011 SciRes. ME 545 Letters, Vol. 37, 1991, pp. 173-177. doi:10.1016/0165-1765(91)90127-7 [13] M. Arellano and S. R. Bond, “Some Tests of Specifica- tion for Panel Data: Monte Carlo Evidence and an Appli- cation to Employment Equations,” Review of Economic Studies, Vol. 58, No. 2, 1991, pp. 277-297. doi:10.2307/2297968 [14] J. D. Sargan, “The Estimation of Economic Relationships Using Instrumental Variables,” Econometrica, Vol. 26, No. 3, 1958, pp. 393-415. doi:10.2307/1907619 |