

Paper Menu >>
Journal Menu >>
 Materials Sciences and Applications, 2011, 2, 1199-1204 doi:10.4236/msa.2011.29162 Published Online September 2011 (http://www.SciRP.org/journal/msa) Copyright © 2011 SciRes. MSA 1199 The Structure and the Electrical Properties of Pb0.95La0.05[ZrxTi(0.95–x)(Mo1/3,In2/3)0.05]0.9875O3 Ferroelectric Ceramics Malika Abba1, Ahmed Boutarfaia1,2* 1Laboratoire de Chimie Appliquée, Université de Biskra, RP-Biskra, Algérie; 2Département de Sciences de la Matière, Université de Ouargla, RP-Ouargla, Algérie. Email: *[email protected] Received January 30th, 2011; revised March 9th, 2011; accepted May 31st, 2011. ABSTRACT The structural, the dielectric, and the piezoelectric properties of new ferroelectric Pb0.95La0.05[Zrx,Ti(0.95–x)(Mo1/3,In2/3)0.05]0.9875O3 (0.46 x 0.55) ceramics have been investigated. All the samples were being sintered at a temperature ranging from 1000 to 1180˚C after being compacted in circular discs. The detailed structural and ferroelectric properties were carried out for sintered specimens. The results of X-ray diffraction showed that all the ceramics specimens have a perovskite phase. The phase structure of Pb0.95La0.05[ZrxTi(0.95–x)(Mo1/3, In2/3)0.05]0.9875O3 ceramics was transformed from the tetragonal to the rhombohedral, with an increase in the ratio of Zr/Ti in system. In the present system the MPB that coexists with the tetragonal and rhombo- hedral phases is a narrow composition region of x = 0.50 – 0.51. The scanning Electron Microscopy (SEM) showed an increase of the mean grain size when the sintering temperature was increased. The dielectric constant and the cou- pling factor Kp reached the maximum values, while the mechanical quality factor Qm and the loss tangent reached the lowest values when x = 0.50. For the composition where x = 0.50, these properties include = 5414 (at the Curie tem- perature), tang = 0.039, Kp = 0.67, Qm = 20 and a Curie temperature of 335˚C. Keywords: MPB, Sintering, Piezoelectric, Dielectric, Zr/Ti Ratio, Ceramic 1. Introduction The lead zirconate titanate materials Pb(ZrxTi1−x)O3 (PZT) of a perovskite-type represented by the formula ABO3, have been extensively used for the piezoelectric applica- tions such as capacitors, sensors, actuators and other high piezoelectric devices. In the PZT materials, the dielectric, the ferroelectric, and the electromechanical characteris- tics have been modified when several substitutions were being done on the A- or/and B-sites, and also by varying the ratio of Zr/Ti [1-6]. Since the discovery of the behavior of the relaxor in Pb(Mg1/3,Nb2/3)O3 [7], Pb(Zn1/3,Nb2/3)O3 [8], and Pb(Ni1/3,Nb2/3)O3 [9], the studies of the ferroelectrics of the relaxor with Pb(B’1/3, B”2/3)O3–type perovskites have attracted much attention because of their excellent dielectric and electromechanical properties. In a conventionally prepared PZT ceramics with compositions near the morpho-tropic phase bound- ary (MPB), the tetragonal, and the rhombohedral phases always coexist [9]. The width and the properties of the coexistence region are associated with the occurrence of the compositional fluctuation of Ti4+ and Zr4+ ions in the PZT materials [10]. The compositional fluctuation, which is due to a non-uniform distribution of Titanium and Zirconium ions, leads to a broad variation in the di- electric constant accompanied with a Zirconium concen- tration in the MPB region [11]. The width of this coexistence region and the structure of the PZT ceramics were greatly affected by the firing time and temperature [12]. The selection of dopants or substitutions to tailor some physical properties of PZT was based on many factors which are the following: 1) charge neutrality, 2) tolerance factors, 3) ionic radius, and 4) solubility/ miscibility. The substitution of lanthanides and the different doped material at Pb-sites and Zirconium at the Ti-sites with a different ratio of Zr/Ti have produced many solid solutions with interesting properties for wide industrial applications. The understanding of the relation- ships between the variations in the physical properties 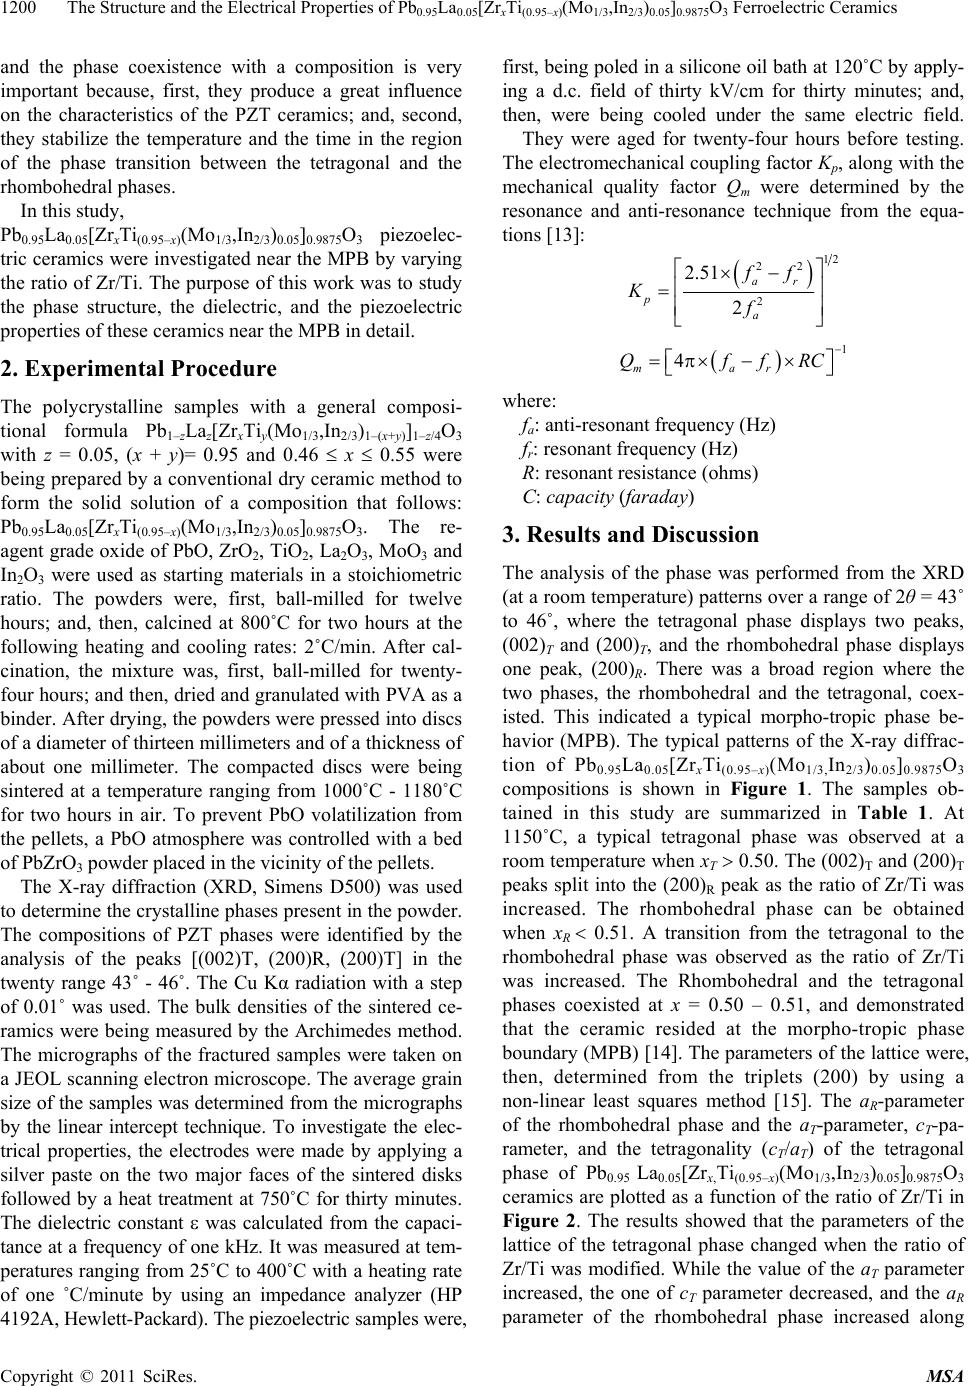 The Structure and the Electrical Properties of PbLa [Zr Ti (Mo ,In )]O Ferroelectric Ceramics 1200 0.95 0.05x(0.95–x)1/32/3 0.050.98753 and the phase coexistence with a composition is very important because, first, they produce a great influence on the characteristics of the PZT ceramics; and, second, they stabilize the temperature and the time in the region of the phase transition between the tetragonal and the rhombohedral phases. In this study, Pb0.95La0.05[ZrxTi(0.95–x)(Mo1/3,In2/3)0.05]0.9875O3 piezoelec- tric ceramics were investigated near the MPB by varying the ratio of Zr/Ti. The purpose of this work was to study the phase structure, the dielectric, and the piezoelectric properties of these ceramics near the MPB in detail. 2. Experimental Procedure The polycrystalline samples with a general composi- tional formula Pb1–zLaz[ZrxTiy(Mo1/3,In2/3)1–(x+y)]1–z/4O3 with z = 0.05, (x + y)= 0.95 and 0.46 x 0.55 were being prepared by a conventional dry ceramic method to form the solid solution of a composition that follows: Pb0.95La0.05[ZrxTi(0.95–x)(Mo1/3,In2/3)0.05]0.9875O3. The re- agent grade oxide of PbO, ZrO2, TiO2, La2O3, MoO3 and In2O3 were used as starting materials in a stoichiometric ratio. The powders were, first, ball-milled for twelve hours; and, then, calcined at 800˚C for two hours at the following heating and cooling rates: 2˚C/min. After cal- cination, the mixture was, first, ball-milled for twenty- four hours; and then, dried and granulated with PVA as a binder. After drying, the powders were pressed into discs of a diameter of thirteen millimeters and of a thickness of about one millimeter. The compacted discs were being sintered at a temperature ranging from 1000˚C - 1180˚C for two hours in air. To prevent PbO volatilization from the pellets, a PbO atmosphere was controlled with a bed of PbZrO3 powder placed in the vicinity of the pellets. The X-ray diffraction (XRD, Simens D500) was used to determine the crystalline phases present in the powder. The compositions of PZT phases were identified by the analysis of the peaks [(002)T, (200)R, (200)T] in the twenty range 43˚ - 46˚. The Cu Kα radiation with a step of 0.01˚ was used. The bulk densities of the sintered ce- ramics were being measured by the Archimedes method. The micrographs of the fractured samples were taken on a JEOL scanning electron microscope. The average grain size of the samples was determined from the micrographs by the linear intercept technique. To investigate the elec- trical properties, the electrodes were made by applying a silver paste on the two major faces of the sintered disks followed by a heat treatment at 750˚C for thirty minutes. The dielectric constant was calculated from the capaci- tance at a frequency of one kHz. It was measured at tem- peratures ranging from 25˚C to 400˚C with a heating rate of one ˚C/minute by using an impedance analyzer (HP 4192A, Hewlett-Packard). The piezoelectric samples were, first, being poled in a silicone oil bath at 120˚C by apply- ing a d.c. field of thirty kV/cm for thirty minutes; and, then, were being cooled under the same electric field. They were aged for twenty-four hours before testing. The electromechanical coupling factor Kp, along with the mechanical quality factor Qm were determined by the resonance and anti-resonance technique from the equa- tions [13]: 12 22 2 2.51 2 ar p a ff Kf 1 4 mar QffRC where: fa: anti-resonant frequency (Hz) fr: resonant frequency (Hz) R: resonant resistance (ohms) C: capacity (faraday) 3. Results and Discussion The analysis of the phase was performed from the XRD (at a room temperature) patterns over a range of 2θ = 43˚ to 46˚, where the tetragonal phase displays two peaks, (002)T and (200)T, and the rhombohedral phase displays one peak, (200)R. There was a broad region where the two phases, the rhombohedral and the tetragonal, coex- isted. This indicated a typical morpho-tropic phase be- havior (MPB). The typical patterns of the X-ray diffrac- tion of Pb0.95La0.05[ZrxTi(0.95–x)(Mo1/3,In2/3)0.05]0.9875O3 compositions is shown in Figure 1. The samples ob- tained in this study are summarized in Table 1. At 1150˚C, a typical tetragonal phase was observed at a room temperature when xT 0.50. The (002)T and (200)T peaks split into the (200)R peak as the ratio of Zr/Ti was increased. The rhombohedral phase can be obtained when xR 0.51. A transition from the tetragonal to the rhombohedral phase was observed as the ratio of Zr/Ti was increased. The Rhombohedral and the tetragonal phases coexisted at x = 0.50 – 0.51, and demonstrated that the ceramic resided at the morpho-tropic phase boundary (MPB) [14]. The parameters of the lattice were, then, determined from the triplets (200) by using a non-linear least squares method [15]. The aR-parameter of the rhombohedral phase and the aT-parameter, cT-pa- rameter, and the tetragonality (cT/aT) of the tetragonal phase of Pb0.95 La0.05[Zrx,Ti(0.95–x)(Mo1/3,In2/3)0.05]0.9875O3 ceramics are plotted as a function of the ratio of Zr/Ti in Figure 2. The results showed that the parameters of the lattice of the tetragonal phase changed when the ratio of Zr/Ti was modified. While the value of the aT parameter increased, the one of cT parameter decreased, and the aR parameter of the rhombohedral phase increased along Copyright © 2011 SciRes. MSA 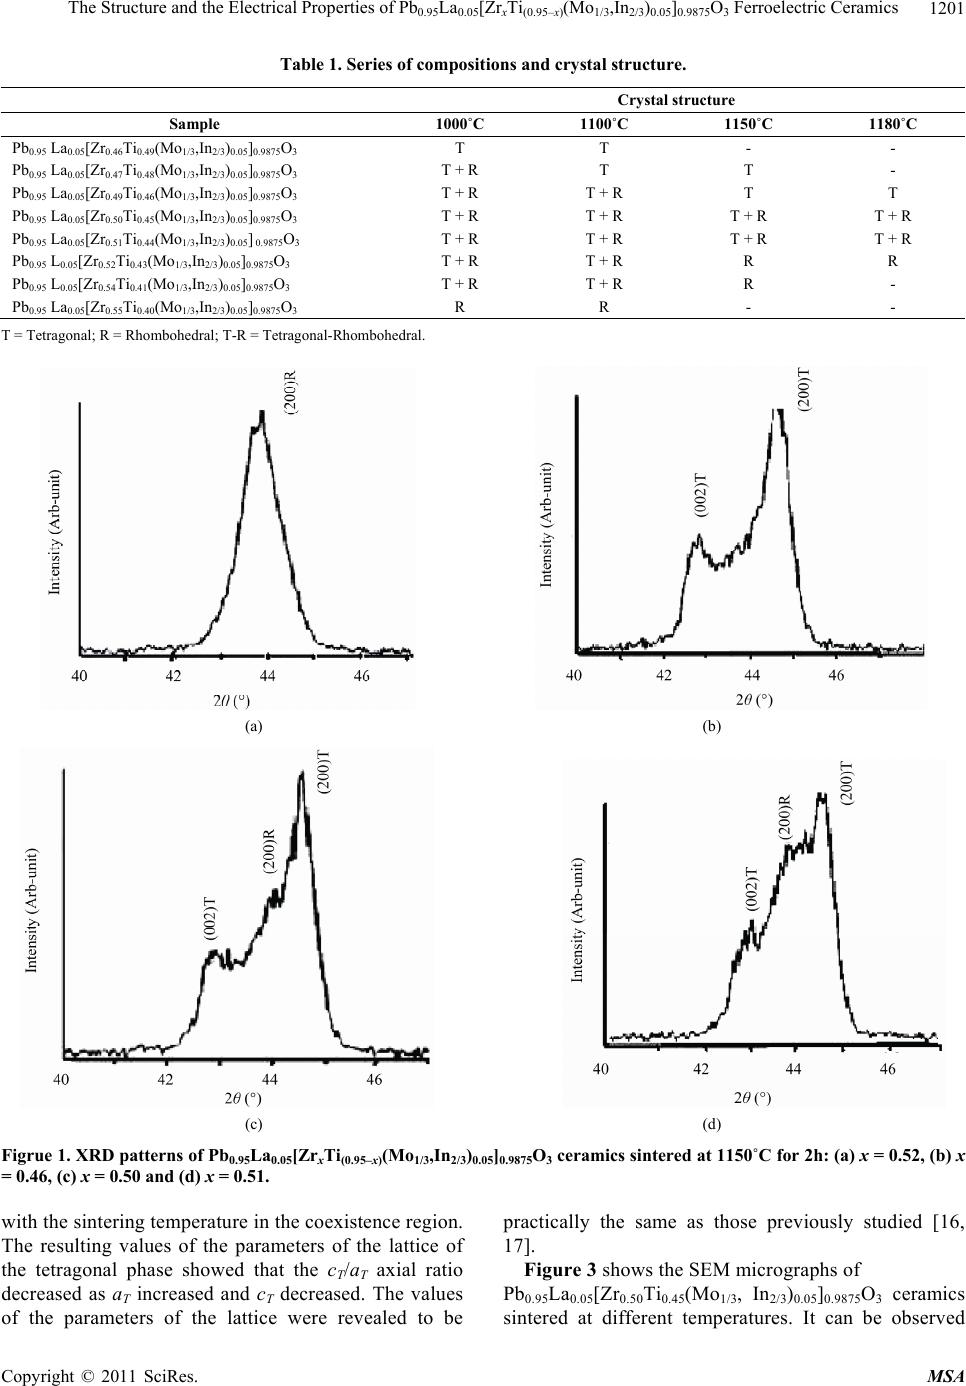 The Structure and the Electrical Properties of PbLa [Zr Ti (Mo ,In )]O Ferroelectric Ceramics 1201 0.95 0.05x(0.95–x)1/32/3 0.050.98753 Table 1. Series of compositions and crystal structure. Crystal structure Sample 1000˚C 1100˚C 1150˚C 1180˚C Pb0.95 La0.05[Zr0.46Ti0.49(Mo1/3,In2/3)0.05]0.9875O3 T T - - Pb0.95 La0.05[Zr0.47Ti0.48(Mo1/3,In2/3)0.05]0.9875O3 T + R T T - Pb0.95 La0.05[Zr0.49Ti0.46(Mo1/3,In2/3)0.05]0.9875O3 T + R T + R T T Pb0.95 La0.05[Zr0.50Ti0.45(Mo1/3,In2/3)0.05]0.9875O3 T + R T + R T + R T + R Pb0.95 La0.05[Zr0.51Ti0.44(Mo1/3,In2/3)0.05] 0.9875O3 T + R T + R T + R T + R Pb0.95 L0.05[Zr0.52Ti0.43(Mo1/3,In2/3)0.05]0.9875O3 T + R T + R R R Pb0.95 L0.05[Zr0.54Ti0.41(Mo1/3,In2/3)0.05]0.9875O3 T + R T + R R - Pb0.95 La0.05[Zr0.55Ti0.40(Mo1/3,In2/3)0.05]0.9875O3 R R - - T = Tetragonal; R = Rhombohedral; T-R = Tetragonal-Rhombohedral. (a) (b) (c) (d) Figrue 1. XRD patterns of Pb0.95La0.05[ZrxTi(0.95–x)(Mo1/3,In2/3)0.05]0.9875O3 ceramics sintered at 1150˚C for 2h: (a) x = 0.52, (b) x = 0.46, (c) x = 0.50 and (d) x = 0.51. with the sintering temperature in the coexistence region. The resulting values of the parameters of the lattice of the tetragonal phase showed that the c T/aT axial ratio decreased as aT increased and cT decreased. The values of the parameters of the lattice were revealed to be practically the same as those previously studied [16, 17]. Figure 3 shows the SEM micrographs of Pb0.95La0.05[Zr0.50Ti0.45(Mo1/3, In2/3)0.05]0.9875O3 ceramics sintered at different temperatures. It can be observed Copyright © 2011 SciRes. MSA 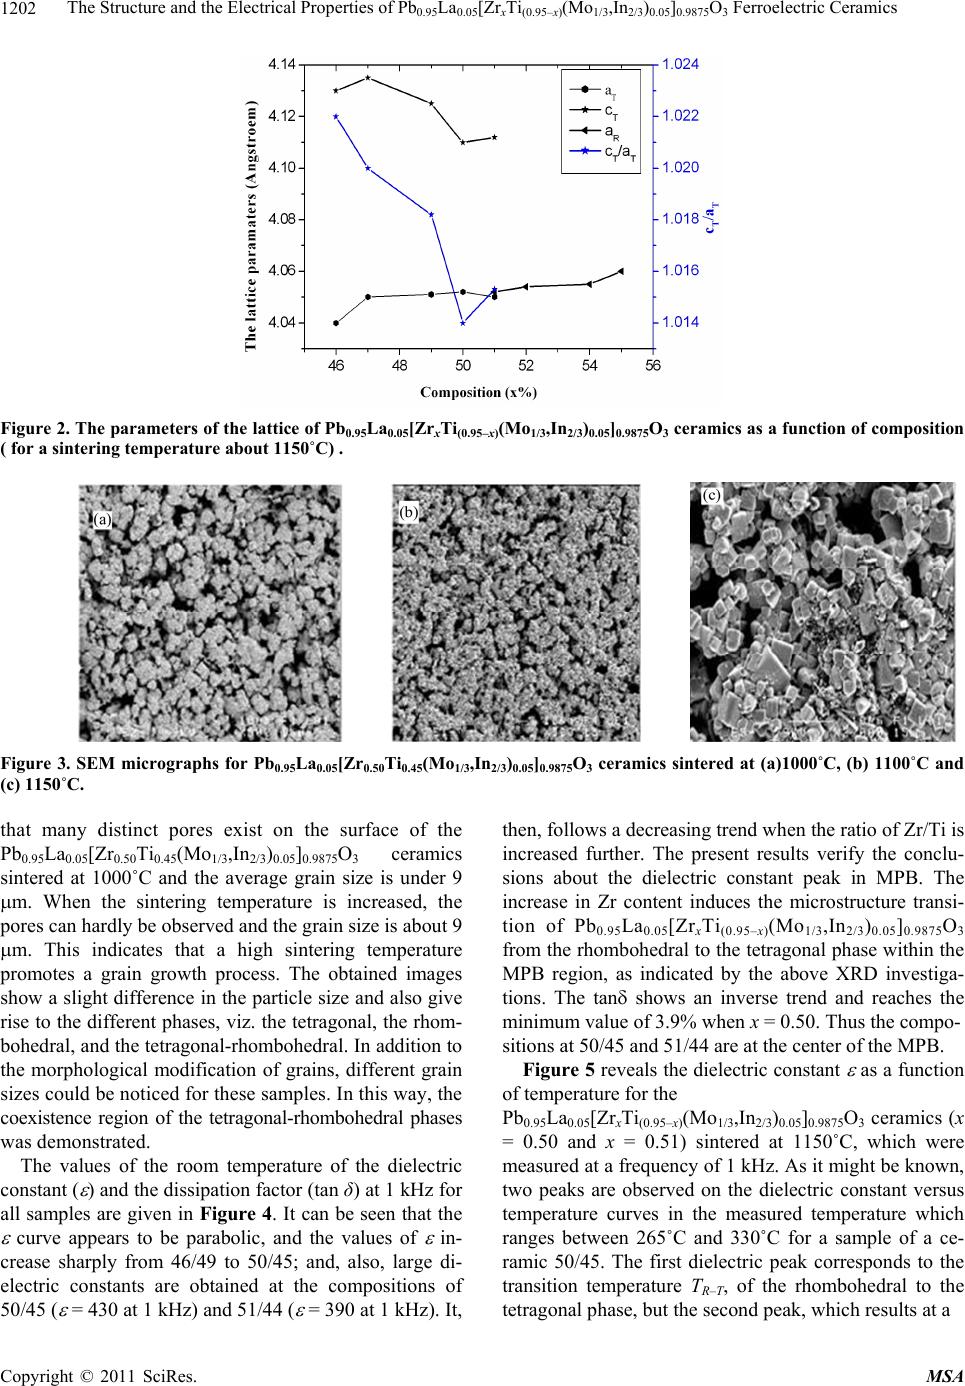 The Structure and the Electrical Properties of PbLa [Zr Ti (Mo ,In )]O Ferroelectric Ceramics 1202 0.95 0.05x(0.95–x)1/32/3 0.050.98753 Figure 2. The parameters of the lattice of Pb0.95La0.05[ZrxTi(0.95–x)(Mo1/3,In2/3)0.05]0.9875O3 ceramics as a function of composition ( for a sintering temperature about 1150˚C) . Figure 3. SEM micrographs for Pb0.95La0.05[Zr0.50Ti0.45(Mo1/3,In2/3)0.05]0.9875O3 ceramics sintered at (a)1000˚C, (b) 1100˚C and (c) 1150˚C. that many distinct pores exist on the surface of the Pb0.95La0.05[Zr0.50Ti0.45(Mo1/3,In2/3)0.05]0.9875O3 ceramics sintered at 1000˚C and the average grain size is under 9 m. When the sintering temperature is increased, the pores can hardly be observed and the grain size is about 9 m. This indicates that a high sintering temperature promotes a grain growth process. The obtained images show a slight difference in the particle size and also give rise to the different phases, viz. the tetragonal, the rhom- bohedral, and the tetragonal-rhombohedral. In addition to the morphological modification of grains, different grain sizes could be noticed for these samples. In this way, the coexistence region of the tetragonal-rhombohedral phases was demonstrated. The values of the room temperature of the dielectric constant ( ) and the dissipation factor (tan δ) at 1 kHz for all samples are given in Figure 4. It can be seen that the curve appears to be parabolic, and the values of in- crease sharply from 46/49 to 50/45; and, also, large di- electric constants are obtained at the compositions of 50/45 ( = 430 at 1 kHz) and 51/44 ( = 390 at 1 kHz). It, then, follows a decreasing trend when the ratio of Zr/Ti is increased further. The present results verify the conclu- sions about the dielectric constant peak in MPB. The increase in Zr content induces the microstructure transi- tion of Pb0.95La0.05[ZrxTi(0.95–x)(Mo1/3,In2/3)0.05]0.9875O3 from the rhombohedral to the tetragonal phase within the MPB region, as indicated by the above XRD investiga- tions. The tan shows an inverse trend and reaches the minimum value of 3.9% when x = 0.50. Thus the compo- sitions at 50/45 and 51/44 are at the center of the MPB. Figure 5 reveals the dielectric constant as a function of temperature for the Pb0.95La0.05[ZrxTi(0.95–x)(Mo1/3,In2/3)0.05]0.9875O3 ceramics (x = 0.50 and x = 0.51) sintered at 1150˚C, which were measured at a frequency of 1 kHz. As it might be known, two peaks are observed on the dielectric constant versus temperature curves in the measured temperature which ranges between 265˚C and 330˚C for a sample of a ce- ramic 50/45. The first dielectric peak corresponds to the transition temperature TR–T, of the rhombohedral to the tetragonal phase, but the second peak, which results at a Copyright © 2011 SciRes. MSA 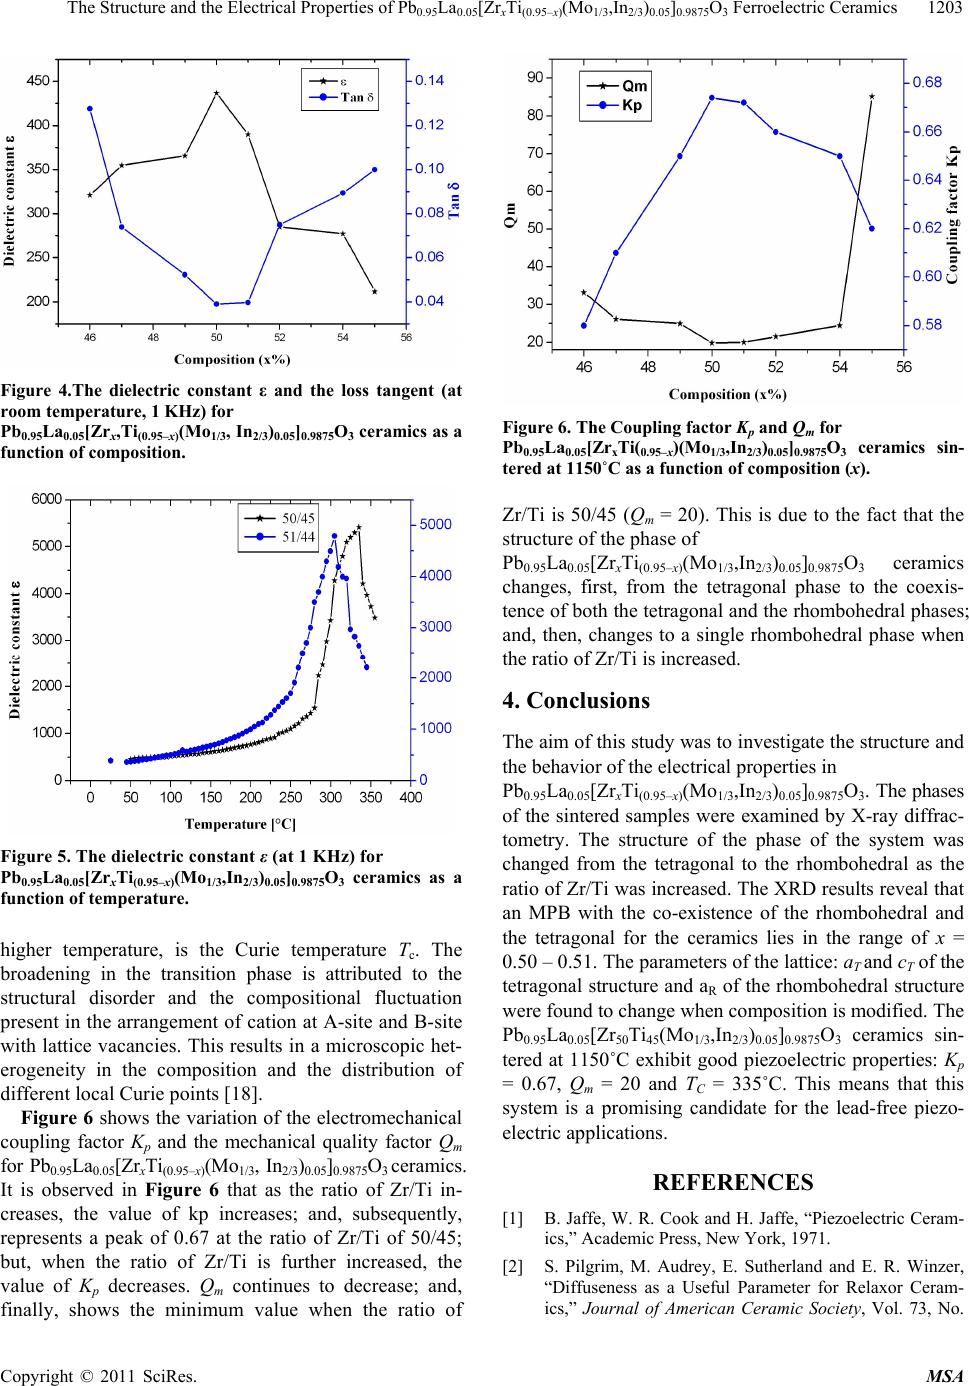 The Structure and the Electrical Properties of PbLa [Zr Ti (Mo ,In )]O Ferroelectric Ceramics1203 0.95 0.05x(0.95–x)1/32/3 0.050.98753 Figure 4.The dielectric constant ε and the loss tangent (at room temperature, 1 KHz) for Pb0.95La0.05[Zrx,Ti(0.95–x)(Mo1/3, In2/3)0.05]0.9875O3 ceramics as a function of composition. Figure 5. The dielectric constant ε (at 1 KHz) for Pb0.95La0.05[ZrxTi(0.95–x)(Mo1/3,In2/3)0.05]0.9875O3 ceramics as a function of temperature. higher temperature, is the Curie temperature Tc. The broadening in the transition phase is attributed to the structural disorder and the compositional fluctuation present in the arrangement of cation at A-site and B-site with lattice vacancies. This results in a microscopic het- erogeneity in the composition and the distribution of different local Curie points [18]. Figure 6 shows the variation of the electromechanical coupling factor Kp and the mechanical quality factor Qm for Pb0.95La0.05[ZrxTi(0.95–x)(Mo1/3, In2/3)0.05]0.9875O3 ceramics. It is observed in Figure 6 that as the ratio of Zr/Ti in- creases, the value of kp increases; and, subsequently, represents a peak of 0.67 at the ratio of Zr/Ti of 50/45; but, when the ratio of Zr/Ti is further increased, the value of Kp decreases. Qm continues to decrease; and, finally, shows the minimum value when the ratio of Figure 6. The Coupling factor Kp and Qm for Pb0.95La0.05[ZrxTi(0.95–x)(Mo1/3,In2/3)0.05]0.9875O3 ceramics sin- tered at 1150˚C as a function of composition (x). Zr/Ti is 50/45 (Qm = 20). This is due to the fact that the structure of the phase of Pb0.95La0.05[ZrxTi(0.95–x)(Mo1/3,In2/3)0.05]0.9875O3 ceramics changes, first, from the tetragonal phase to the coexis- tence of both the tetragonal and the rhombohedral phases; and, then, changes to a single rhombohedral phase when the ratio of Zr/Ti is increased. 4. Conclusions The aim of this study was to investigate the structure and the behavior of the electrical properties in Pb0.95La0.05[ZrxTi(0.95–x)(Mo1/3,In2/3)0.05]0.9875O3. The phases of the sintered samples were examined by X-ray diffrac- tometry. The structure of the phase of the system was changed from the tetragonal to the rhombohedral as the ratio of Zr/Ti was increased. The XRD results reveal that an MPB with the co-existence of the rhombohedral and the tetragonal for the ceramics lies in the range of x = 0.50 – 0.51. The parameters of the lattice: aT and cT of the tetragonal structure and aR of the rhombohedral structure were found to change when composition is modified. The Pb0.95La0.05[Zr50Ti45(Mo1/3,In2/3)0.05]0.9875O3 ceramics sin- tered at 1150˚C exhibit good piezoelectric properties: Kp = 0.67, Qm = 20 and TC = 335˚C. This means that this system is a promising candidate for the lead-free piezo- electric applications. REFERENCES [1] B. Jaffe, W. R. Cook and H. Jaffe, “Piezoelectric Ceram- ics,” Academic Press, New York, 1971. [2] S. Pilgrim, M. Audrey, E. Sutherland and E. R. Winzer, “Diffuseness as a Useful Parameter for Relaxor Ceram- ics,” Journal of American Ceramic Society, Vol. 73, No. Copyright © 2011 SciRes. MSA  The Structure and the Electrical Properties of Pb0.95La0.05[ZrxTi(0.95–x)(Mo1/3,In2/3)0.05]0.9875O3 Ferroelectric Ceramics Copyright © 2011 SciRes. MSA 1204 10, 1990, pp. 3122-3125. doi:10.1111/j.1151-2916.1990.tb06733.x [3] S. Miga and K. Wojcik, “Investigation of the Diffuse Phase Transition in PLZT X/65/35 Ceramics, X = 7 - 10,” Ferroelectrics, Vol. 100, No. 1, 1989, pp. 167-173. [4] K. L. Yadav, R. N. P. Choudhary and T. K. Chaki, “Structural, SEM and Dielectric Properties of PLZT,” Journal of Materials Science, Vol. 27, No. 19, 1992, pp. 5244-5246. doi:10.1007/BF02403823 [5] G. H. Heartling, “Piezoelectric and Electrooptic Ceram- ics,” In: R. C. Buchanan, Ed., Ceramics Materials for Electronics, Marcel Dekker, New York, 1991, pp. 139- 225. [6] H. Y. Chen, X. B. Guo and Z. Y. Meng, “Processing and Properties of PMMN-PZT Quaternary Piezoelectric Ce- ramics for Ultrasonic Motors,” Journal of Materials Chemistry and Physics, Vol. 75, No. 1-3, April 2002, pp. 202-206. [7] P. Ari-Gur and L. Benguigui, “X-Ray Study of the PZT Solid Solutions near the Morphotropic Phase Transition,” Solid State Communication, Vol. 15, No. 6, 1974, pp. 1077-1079. doi:10.1016/0038-1098(74)90535-3 [8] W. Cao and L. E. Cross, “The Ratio of Rhombohedral and Tetragonal Phases on the Morphotropic Phase Boundary in Lead Zirconate Titanate,” Journal of Applied Physics, Vol. 31, 1992, pp. 1399-1402. doi:10.1143/JJAP.31.1399 [9] K. Kakegawa, J. Mohri, X. Shrasaki and K. Takahaashi, “Sluggish Pansition Between Tetragonal and Rhombo- hedral Phases of Pb(Zr,Ti)O3,” Journal of the American Ceramic Society, Vol. 65, October 1982, pp. 515-519. doi:10.1111/j.1151-2916.1982.tb10344.x [10] A. V. Turik, M. F. Kupriyanov, E. N. Sidorenko and S. M. Zaitsev, “Behavior of Piezoceramics of type Pb(Zr,Ti)O3, near the Region of the Morphotropic Transition,” Soviet Physics-Technical Physics, Vol. 25, No. 10, 1980, pp. 1251-1254. [11] K. Kakegawa and J. Mohri, “A Compositional Fluctua- tion and Proporties of Pb(Zr,Ti)O3,” Solid State Commu- nications, Vol. 24, December 1997, pp. 769-772. [12] S. A. Mabud, “The Morphotropic Phase Boundary in PZT Solid Solution,” Journal of Applied Crystallographic, Vol. 13, 1980, pp. 211-216. [13] IEEE Standard on Piezoelectricity, IEEE Standard 176- 1978, Institute of Electrical and Electronic Engineers, New York, 1978. [14] S. Kaneko, D. Z. Dong and K. Murakami, “Effect of Si- multaneous Addition of BiFeO3 and Ba(Cu0,5W0,5)O3 on Lowering of Sintering Temperature of Pb(Zr,Ti)O3 Ce- ramics,” Journal of the American Ceramic Society, Vol. 81, April 1998, pp. 1013-1018. [15] B. D. Cullity, “Elements of X-Ray Diffraction,” Addison- Wesley Publishing Company, Inc., 1978, p. 32. [16] A. Boutarfaia, “Investigation of Co-existence Region in Lead Zirconate Titanate Solid Solutions: X-Ray Diffrac- tion Studies,” Ceramics International, Vol. 26, No. 6, 2000, pp. 583-587. doi:10.1016/S0272-8842(99)00099-1 [17] A. Boutarfaia, “Study of Solid State Reaction and the Morphotropic Phase Boundary in Pb(Zr,Ti)O3-Pb(Fe1/5,Ni1/5,Sb3/5)O3 Ceramics,” Ceramics International, Vol. 27, No. 1, 2001, pp. 91-97. doi:10.1016/S0272-8842(00)00047-X [18] M. E. Lines and A. M. Glass, “Principles Application of Ferroelectric and Related Materials,” Oxford University Press, Oxford, 1977. |