

Paper Menu >>
Journal Menu >>
 Psychology 2011. Vol.2, No.5, 433-439 Copyright © 2011 SciRes. DOI:10.4236/psych.2011.25067 Students’ Estimates of Others’ Mental Health Demonstrate a Cognitive Bias Larry D. Reid Department of Cognitive Science, Rensselaer Polytechnic Institute Troy, New York, USA. Email: [email protected] Received April 27th, 2011; revised June 13th, 2011; accepted July 24th, 2011. Students of five USA-campuses were surveyed concerning their use of prescription drugs to improve mental health. They were asked whether they had ever been prescribed medicines to treat various disorders and if they were currently taking the prescribed medicines and to estimate the percent of the students on their campus re- sponding similarly. The incidence of being prescribed and currently taking medicines for the disorders was not markedly different than what might be expected from knowing published incidence rates. The students’ esti- mates of their fellow students’ rates of being prescribed and currently taking the medicines was considerably, sometimes dramatically, larger than the actual rates. Further testing rejected some potential explanations of the tendency to make overestimations. The conclusion was eventually drawn that the tendency to overestimate the mental distress of fellow students was a special case of superiority bias and had features of an implicit social cognition enhancing their own self-esteem. Keywords: College Stude n t s , Prescription Drugs, Illusory Superi ority, Depression, Implicit Social Cognition Introduction As a result of discussions with undergraduates, I learned that some students had a very distorted view of their fellow stu- dents’ use of prescribed medicines for the treatment of depres- sion and attention deficit/hyperactivity disorder (ADHD). To see how widespread those views were, a questionnaire was distributed asking students if they had ever been prescribed medicines for treating a number of psychiatric disorders. They were also asked to estimate the percent of the students at their university that had been prescribed the same medicines. Their answers provided an index of the actual incidence of having been prescribed a kind of medicine as well as students’ esti- mates of the percent of students that had been prescribed those medicines. The results indicated that the proportion of the sam- ple that had received a prescription for the disorders was similar to reported incidences of the disorders in national surveys (for a more recent survey see, e.g., Olfson & Marcus, 2009) or diag- nostic and statistical manuals (e.g., American Psychiatric Asso- ciation, 2000). The students’ estima te s of the proportion of the i r fellow students who had received prescriptions were much larger than the actual number. The results were, from my per- spective, so peculiar that I merely set them aside. Yet, further discussions with students continued to confirm that they had, on average, a distorted view of the mental health status of their fellow students. About six years after the first survey, another was developed that focused on the incidence of being prescribed a medicine for six disorders. This one was answered by students at five American colleges or universities. This article begins with a summary of their answers. As will be seen, the students clearly, and often dramatically, overestimated the use of prescribed medicines for the disorders. One idea germane to the issue of American students’ overes- timation of their fellow students’ use of prescription medicines is related to the idea that Americans are exposed to consider- able advertising in an attempt to get them to ask health care providers to prescribe a medicine. A test of the idea that adver- tising is germane is to compare the estimates of college students from a country that does not allow advertising to induce use of prescription medicines to the estimates from colleges in the USA. Consequently, students from a university in Singapore were asked to take the same survey as the one given to Ameri- can students. These students, who are not as exposed to adver- tising of prescription drugs, also overestimated the incidence of their fellow students’ use of the drugs, thereby, providing no support for the idea that exposure to TV-ads was germane. Because the results indicated that students have a very pes- simistic opinion concerning their fellows’ use of prescription drugs for mental health problems, I wondered if their pessi- mism was confined to drug-use or, perhaps, a pessimism con- cerning the actual status of their fellows’ mental health. I took advantage of work we were doing concerning the development of ways of measuring prevailing moods to get relevant data. First students were asked to describe their prevailing mood on a scale with anchors of very depressed to very happy. They were then asked to estimate the percent of students on their campus who were very depressed and very happy. There was a marked overestimation of the incidence of depression. They also underestimated the number of students who were very happy. The question that comes into focus is: Why do students have a markedly distorted view of their fellow students’ mental health? An answer is offered as the results are discussed. Methods The American students taking the survey about prescription 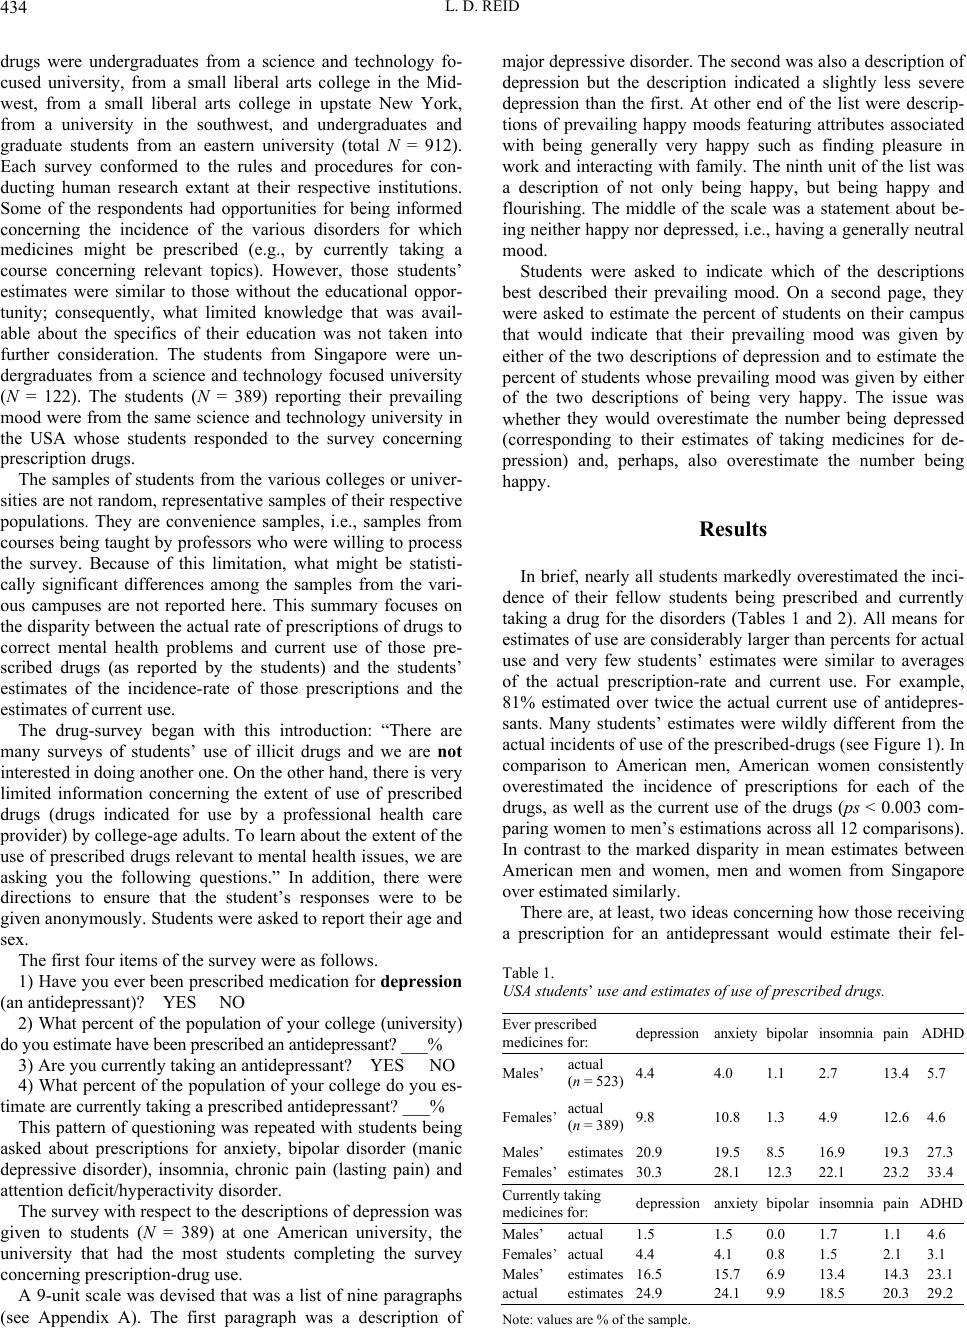 L. D. REID 434 drugs were undergraduates from a science and technology fo- cused university, from a small liberal arts college in the Mid- west, from a small liberal arts college in upstate New York, from a university in the southwest, and undergraduates and graduate students from an eastern university (total N = 912). Each survey conformed to the rules and procedures for con- ducting human research extant at their respective institutions. Some of the respondents had opportunities for being informed concerning the incidence of the various disorders for which medicines might be prescribed (e.g., by currently taking a course concerning relevant topics). However, those students’ estimates were similar to those without the educational oppor- tunity; consequently, what limited knowledge that was avail- able about the specifics of their education was not taken into further consideration. The students from Singapore were un- dergraduates from a science and technology focused university (N = 122). The students (N = 389) reporting their prevailing mood were from the same science and technology university in the USA whose students responded to the survey concerning prescription drugs. The samples of students from the various colleges or univer- sities are not random, representative samples of their respective populations. They are convenience samples, i.e., samples from courses being taught by professors who were willing to process the survey. Because of this limitation, what might be statisti- cally significant differences among the samples from the vari- ous campuses are not reported here. This summary focuses on the disparity between the actual rate of prescriptions of drugs to correct mental health problems and current use of those pre- scribed drugs (as reported by the students) and the students’ estimates of the incidence-rate of those prescriptions and the estimates of current use. The drug-survey began with this introduction: “There are many surveys of students’ use of illicit drugs and we are not interested in doing another one. On the other hand, there is very limited information concerning the extent of use of prescribed drugs (drugs indicated for use by a professional health care provider) by college-age adults. To learn about the extent of the use of prescribed drugs relevant to mental health issues, we are asking you the following questions.” In addition, there were directions to ensure that the student’s responses were to be given anonymously. Students were asked to report their age and sex. The first four items of the survey were as follows. 1) Have you ever been prescribed medication for depression (an antidepressant)? YES NO 2) What percent of the population of your college (university) do you estimate have been prescribed an antidepressant? ___% 3) Are you currently taking an antidepressant? YES NO 4) What percent of the population of your college do you es- timate are currently taking a prescribed antidepressant? ___% This pattern of questioning was repeated with students being asked about prescriptions for anxiety, bipolar disorder (manic depressive disorder), insomnia, chronic pain (lasting pain) and attention deficit/hyperactivity disorder. The survey with respect to the descriptions of depression was given to students (N = 389) at one American university, the university that had the most students completing the survey concerning prescription-drug use. A 9-unit scale was devised that was a list of nine paragraphs (see Appendix A). The first paragraph was a description of major depressive disorder. The second was also a description of depression but the description indicated a slightly less severe depression than the first. At other end of the list were descrip- tions of prevailing happy moods featuring attributes associated with being generally very happy such as finding pleasure in work and interacting with family. The ninth unit of the list was a description of not only being happy, but being happy and flourishing. The middle of the scale was a statement about be- ing neither happy nor depressed, i.e., having a generally neutral mood. Students were asked to indicate which of the descriptions best described their prevailing mood. On a second page, they were asked to estimate the percent of students on their campus that would indicate that their prevailing mood was given by either of the two descriptions of depression and to estimate the percent of students whose prevailing mood was given by either of the two descriptions of being very happy. The issue was whether they would overestimate the number being depressed (corresponding to their estimates of taking medicines for de- pression) and, perhaps, also overestimate the number being happy. Results In brief, nearly all students markedly overestimated the inci- dence of their fellow students being prescribed and currently taking a drug for the disorders (Tables 1 and 2). All means for estimates of use are considerably larger than percents for actual use and very few students’ estimates were similar to averages of the actual prescription-rate and current use. For example, 81% estimated over twice the actual current use of antidepres- sants. Many students’ estimates were wildly different from the actual incidents of use of the prescribed-drugs (see Figure 1). In comparison to American men, American women consistently overestimated the incidence of prescriptions for each of the drugs, as well as the current use of the drugs (ps < 0.003 com- paring women to men’s estimations across all 12 comparisons). In contrast to the marked disparity in mean estimates between American men and women, men and women from Singapore over estimat e d similarly. There are, at least, two ideas concerning how those receiving a prescription for an antidepressant would estimate their fel- Table 1. USA students’ use and estimates of use of prescribed drugs. Ever prescribed medicines for : depression anxiety bipolar insomniapainADHD Males’ actual (n = 523)4.4 4.0 1.1 2.7 13.45.7 Females’ actual (n = 389)9.8 10.8 1.3 4.9 12.64.6 Males’ estimates20.9 19.5 8.5 16.9 19.327.3 Females’estimates30.3 28.1 12.3 22.1 23.233.4 Currently taking medicines for : depressionanxiety bipolar insomniapainADHD Males’ actual 1.5 1.5 0.0 1.7 1.1 4.6 Females’actual 4.4 4.1 0.8 1.5 2.1 3.1 Males’ estimates16.5 15.7 6.9 13.4 14.323.1 actual estimates24.9 24.1 9.9 18.5 20.329.2 Note: val ues are % of the sample. 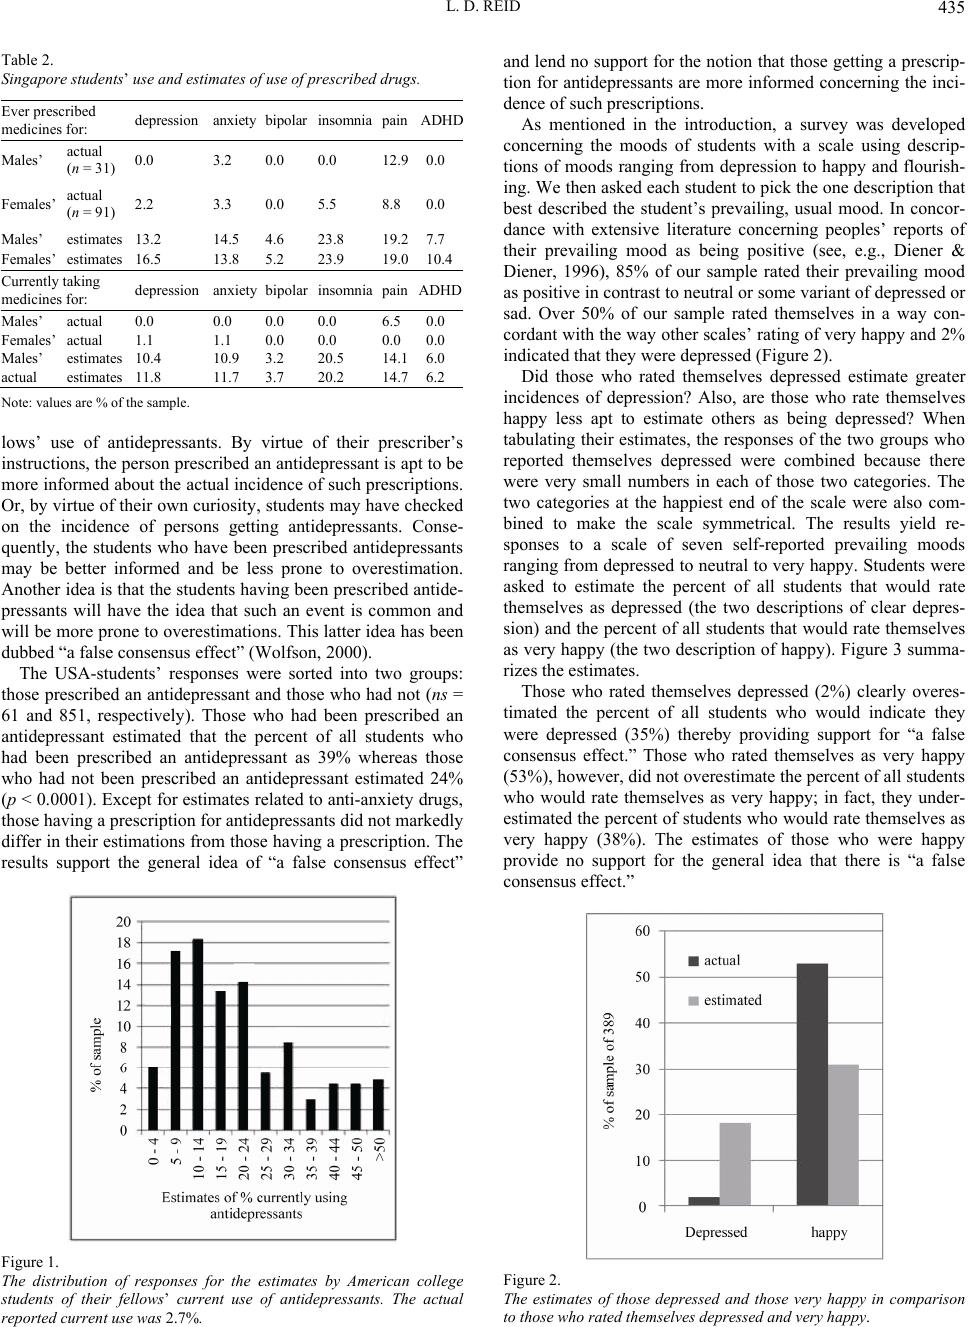 L. D. REID 435 Table 2. Singapore students’ u s e a n d e s t i m a t e s o f u s e o f p r e s c r i b e d d r u g s . Ever prescribed medicines for : depression anxietybipolar insomnia painADHD Males’ actual (n = 31) 0.0 3.2 0.0 0.0 12.90.0 Females’ actual (n = 91) 2.2 3.3 0.0 5.5 8.8 0.0 Males’ estimates 13.2 14.5 4.6 23.8 19.27.7 Females’ estimates 16.5 13.8 5.2 23.9 19.010.4 Currently taking medicines for : depression anxiety bipolar insomnia painADHD Males’ actual 0.0 0.0 0.0 0.0 6.5 0.0 Females’ actual 1.1 1.1 0.0 0.0 0.0 0.0 Males’ estimates 10.4 10.9 3.2 20.5 14.16.0 actual estimates 11.8 11.7 3.7 20.2 14.76.2 Note: val ues are % of the sample. lows’ use of antidepressants. By virtue of their prescriber’s instructions, the person prescribed an antidepressant is apt to be more informed about the actual incidence of such prescriptions. Or, by virtue of their own curiosity, students may have checked on the incidence of persons getting antidepressants. Conse- quently, the students who have been prescribed antidepressants may be better informed and be less prone to overestimation. Another idea is that the students having been prescribed antide- pressants will have the idea that such an event is common and will be more prone to overestimations. This latter idea has been dubbed “a false consensus effect” (Wolfson, 2000). The USA-students’ responses were sorted into two groups: those prescribed an antidepressant and those who had not (ns = 61 and 851, respectively). Those who had been prescribed an antidepressant estimated that the percent of all students who had been prescribed an antidepressant as 39% whereas those who had not been prescribed an antidepressant estimated 24% (p < 0.0001). Except for estimates related to anti-anxiety drugs, those having a prescription for antidepressants did not markedly differ in their estimations from those having a prescription. The results support the general idea of “a false consensus effect” Figure 1. The distribution of responses for the estimates by American college students of their fellows’ current use of antidepressants. The actual reported current use was 2.7%. and lend no support for the notion that those getting a prescrip- tion for antidepressants are more informed concerning the inci- dence of such prescriptions. As mentioned in the introduction, a survey was developed concerning the moods of students with a scale using descrip- tions of moods ranging from depression to happy and flourish- ing. We then asked each student to pick the one description that best described the student’s prevailing, usual mood. In concor- dance with extensive literature concerning peoples’ reports of their prevailing mood as being positive (see, e.g., Diener & Diener, 1996), 85% of our sample rated their prevailing mood as positive in contrast to neutral or some variant of depressed or sad. Over 50% of our sample rated themselves in a way con- cordant with t he way other scales’ rating of very happy and 2% indicated that they were depressed (Figure 2). Did those who rated themselves depressed estimate greater incidences of depression? Also, are those who rate themselves happy less apt to estimate others as being depressed? When tabulating their estimates, the responses of the two groups who reported themselves depressed were combined because there were very small numbers in each of those two categories. The two categories at the happiest end of the scale were also com- bined to make the scale symmetrical. The results yield re- sponses to a scale of seven self-reported prevailing moods ranging from depressed to neutral to very happy. Students were asked to estimate the percent of all students that would rate themselves as depressed (the two descriptions of clear depres- sion) and the percent of all students that would rate themselves as very happy (the two description of happy). Figure 3 summa- rizes the estimates. Those who rated themselves depressed (2%) clearly overes- timated the percent of all students who would indicate they were depressed (35%) thereby providing support for “a false consensus effect.” Those who rated themselves as very happy (53%), however, did not overestimate the percent of all students who would rate themselves as very happy; in fact, they under- estimated the percent of students who would rate themselves as very happy (38%). The estimates of those who were happy provide no support for the general idea that there is “a false consensus effect.” Figure 2. The estimates of those depressed and those very happy in comparison to those who rated themselves depr es s ed a n d ve ry ha pp y. 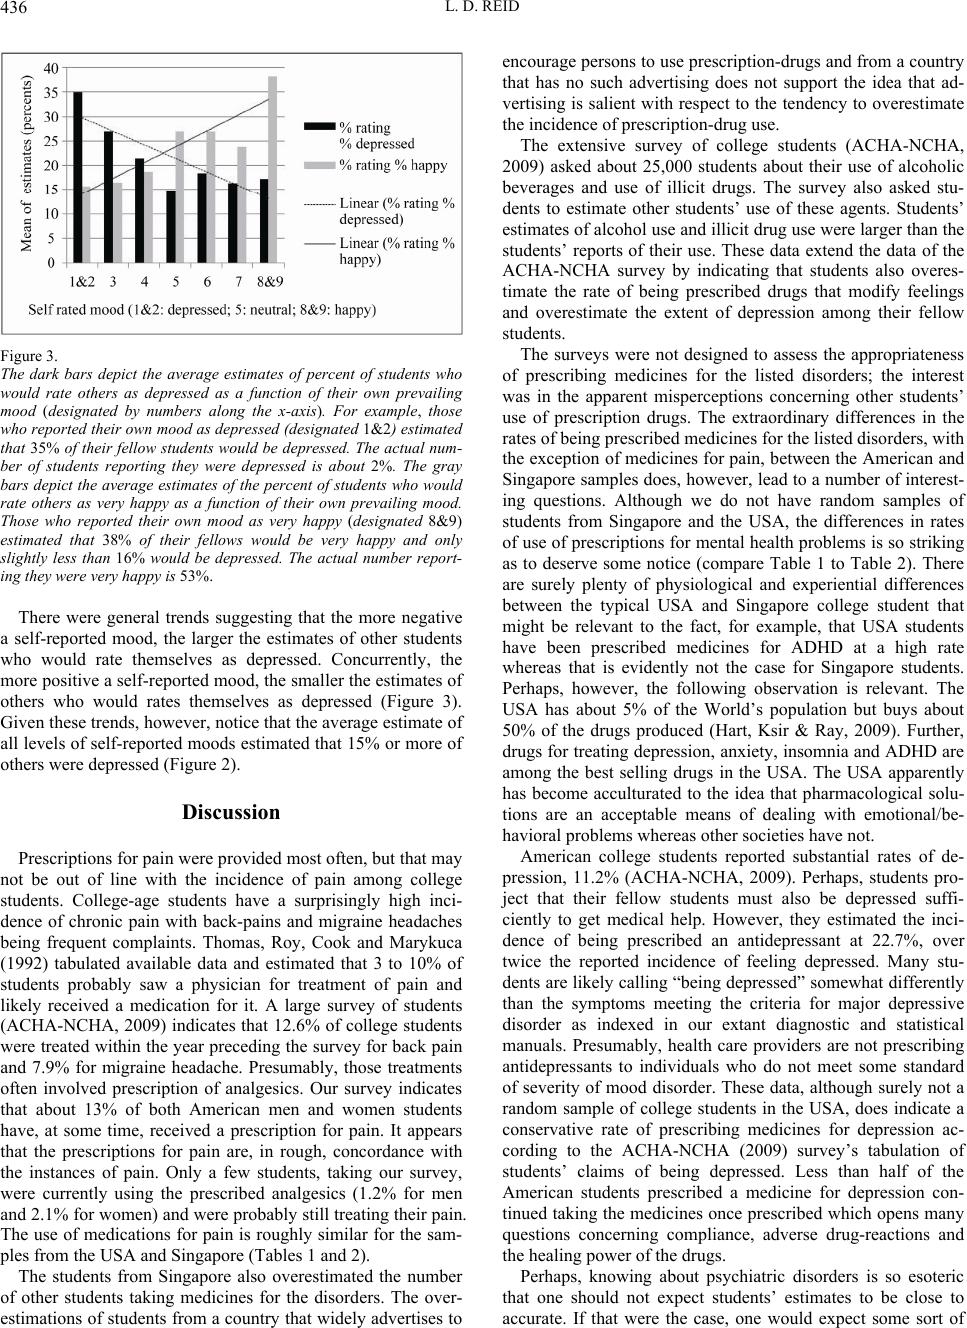 L. D. REID 436 Figure 3. The dark bars depict the average estimates of percent of students who would rate others as depressed as a function of their own prevailing mood (designated by numbers along the x-axis). For example, those who reported their own mood as depressed (designated 1&2) estimated that 35% of their fellow students would be depressed. The actual num- ber of students reporting they were depressed is about 2%. The gray bars depict the average estimates of the percent of students who would rate others as very happy as a function of their own prevailing mood. Those who reported their own mood as very happy (designated 8&9) estimated that 38% of their fellows would be very happy and only slightly less than 16% would be depressed. The actual number report- ing they were very happy is 53%. There were general trends suggesting that the more negative a self-reported mood, the larger the estimates of other students who would rate themselves as depressed. Concurrently, the more positive a self-reported mood, the smaller the estimates of others who would rates themselves as depressed (Figure 3). Given these trends, however, notice that the average estimate of all levels of self-reported moods estimated that 15% or more of others were depressed (Figure 2). Discussion Prescriptions for pain were provided most often, but that may not be out of line with the incidence of pain among college students. College-age students have a surprisingly high inci- dence of chronic pain with back-pains and migraine headaches being frequent complaints. Thomas, Roy, Cook and Marykuca (1992) tabulated available data and estimated that 3 to 10% of students probably saw a physician for treatment of pain and likely received a medication for it. A large survey of students (ACHA-NCHA, 2009) indicates that 12.6% of college students were treated within the year preceding the survey for back pain and 7.9% for migraine headache. Presumably, those treatments often involved prescription of analgesics. Our survey indicates that about 13% of both American men and women students have, at some time, received a prescription for pain. It appears that the prescriptions for pain are, in rough, concordance with the instances of pain. Only a few students, taking our survey, were currently using the prescribed analgesics (1.2% for men and 2.1% for women) and were probably still treating their pain. The use of medications for pain is roughly similar for the sam- ples from the USA and Singapore (Tables 1 and 2). The students from Singapore also overestimated the number of other students taking medicines for the disorders. The over- estimations of students from a country that widely advertises to encourage persons to use prescription-drugs and from a country that has no such advertising does not support the idea that ad- vertising is salient with respect to the tendency to overestimate the incidence of prescription-d r ug use. The extensive survey of college students (ACHA-NCHA, 2009) asked about 25,000 students about their use of alcoholic beverages and use of illicit drugs. The survey also asked stu- dents to estimate other students’ use of these agents. Students’ estimates of alcohol use and illicit drug use were larger than the students’ reports of their use. These data extend the data of the ACHA-NCHA survey by indicating that students also overes- timate the rate of being prescribed drugs that modify feelings and overestimate the extent of depression among their fellow students. The surveys were not designed to assess the appropriateness of prescribing medicines for the listed disorders; the interest was in the apparent misperceptions concerning other students’ use of prescription drugs. The extraordinary differences in the rates of being prescribed medicines for the listed disorders, with the exception of medicines for pain, between the American and Singapore samples does, however, lead to a number of interest- ing questions. Although we do not have random samples of students from Singapore and the USA, the differences in rates of use of prescriptions for mental health problems is so striking as to deserve some notice (compare Table 1 to Table 2). There are surely plenty of physiological and experiential differences between the typical USA and Singapore college student that might be relevant to the fact, for example, that USA students have been prescribed medicines for ADHD at a high rate whereas that is evidently not the case for Singapore students. Perhaps, however, the following observation is relevant. The USA has about 5% of the World’s population but buys about 50% of the drugs produced (Hart, Ksir & Ray, 2009). Further, drugs for treating depression, anxiety, insomnia and ADHD are among the best selling drugs in the USA. The USA apparently has become acculturated to the idea that pharmacological solu- tions are an acceptable means of dealing with emotional/ be- havioral problems whereas other societies have not. American college students reported substantial rates of de- pression, 11.2% (ACHA-NCHA, 2009). Perhaps, students pro- ject that their fellow students must also be depressed suffi- ciently to get medical help. However, they estimated the inci- dence of being prescribed an antidepressant at 22.7%, over twice the reported incidence of feeling depressed. Many stu- dents are likely calling “being depressed” somewhat differently than the symptoms meeting the criteria for major depressive disorder as indexed in our extant diagnostic and statistical manuals. Presumably, health care providers are not prescribing antidepressants to individuals who do not meet some standard of severity of mood disorder. These data, although surely not a random sample of college students in the USA, does indicate a conservative rate of prescribing medicines for depression ac- cording to the ACHA-NCHA (2009) survey’s tabulation of students’ claims of being depressed. Less than half of the American students prescribed a medicine for depression con- tinued taking the medicines once prescribed which opens many questions concerning compliance, adverse drug-reactions and the healing power of the drugs. Perhaps, knowing about psychiatric disorders is so esoteric that one should not expect students’ estimates to be close to accurate. If that were the case, one would expect some sort of  L. D. REID 437 random set of estimates; but, that did not occur. There was a consistent trend toward overestimation, indeed, even extreme overestimation. Further, the estimates roughly follow a pattern with estimates for the least prevalent disorder being estimated as having the least incidence. The idea that they just are not aware of prescription drug-use and, therefore, are just making unfounded guesses is not supported by the survey of moods. The descriptions were straightforward and simple and students readily judged their own mood. They, however, were far from accurate in guessing the percent of other students’ ratings of themselves. The students’ estimates are not unfounded in the sense of being random, but seem to be founded in something similar to prejudice; other students are just judged to be less healthy, less happy than they are. The data were collected during a period of extremely diffi- cult economic circumstances. One wonders if the pessimistic prevailing view of their fellow students’ mental health reflects a prevailing pessimistic view of the extant circumstances in the USA. The survey done 6 years before this one found the same degree of overestimation, yet it was during better economic times. In some games of trust, it is profitable to trust that ot hers will be equitable and seemingly fair. Most persons do respond equi- tably. When, however, asked to estimate the percent of persons that can be trusted to be equitable, they underestimated the level of trust, i.e., they seemingly believe that they are more generous and trustworthy than their fellows (Fetchenhauer & Dunning, 2010). Students’ estimates of trust and their estimates of the mental health of their fellow students might be a mani- festation of a similar process. Among those studying the relationship between cognitions (e.g., beliefs or memories) associated with depression, there is considerable support for the idea that those who are depressed have a bias that colors their beliefs and memories (e.g., Hertel & Brozovich, 2010; Mathews & MacLeod, 2005). In situations reported here, we asked people to estimate the prevalence of being prescribed medicines for mental disorders and the preva- lence of moods (including depression). Presumably, those esti- mates reflect cognitive habits (beliefs, attitudes, biases that become manifest in situations of ambiguity). These data add to that literature. The data support the notion that depressed peo- ple have a negative bias whereas happy people have less of a negative bias. Further, the data indicate that the relationship has a “dose-response” characteristic, the greater the severity of depression the greater the bias toward negative opinions. Inter- estingly, however, even the happiest severely overestimated the prevalence of depression. The generalization is that students generally think poorly of their contemporaries (a negative bias toward persons not exactly strangers but not their closest asso- ciates either). Being happy does not eliminate the general ten- dency to overestimate the prevalence of depression, but it does seem to prevent the estimates from being extremely off of the mark. The idea of “a false consensus effect” was not supported by the estimates of the very happy as they estimated the rates of all students’ happiness. Rather than concluding that persons tend to overestimate their own circumstance, it seems more correct to say that persons tend to estimate that others are less mentally healthy, less trustworthy, more likely to use drugs and exten- sive use of alcoholic beverages and probably a number of less favorable characteristics. The research started with a simple question: do more than a few students on one college campus have a markedly distorted few of the use of prescription-drugs for mental health? The answer is yes. Because similar surveys were given six years apart, the results do not seem to be peculiar to one specific time. The next question was: were the distorted views observed on one campus peculiar to that campus? The answer is no. The next question was: were the distorted views related to the American practice, which is rare in the World, of advertising for prescription drugs. The answer is probably not. The next question was: was the distorted view, the bias, peculiar to drug-use? The answer is no, students distort the incidence of depression as well as the incidence of use of prescription-drugs. The data support the idea that there is a pervasive cognitive bias. The bias is similar to the superiority bias that has attracted considerable attention among social psychologists. The superi- ority bias, however, is a conclusion (derived from some rather simple experiments but bolstered by confirmatory data) that people have an almost inherent bias that distorts their view toward believing that they are better than average. Garrison Keillor’s characterization of the folks in his fic- tional home town (Lake Wobegon) as “all the women are strong, all the men are good looking, and all the children are above average” has provided a colorful label, the Lake Wobe- gon Effect, for what social psychologists have called illusory superiority, superiority bias or a sense of relative superiority. The illusory superiority is a pervasive tendency to overestimate one’s achievement, characteristics and capabilities in relation to others or to overestimate the better qualities of one’s own group. This cognitive bias is, indeed, pervasive and can be demon- strated in a wide range of circumstances (Illusory superiority, 2011) or as Harris (2010) said “there is nothing more common than the belief that one is above average in intelligence, wis- dom, honesty, etc.” (p. 188). Because a superiority bias is rarely founded in fact, there is cognitive dissonance associated with sustaining it. Flattery might support the idea of superiority, hence be welcome a nd also b e a potential reason why flattery is remarkably effect in influencing people even when it is an ob- vious ploy. The students made prejudicial judgments that are unflattering and often grossly wrong. One might surmise that such judg- ments follow from the Lake Wobegon Effect hence might be labeled Lake Wobegon Effect prejudice or merely Wobegon Prejudice. Wobegon Prejudice is the tendency to attribute nega- tive attributes to others supposedly to sustain the belief that “I and mine are superior.” Wobegon Prejudice has its own kind of logic: “If I am better than the average person (i.e., most others), most of them must be worse than me.” If the superiority bias in nearly universal, and many believe that it is, and it is accompanied by Wobegon Prejudice, the tendencies inherent to such a cognitive bias helps explain why someone would denigrate persons or groups that they have never interacted with or never met. It is not about the others, it is about a threat to illusory superiority. The superiority bias makes problematic prejudices, such as racism, likely. The idea of a Lake Wobegon Prejudice seems to be somewhat different than the kinds of prejudice enumerated by the classic discussion of the sources of prejudice (Duckitt, 1992). The students’ re- sponses are not overtly prejudicial; they seem to be more akin to an implicit social cognition in support of their own self-esteem or a superiority bias (Greenwald & Banaji, 1995).  L. D. REID 438 Although the research was done to merely try to understand the gross overestimation of college students’ estimates of their fellow students use of psychopharmacological drugs, the find- ings provide strong support for the almost universal prevalence of a cognitive social bias, whether that be called Lake Wobegon Prejudice, the inverse of a superiority bias, or an implicit social cognition in service of self-esteem. Characterizing the overestimations of other’s difficulties as a process of a superiority bias also makes some sense of why persons become so upset and so defensive when facts are stated indicating their group is not superior, and their country is not exceptional (Hornsey, 2003). In reality, the stated facts are not threatening (to know that many countries have a better health care system, does not, in fact, make one’s own health care sys- tem any better or worse), but the stated facts may impinge upon one’s illusionary superiority and, thereby, becomes a threat. Threats are usually met with something akin to hostility. As Ashdown, Gibbons, Hackathorn, and Harvey (2011) sta- ted, Social Identity Theory posits that in-group sympathies often lead to out-group derogation which, in turn, increase the risk of discrimination against the out-group. Ashdown et al. go on to say “If one follows the logic of Social Identity Theory that in-group sympathies will often lead to out-group deroga- tion, then prejudice, racism, and discrimination can be ex- plained in terms of simple group dynamics” (p. 78). Their hy- pothesis that in-group sympathies will often lead to out-group derogation is similar to my pointing out that if individuals be- lieve that they are superior to others than it logically follows that others are somehow inferior (Wobegon Prejudice). The findings presented here indicate that it is not necessary for one to have a specific out-group to reference to have a cognitive bias with regard to others; one just has to sustain a superiority bias to be at risk for prejudice. One of the major findings of recent investigations centered about the study of happiness, within the context of the broader positive psychology approach, is that most people rate them- selves as happy. Further, there seems to be a marked resistance to the acceptance of that fact. The finding is that “most people are happy, and most people do not acknowledge that.” Perhaps, the knowledge that most people are happy is dissonant with a superiority bias and leads to the implicit social cognition: “If I am better than the average person, and if I am happy, then most others must be unhappy.” Acknowledgments The following colleagues were instrumental in accumulating the data reported here and provided interesting discussions concerning the outcomes. Thank you Monica Amin, Rebecca P. Ang, MaryAnn Bush, Daniel Calcagnetti, Ryan Callery, Sa- matha Cheong, Tamir Dannon, Christopher Hubbell, James Hunsicker, Nikki Johnson, David Pukalski, Larry Sensenig, and Meta Reid. References Ashdown, B. K., Gibbons J. L., Hackathorn J., & Harvey R. D. (2011). The influence of social and individual variables on ethnic attitudes in Guatemala. Psychology, 2, 78-84. doi:10.4236/psych.2011.22013 ACHA-NCHA. (2009). American College Health Association-National College Health Assessment spring 2008 reference group data report (abridged). Journ al of American College Health, 57, 477-488. doi:10.3200/JACH.57.5.477-488 American Psychiatric Association (2000). Diagnostic and statistical manual of mental disorders (4th ed., text revision). Washington, DC: American Psychiatric Association. Diener E., & Diener C. (1996). Most people are happy. Psychological Science, 7, 181-185. doi:10.1111/j.1467-9280.1996.tb00354.x Duckitt, J. (1992). Psychology and prejudice: A historical analysis and integrative framework. American Psychologist, 47, 1182-1193. doi:10.1037/0003-066X.47.10.1182 Fetchenhauer, D., & Dunning, D. (2010). Why so cynical?: Asymmet- ric feedback underlies misguided skepticism regarding the trustwor- thiness of others. Psyc h o lo g i c a l S c ie nce, 21, 189-193. doi:10.1177/0956797609358586 Greenwald, A. G., & Banaji, M. R. (1995). Implicit social cognition: Attitudes, self-esteem and stereotypes. Psychological Review, 102, 4-27. doi:10.1037/0033-295X.102.1.4 Hart, C. L., Ksir C., & Ray O. S. (2009). Drugs, society and human behavior (13th ed.). New York, NY: McGraw-Hill. Harris, S. (2010). The moral landscape: How science can determine human values. New York, NY: Free Press. Hertel, P. T., & Brozovich, F. (2010). Cognitive habits and memory distortions in anxiety and depression. Psychological Science, 19, 155-160. doi:10.1177/0963721410370137 Hornsey, M. J. (2003). Linking superiority bias in the interpersonal and intergroup domains. Journal of Soc ial Psychology, 143, 479- 491. doi:10.1080/00224540309598457 Illusory superiority. (2011). In Wikipedia, The Free Encyclopedia. URL (last checked 7 February 201 1) http://en.wikipedia.org/w/index.php?title=Illusorysuperiority&oldid= 412267846 Mathews, A., & MacLeod, C. (2005). Cognitive vulnerability to emo- tional disorders. Annu al Review of Clinical Psychology, 1 , 167-195. doi:10.1146/annurev.clinpsy.1.102803.143916 Olfson, M., & Marcus, S. C. (2009). National patterns in antidepressant medication treatment. Archives of General Psychiatry, 66, 848-856. doi:10.1001/archgenpsychiatry.2009.81 Thomas, M., Roy, R., Cook, A., & Marykuca, S. (1992). Chronic pain in college students. Canadian Family Physician, 38, 2597-2601. Wolfson, S. (2000). Students’ estimates of the prevalence of drug use: Evidence for a false consensus effect. Psychology of Addictive Be- havior, 1, 295-298. doi:10.1037/0893-164X.14.3.295  L. D. REID 439 Appendix A survey of the Laboratory for Psychopharmacology, Survey NS-2, page 1 Do not put your name or any other identifying marks on the survey. We want your responses to be anonymous. When you finish taking the survey, fold it so that your responses are hidden from others. We will only report aggregate data, e.g., means and measures of variability. We sincerely appreciate your willingness to help us understand some important issues. Thank you. Moods are something you have every conscious moment. Moods vary, both throughout the day and across days, weeks, months and years. Despite some variations, most people have a mood that characterizes most of their existence. In this simple survey, we ask what your prevailing mood is. Please read the following descriptions of people’s moods, i.e., their prevail- ing circumstances with respect to their usual feelings. Please read them twice. After reading them, please check the one description which be st fits your prevailing mood. ___ I am almost always very sad, very depressed. I often wonder whether life is worth living and have contemplated suicide. I am pessimistic and view nearly all decisions as being a choice between awful and terrible. Across a period of a week; I have few, if any, pleasurable moments. ___ I am usually sad, I do not find pleasurable what I for- mally found pleasurable and what others seem to find pleasur- able. I believe that my current situation and the general state of things are depressing. I find it difficult to get involved with the activities I am supposed to engage during the week, but I gen- erally work through them. ___ I have periods (even weeks or months) when I am ec- static, but those periods are followed by periods of depression, sometimes deep depression. During the periods of euphoria, I feel that I can accomplish great things and often overestimate my capabilities. During the periods of euphoria, I am very ac- tive and can work and play hard. During the periods of depres- sion, I am very sad, lethargic and often regret the things I said and did during the periods of euphoria. ___ I am somewhat sad. My life is best described as having little or no meaning. I have more disappointing days than satis- fying days. My relationships with family and friends are O.K., but not particularly happy and often characterized by low-level conflict. I get little satisfaction from my weekly activities and engage them routinely. ___ I have a neutral mood; not sad, not happy; not depressed, not particularly satisfying. My “highs” and “lows” are not in- tense. ___ I am more happy than sad, but there are a number of as- pects of my life that are distressing. The distressing aspects of my life often, but not always, keep me from being happy with work, family and friends. Nevertheless, I seem to have my share of pleasurable moments. ___ Most of the time, I am happy, but there are a few aspects of my life that are distressing. My weekly activities are routine work, and I find them somewhat satisfying. My relationships with family and friends are O.K. I have my share of pleasurable moments. ___ Over all, I am generally happy. My life is O.K. My weekly activities are, for the most part, satisfying. I believe most people think of me as a good, upstanding person. My relationships with family and friends are O.K. I have my share of periodic periods of enjoyment and have no more than usual instances of distress and sadness. If the rest of my life was similar to what it is now, I would not be greatly disappointed. ___ Over all, I am happy. My life is satisfying. I get great satisfaction from my weekly activities. I engage in a wide vari- ety of enjoyable activities. My relationships with family and friends are good, and a great source of satisfaction. I believe that I am a respected member of my community. I have the usual instances of distress and sadness, but seem to recover from them faster than most. A survey of the Laboratory for Psychopharmacology, Survey NS-2, page 2 Please estimate the % of students on your campus that rated themselves as having the first two moods in the list of moods provided on page 1, i.e., the items that begin with “I am almost always very sad” and “I am usually sad.” ___% Please estimate the % of students on your campus that rated themselves as having the last two moods in the list of moods provided on page 1, i.e., the items that begin with “Over all, I am generally happy” and “Over all, I am happy.” ___% |