

Paper Menu >>
Journal Menu >>
 American Journal of Anal yt ical Chemistry, 2011, 2, 484-490 doi:10.4236/ajac.2011.24058 Published Online August 2011 (http://www.SciRP.org/journal/ajac) Copyright © 2011 SciRes. AJAC An Indirect Immunoassay for Detecting Antigen Based on Fluorescence Resonance Energy Transfer Peihui Yang1,2*, Shuguang Yao1, Wei Wei1, Jiye Cai1,2 1Department of Chemistry, Jinan University, Guangzhou, China 2Key Laboratory of Optoelectronic Information and Sensing Technologies of Guangdong Higher Education Institutes, Jinan University, Guangzhou, China E-mail: [email protected] Received March 4, 2011; revised April 29, 2011; accepted May 16, 2011 Abstract An indirect immunoassay for detecting antigen was developed. It was based on fluorescence resonance en- ergy transfer (FRET) and quenching of gold nanoparticles. Bovine serum albumin (BSA) was chosen as model antigen. Fluorescein isothiocyanate (FITC) was attached to anti-BSA antibody (anti-BSA–FITC) as FRET donor, while BSA was conjugated to gold nanoparticles (GNPs–BSA) as FRET acceptor. The forma- tion of anti-BSA–BSA immunocomplex resulted in the FRET between anti-BSA–FITC and GNPs–BSA. Thus, the fluorescence of FRET donor was quenched, and the decreasing fluorescence intensity responded linearly to the concentration of acceptor within the linear range. The concentration of BSA we obtained ac- cording to the stoichiometric ratio between BSA and GNPs. Following this approach, we were able to spe- cifically detect BSA. The detection limit for BSA was 0.5 nM and the linear range of the assay was 2.9 - 43.5 nM. It had been successfully applied to specific detection of BSA in serum samples. Keywords: Anti-BSA Antibody, BSA, Gold Nanoparticles, FRET, Indirect Immunoassay 1. Introduction Over the past few years, nanoprobes have attracted con- siderable attention in bioassays, and have been exploited in biodetection, biolabeling and biosensor development [1-3]. As a new spectral analysis method, fluorescence resonance energy transfer (FRET) has been widely used to detection of protein [4-6] and nucleic acid [7], due to the characteristics of easy operation, high-sensitivity and fast detection. Surface energy transfer (SET) between dye molecules and metal nanoparticles has gained inter- est because this technique is capable of measuring dis- tances nearly twice as far as FRET [8]. Gold nanoparti- cles (GNPs) have been of great interest because of their high extinction coefficient and broad absorption spec- trum in visible region which is overlapped with the emission wavelength of usual FRET donor. Both theo- retical calculations and experimental studies have well demonstrated that GNPs are a kind of “superquencher” which can quench the fluorescence of a range of dyes with extraordinarily high efficiency [9]. Based on this superquenching effect, GNPs have been successfully served as acceptor in FRET. Pihlasalo et al. reported a new and highly sensitive method to detect protein con- centrations which relying on protein adsorption and quenching of fluorescently labeled protein. This method is based on the competitive assay principle with nonco- valent adsorption of sample protein and dipyrryl- methene-BF2 530 labeled BSA on nanosized gold parti- cles in a homogeneous assay format [10]. Mayilo et al. reported the homogeneous sandwich immunoassay with GNPs as fluorescence quenchers. A detection limit of 0.7 ng/mL was obtained for protein cardiac troponin T (cTnT), which is the lowest value reported for a homo- geneous sandwich assay for cTnT [11]. Biotin assay with sensitivities in the micromolar range have also been re- ported [12]. QDs are used in FRET because of several advantages. Haldar et al. demonstrated a pronounced effect on the photoluminescence quenching and shorten- ing of decay time of CdSe QDs during interaction with GNPs in a GNPs−BSA conjugated CdSe QD system [8]. Yang et al. have attempted to employ two FRET assem- bles in one system, in which luminescent CdTe QDs as FRET donors and GNPs serving as the acceptor with chymotrypsin as the linking bridge [13]. The present work is based on fluorescence signal 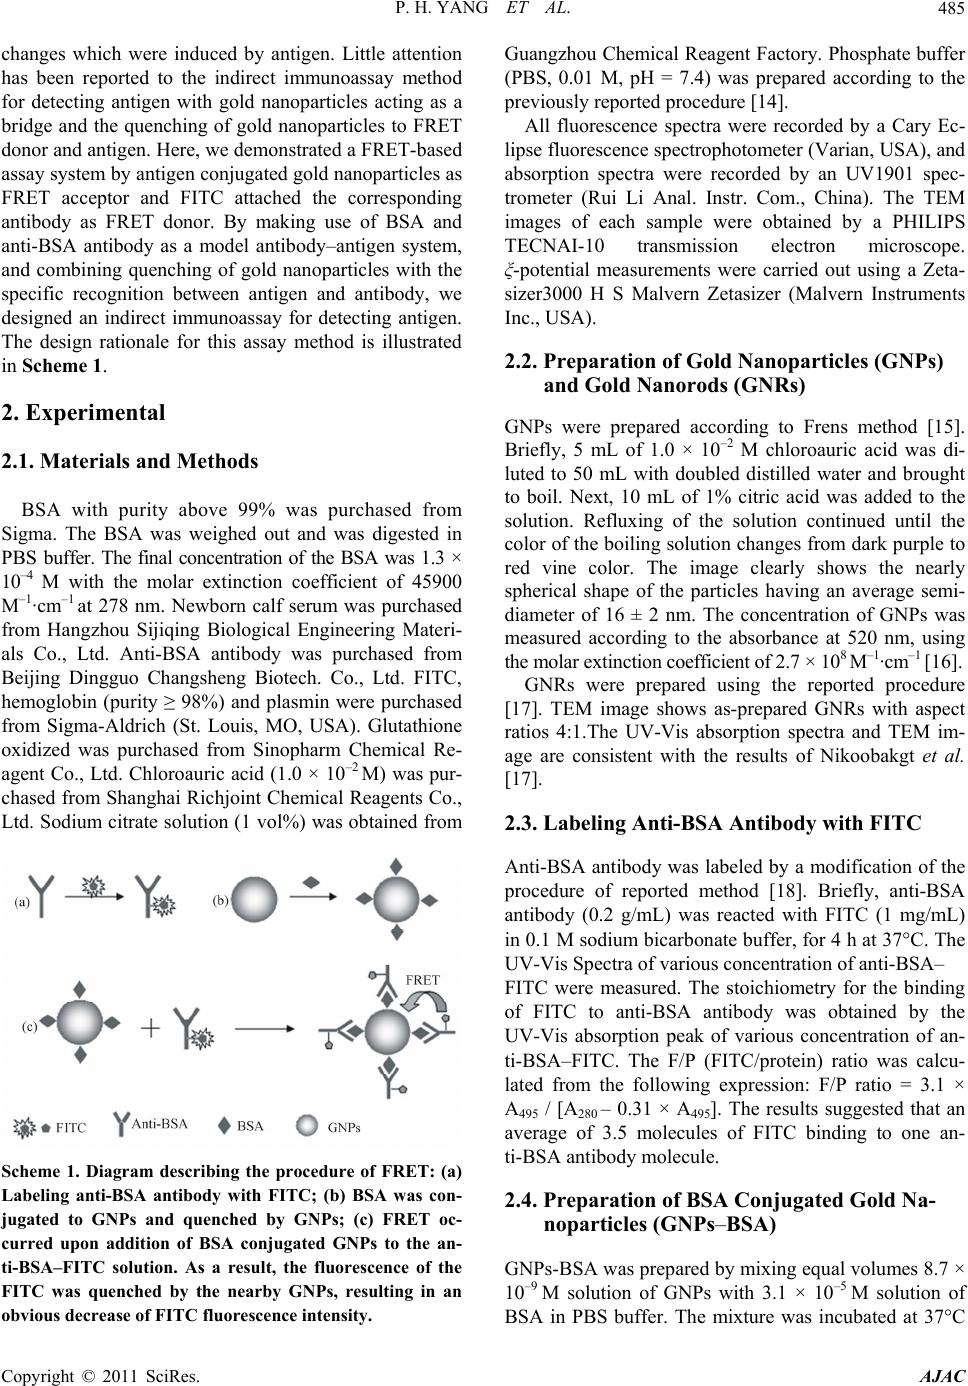 P. H. YANG ET AL.485 changes which were induced by antigen. Little attention has been reported to the indirect immunoassay method for detecting antigen with gold nanoparticles acting as a bridge and the quenching of gold nanoparticles to FRET donor and antigen. Here, we demonstrated a FRET-based assay system by antigen conjugated gold nanoparticles as FRET acceptor and FITC attached the corresponding antibody as FRET donor. By making use of BSA and anti-BSA antibody as a model antibody–antigen system, and combining quenching of gold nanoparticles with the specific recognition between antigen and antibody, we designed an indirect immunoassay for detecting antigen. The design rationale for this assay method is illustrated in Scheme 1. 2. Experimental 2.1. Materials and Methods BSA with purity above 99% was purchased from Sigma. The BSA was weighed out and was digested in PBS buffer. The final concentration of the BSA was 1.3 × 10⁻⁴ M with the molar extinction coefficient of 45900 M–1·cm–1 at 278 nm. Newborn calf serum was purchased from Hangzhou Sijiqing Biological Engineering Materi- als Co., Ltd. Anti-BSA antibody was purchased from Beijing Dingguo Changsheng Biotech. Co., Ltd. FITC, hemoglobin (purity ≥ 98%) and plasmin were purchased from Sigma-Aldrich (St. Louis, MO, USA). Glutathione oxidized was purchased from Sinopharm Chemical Re- agent Co., Ltd. Chloroauric acid (1.0 × 10⁻² M) was pur- chased from Shanghai Richjoint Chemical Reagents Co., Ltd. Sodium citrate solution (1 vol%) was obtained from Scheme 1. Diagram describing the procedure of FRET: (a) Labeling anti-BSA antibody with FITC; (b) BSA was con- jugated to GNPs and quenched by GNPs; (c) FRET oc- curred upon addition of BSA conjugated GNPs to the an- ti-BSA–FITC solution. As a result, the fluorescence of the FITC was quenched by the nearby GNPs, resulting in an obvious decrease of FITC fluorescence intensity. Guangzhou Chemical Reagent Factory. Phosphate buffer (PBS, 0.01 M, pH = 7.4) was prepared according to the previously reported procedure [14]. All fluorescence spectra were recorded by a Cary Ec- lipse fluorescence spectrophotometer (Varian, USA), and absorption spectra were recorded by an UV1901 spec- trometer (Rui Li Anal. Instr. Com., China). The TEM images of each sample were obtained by a PHILIPS TECNAI-10 transmission electron microscope. ξ-potential measurements were carried out using a Zeta- sizer3000 H S Malvern Zetasizer (Malvern Instruments Inc., USA). 2.2. Preparation of Gold Nanoparticles (GNPs) and Gold Nanorods (GNRs) GNPs were prepared according to Frens method [15]. Briefly, 5 mL of 1.0 × 10⁻² M chloroauric acid was di- luted to 50 mL with doubled distilled water and brought to boil. Next, 10 mL of 1% citric acid was added to the solution. Refluxing of the solution continued until the color of the boiling solution changes from dark purple to red vine color. The image clearly shows the nearly spherical shape of the particles having an average semi- diameter of 16 ± 2 nm. The concentration of GNPs was measured according to the absorbance at 520 nm, using the molar extinction coefficient of 2.7 × 10⁸ M–1·cm–1 [16]. GNRs were prepared using the reported procedure [17]. TEM image shows as-prepared GNRs with aspect ratios 4:1.The UV-Vis absorption spectra and TEM im- age are consistent with the results of Nikoobakgt et al. [17]. 2.3. Labeling Anti-BSA Antibody with FITC Anti-BSA antibody was labeled by a modification of the procedure of reported method [18]. Briefly, anti-BSA antibody (0.2 g/mL) was reacted with FITC (1 mg/mL) in 0.1 M sodium bicarbonate buffer, for 4 h at 37°C. The UV-Vis Spectra of various concentration of anti-BSA– FITC were measured. The stoichiometry for the binding of FITC to anti-BSA antibody was obtained by the UV-Vis absorption peak of various concentration of an- ti-BSA–FITC. The F/P (FITC/protein) ratio was calcu- lated from the following expression: F/P ratio = 3.1 × A495 / [A280 – 0.31 × A495]. The results suggested that an average of 3.5 molecules of FITC binding to one an- ti-BSA antibody molecule. 2.4. Preparation of BSA Conjugated Gold Na- noparticles (GNPs–BSA) GNPs-BSA was prepared by mixing equal volumes 8.7 × 10⁻⁹ M solution of GNPs with 3.1 × 10⁻⁵ M solution of BSA in PBS buffer. The mixture was incubated at 37°C Copyright © 2011 SciRes. AJAC  P. H. YANG ET AL. Copyright © 2011 SciRes. AJAC 486 overnight. 2.5. Emission Spectrum Measurements The quenching intensity of gold nanoparticles on BSA was measured by a Cary Eclipse fluorescence spectro- photometer at excitation wavelength of 280 nm and emission wavelength ranging from 300 - 500 nm. Then, the fluorescence intensity (F) was measured at emission wavelength of 345 nm; F0 was the intensity of the sys- tems without GNPs. The fluorescence quenching inten- sity (ΔF) can be calculated from the following Eqs: ΔF = F0 – F. The FRET assays were performed using the fluores- cence spectrophotometer. By excitation at 480 nm, emis- sion spectra were in the range of 500 to 700 nm. Then, the fluorescence intensity (F) of the donor (anti- -BSA–FITC) was measured at emission wavelength of 522 nm; F0 was the intensity of the systems without the acceptor (GNPs–BSA). The fluorescence quenching in- tensity (ΔF) can be calculated from the following Eqs: ΔF = F0 – F. 2.6. UV-Vis Spectroscopy UV-Vis spectra were recorded by a UV1901 spectrome- ter. All UV-Vis spectra were taken in a wavelength range of 200 - 800 nm. 2.7. Transmission Electron Microscopy Characterization Transmission electron micrographs (TEM) were obtained with a Philips TECNAI-10 microscope. The TEM sam- ples were prepared by taking a solution sample and cast- ing it onto a carbon-coated copper grid sample holder followed by evaporation in air at room temperature. 2.8. Particle Size and Zeta Potential Measurements Zeta potential distribution was measured by the particle characterizer (Malvern ZetaSizer Nano ZS, Malvern, UK). Briefly, the samples were loaded into the capillary zeta potential cell for measurement. This instrument also includes the DLS (dynamic laser scattering) function, by which the particle size distribution can be analyzed. 2.9. Assay of the BSA in Serum Samples New-born calf serum was diluted about 100 times during the disposal procedure. A test of BSA concentration was analyzed under the optimum concentration of gold na- noparticles and experimental conditions by standard ad- dition method. 3. Results and Discussion 3.1. Preparation and Characterization of FRET Acceptor In the reported study [19], it was shown that gold nanoparticles quenched BSA fluorescence mainly through a static quenching mechanism. The stoichiome- try for the binding of BSA to GNPs was confirmed by the relationship between fluorescence quenching inten- sity and the concentration of GNPs. At pH7.4, upon ad- dition of GNPs, the fluorescence intensity of BSA at 345 nm decreased with the increase of the concentration of GNPs. To further increase the concentration of GNPs produced no obvious change on the fluorescence of BSA, which indicated that BSA adsorption on GNPs reached saturation. The stoichiometry for the binding of BSA to GNPs was calculated by the concentration ratio of BSA to GNPs, until the fluorescence of BSA had no obvious change. Varying the concentration of BSA, an average of 3.60 × 10³:1 stoichiometry for the binding of BSA to GNPs was calculated (Table 1). The FRET acceptor was prepared with the same ratio as BSA to GNPs described above. 3.2. Spectra Characteristics of FRET System FRET occurred upon the addition of GNPs–BSA to the anti-BSA–FITC solution, GNPs–BSA and FITC were closed due to the specific binding of anti-BSA antibody and BSA. When GNPs conjugate was present, the fluo- rescence of FITC was quenched by the FRET acceptor, as is shown in Figure 1. Table 1. The stoichiometry for the binding of BSA to GNPs. nBSA(mol) n GNPs(mol) nBSA:n GNPs nBSA:n GNPs (mean)RSD (%) 1.1 × 10⁻⁷ 3.0 × 10⁻¹¹ 3.70 × 10³ 2.0 × 10⁻⁷ 5.7 × 10⁻¹¹ 3.53 × 10³ 3.3 × 10⁻⁷ 9.3 × 10⁻¹¹ 3.53 × 10³ 3.9 × 10⁻⁷ 10.7 × 10⁻¹¹ 3.63 × 10³ 3.60×10³ 1.7  P. H. YANG ET AL. 487 500 520 540 560 580 100 200 300 400 500 600 700 1 6 F /nm Figure 1. The process of FRET between anti-BSA–FTIC and GNPs–BSA. Emission spectra of anti-BSA–FITC with the increasing of GNPs–BSA, the concentration of anti- -BSA–FITC was 0.120 mg/ml and that of GNPs–BSA was 0.9, 1.8, 2.7, 3.6, 4.5, 5.4×10⁻¹⁰ M, respectively. 3.3. Interaction Mechanism between FRET Donors and FRET Acceptors 3.3.1. Interference of Nonspecific Substances Interference experiments were performed to exclude nonspecific interactions of biomolecules, in which GNPs were incubated with hemoglobin (Hb), oxidized glu- tathione (GSSG), lysozyme according to the ratio of BSA to GNPs as the FRET donor, respectively. The re- sults showed that the capability of recognition with an- ti-BSA–FITC can be summarized as BSA > Hb > GSSG > lyszyme > GNPs (Figure 2). The net surface charges of Hb and GSSG at pH 7.4 are negative, while anti-BSA–FITC is positively charged. 0 15304560 0 40 80 120 160 F Canalytes×10-9M BSA GNPs only Hb GSSG Lysozyme Figure 2. The process of FRET between anti-BSA–FTIC and GNPs-analyte at 25°C and 0.01 M PBS, and pH value was 7.4. The concentration of anti-BSA–FITC was 0.120 mg/ml and that of GNP–analyte was 5.0×10⁻⁸ M. Therefore, the distances between Hb, GSSG and an- ti-BSA–FITC are shortened due to electrostatic interac- tions to partially produce FRET, resulting in fluores cence quenching to a certain extent. The reason why the quenching effect of Hb is higher than GSSG is that the Hb has structural similarities to BSA. However, posi- tively charged lyszyme have little quenching effect. These results indicated that FRET occurs after recogni- tion between FRET donor and energy acceptor, resuling in fluorescence quenching. 3.3.2. Characterizati on of Specific Recog ni ti on Between FRET Donor and FRET Acceptor To directly visualize the specific recognition between FRET donor and FRET acceptor, the gold nanorods with aspect ratios 4:1 (Figure 3) were conjugated with FRET donor and incubated with FRET acceptor, and then dropped cast on a copper grid and examined by TEM [20]. During imaging, we observed a large amount of nanoparticle–nanorod dimers as shown in Figure 4, These nanoparticle dimers are believed to be formed through specific recognition between antigen and anti- body. The mean particle size and size distribution were measured by particle size analyzer [21]. After specific recognition between antigen and antibody, the average diameter of gold nanoparticles and nanorods mixed sys- tem was increased (Figure 5). These results further indi- cate that FRET occurs after recognition between FRET donor and FRET acceptor, resulting in fluorescence quenching. 3.4. Indirect Assay of Antigen with FRET System Several parameters such as pH and reaction time need further optimization for development of this FRET sys 400 500 600 700 800900100011001200 0.0 0.2 0.4 0.6 0.8 1.0 520nm 800nm Abs /nm Figure 3. Absorbance spectra of prepared GNPs with as- pect ratio 4:1. C opyright © 2011 SciRes. AJAC  P. H. YANG ET AL. 488 Figure 4. TEM micrographs of (a) antigen-conjugated gold nanoparticles; and (b) FRET donor-conjugated gold nanorods: and (c) nanoparticle-nanorod conjugate oligomers formed from the binding of antigen-conjugated gold nanoparticles and gold nanorods nanoprobes wi th F RET donor . (a) (b) Figure 5. Hydrodynamic diameter distribution plots as determined by DLS measurements: (a) the size distribution of GNPs and GNRs mixed system; (b) the size distribution of GNPs and GNRs mixed system after specific recognition between antigen and antibody. 0.0 0.5 1.0 1.5 2.0 2.5 0 50 100 150 200 CGNPs-BSA×10-7M 0.12mg/ml 0.075mg/ml 0.038mg/ml F Figure 6. The effect of the concentration of donor on the process of FRET. tem in order to tailor reaction results. To understand the effect of the concentration of FRET donor on the process of FRET, we have studied optimal FRET donor concen- tration. It was found that the quenching effect increased as the concentration of FRET donor increasing (Figure 6), which may related to the immunogenicity of FRET donor. At lower concentrations, the immunogenicity of FRET donor was low, so, the quenching effect initiated by energy transfer was weak. As the concentration of FR-ET donor increased, the immunogenicity of FRET donor increasing proportionally. Hence, the quenching effect increased. The quenching effect reached a maxi- mum when anti-BSA–FITC concentration was 0.12 mg/ml. Therefore, 0.12 mg/ml of GNPs–BSA was used in the following research. Since recognition of donor–acceptor requires some time, the optimal incubating time was studied. For the quenching of fluorescence intensity of anti-BSA–FITC by GNPs– BSA, as shown in Figure 7, fluorescence quenching inten- sity increased gradually at incubating time range from 0 min to 22 min and reached a plateau at 22 min. Thus, 25 min was chosen for the assay. The influence of temperature was examined and it was found that temperature had a little influence on the results in the temperature range of 15 to C opyright © 2011 SciRes. AJAC  P. H. YANG ET AL.489 0 102030405 0 0 10 20 30 40 50 60 F t/min Figure 7. The effect of incubating time on the process of FRET at 25°C and 0.01 M PBS, and pH value was 7.4. The anti-BSA–FITC concentration was 0.12 mg/mL, and the GNPs concentration was 5.0 × 10⁻⁸ M. 3.0 4.5 6.0 7.5 9.010.512.0 -10 0 10 20 30 40 50 F pH Figure 8. The effect of pH value on the process of FRET at 25°C and 0.01 M PBS, after 25 min of incubation. The an- ti-BSA–FITC concentration was 0.12 mg/mL, and the GNPs concentration was 5.0 × 10⁻⁸ M. 40°C. So, room temperature (25°C) was chosen for fol- lowing work. The influence of the buffer systems and the pH value on FRET was examined. The results showed pH 7.4 PBS buffer was the most suitable (Figure 8 ), which can avoid antigen or antibody denaturation when solutions at higher pH value or at lower pH value. Under the above optimized conditions, the fluores- cence quenching intensity is linearly proportional to BSA concentration from 2.9 nM to 43.5 nM with a detection limit of 0.5 nM, the linear regression equation was ∆F = 2.887 × CBSA + 7.007, with a correlation coefficient(R) of 0.9935. The serum was diluted about 100 times during the dis- posal procedure (sample 1), the recovery test was done by the standard addition method (n = 3). The recovery values with their standard deviation are shown in Table 2. The average quenching intensity was 6.0%, which was obtained from 10 replicate determinations of 4.3 × 10⁻⁸ M GNPs–BSA under the optimized conditions. The me- thod recovery was calculated compared with three known concentration levels. The recovery values are shown in Table 2 (sample 2). The above results indi- cated that the proposed method has a high repeatability and precision. 4. Conclusions We have demonstrated an indirect immunoassay based on fluorescence resonance energy transfer. Antigen was conjugated gold nanoparticles as acceptor, and FITC was attached the corresponding antibody as FRET donor. BSA and anti-BSA antibody were chosen as a model antibody-antigen system. The formation of anti-BSA– BSA immunocomplex resulted in the FRET between donor and acceptor. The concentration of BSA is deter- mined by quenching of fluorescently FRET acceptor. This method has been successfully applied to determina Table 2. Analytical results of serum samples and recovery. samples Added (nM) Founda(nm) Recovery Recovery (mean) 0 33.50 ± 0.60 __ 5.80 38.70 ± 0.54 97.67 20.30 57.10 ± 0.69 116.5 Sample 1 37.70 68.70 ± 0.52 92.45 102.2 5.80 6.07 ± 0.25 104.7 20.30 21.70 ± 0.91 106.9 Sample 2 37.70 35.90 ± 1.51 95.21 103.3 Copyright © 2011 SciRes. AJAC  P. H. YANG ET AL. 490 tion of total serum protein in serum samples. 5. Acknowledgements This project was supported by the Major State Basic Re- search Development Program of China (973 Program) (No. 2010CB833603) and the National Natural Science Foundation of China (No. 21071064). 6. References [1] S. I. Stoeva, F. W. Huo, J. S. Lee and C. A. Mirkin, “Three-Layer Composite Magnetic Nanoparticle Probes for DNA,” Journal of the American Chemical Society, Vol. 127, No. 44, 2005, pp. 15362-15363. doi:10.1021/ja055056d [2] S. Lee, S. Kim and J. Choo, “Biological Imaging of HEK293 Cells Expressing PLCγ1 Using Surface-En- hanced Raman Microscopy,” Analytical Chemistry, Vol. 79, No. 3, 2007, pp. 916-922. doi:10.1021/ac061246a [3] K. Yum, H. N. Cho and J. Hu, “Individual Nano- tube-Based Needle Nanoprobes for Electrochemical Stu- dies in Picoliter Microenvironments,” ACS Nano, Vol. 1, No. 5, 2007, pp. 440-448. doi:10.1021/nn700171x [4] R. Freeman, T. Finder and R. Gill, “Probing Protein Ki- nase (CK2) and Alkaline Phosphatase with CdSe/ZnS Quantum Dots,” Nano Letters, Vol. 10, No. 6, 2010, pp. 2192-2196. doi:10.1021/nl101052f [5] Q. D. Wei, M. Lee and X. B. Yu, “Development of an Open Sandwich Fluoroimmuno-Assay Based on Fluores- cence Resonance Energy Transfer,” Analytical Biochem- istry, Vol. 358, No. 1, 2006, pp. 31-37. doi:10.1016/j.ab.2006.08.019 [6] K. Lymperopoulos, R. Crawford and J. Torella, “Sin- gle-Molecule DNA Biosensors for Protein and Ligand Detection,” Angewandte Chemie International Edition, Vol. 49, No. 7, 2010, pp. 1316-1320. doi:10.1002/anie.200904597 [7] S. Ram, P. Vajpayee and R. Shanker, “Rapid Cul- ture-Independent Quantitative Detection of Enterotoxi- genic Escherichia Coli in Surface Waters by Real-Time PCR with Molecular Beacon,” Environmental Science & Technology, Vol. 42, No. 12, 2008, pp. 4577-4582. [8] K. K. Haldar, T. Sen and A. Patra, “Metal Conjugated Semiconductor Hybrid Nanoparticle-Based Fluorescence Resonance Energy Transfer,” The Journal of Physical Chemistry C, Vol. 114, No. 11, 2010, pp. 4869-4874. doi:10.1021/jp911348n [9] J. Zhang, L. H. Wang and H. Zhang, “Aptamer-Based Multicolor Fluorescent Gold Nanoprobes for Multiplex Detection in Homogeneous Solution,” Samll, Vol. 6, No. 2, 2010, pp. 201-204. [10] S. Pihlasalo, J. Kirjavainen and P. Hanninen, “Ultrasensi- tive Protein Concentration Measurement Based on Parti- cle Adsorption and Fluorescence Quenching,” Analytical Chemistry, Vol. 81, No. 12, 2009, pp. 4995-5000. doi:10.1021/ac9001657 [11] S. Mayilo, M. A.Kloster and M. Wunderlich, “Long- -Range Fluorescence Quenching by Gold Nanoparticles in a Sandwich Immunoassay for Cardiac Troponin T,” Nano Letters, Vol. 9, No. 12, 2009, pp. 4558-4563. doi:10.1021/nl903178n [12] N. Kato and F. Caruso, “Homogeneous, Competitive Fluorescence Quenching Immunoassay Based on Gold Nanoparticle/Polyelectrolyte Coated Latex Particles,” The Journal of Physical Chemistry B, Vol. 109, No. 42, 2005, pp. 19604-19612. doi:10.1021/jp052748f [13] D. Z. Yang, S. K. Xua and Q. F. Chen, “One System with Two Fluorescence Resonance Energy Transfer (FRET) Assembles among Quantum Dots, Gold Nanoparticles and Enzyme,” Colloids and Surfaces A: Physicochemical and Engineering Aspects, Vol. 329, No. 1-2, 2008, pp. 38-43. doi:10.1016/j.colsurfa.2008.06.048 [14] J. M. Kürner, O. S.Wolfbeis and I. Klimant, “Homoge- neous Luminescence Decay Time-Based Assay Using Energy Transfer from Nanospheres,” Analytical Chemis- try, Vol. 74, No. 9, 2002, pp. 2151-2156. doi:10.1021/ac0111098 [15] G. Frens, “Controlled Nucleation for the Regulation of the Particle Size in Monodisperse Gold Suspensions,” Nature Physical Science, Vol. 241, No. 105, 1973, pp. 20-22. [16] R. C. Jin, G. S. Wu and Z. Li, “What Controls the Melt- ing Properties of DNA-Linked Gold Nanoparticle As- semblies?” Journal of the American Chemical Society, Vol. 125, No. 6, 2003, pp. 1643-1654. doi:10.1021/ja021096v [17] B. Nikoobakht and M. A. El-Sayed, “Preparation and Growth Mechanism of Gold Nanorods (NRs) Using Seed-Mediated Growth Method,” Chemistry of Materials, Vol. 15, No. 10, 2003, pp. 1957-1962. [18] P. Xu. “Application of Fluorescence and Immunofluo- rescence Staining Technique,” People’s Medical Pub- lishing House, Beijing, 2000. [19] S. H. Brewer, W. R. Glomm and M. C. Johnson, “Prob- ing BSA Binding to Citrate-Coated Gold Nanoparticles and Surfaces,” Langmuir, Vol. 21, No. 20, 2005, pp. 9303-9307. doi:10.1021/la050588t [20] X. Liu, Q. Dai and L. Austin, “A One-Step Homogeneous Immunoassay for Cancer Biomarker Detection Using Gold Nanoparticle Probes Coupled with Dynamic Light Scattering,” Journal of the American Chemical Society, Vol. 130, No. 9, 2008, pp. 2780-2782. doi:10.1021/ja711298b [21] B. F. Pan, D. X. Cui and P. Xu, “Study on Interaction between Gold Nanorod and Bovine Serum Albumin,” Colloids and Surfaces A: Physicochemical and Engi- neering Aspects, Vol. 295, No. 1-3, 2007, pp. 217-222. doi:10.1016/j.colsurfa.2006.09.002 C opyright © 2011 SciRes. AJAC |