

Paper Menu >>
Journal Menu >>
 Journal of Environmental Protection, 2011, 2, 710-719 doi:10.4236/jep.2011.26082 Published Online August 2011 (http://www.SciRP.org/journal/jep) Copyright © 2011 SciRes. JEP Ecotoxicity and Ecosystem Health of a Ramsar Wetland System of India U. P. Nasir1*, P. S. Harikumar2 1Senior Scientific Assistant, Central Pollution Control Board, Zonal Office-Vadodara, Gujarat, India; 2Scientist & In-Charge, Central Water Analysis Laboratory, Centre for Water Resources Development and Management, Kozhikode, Kerala, India. Email: nasirchemistry@yahoo.com, [email protected] Received March 22nd, 2011; revised May 4th, 2011; accepted June 14th, 2011. ABSTRACT In this study one econ omically important Ramsar wetland system of India, Vembanad wetlan d system, is studied to de- termine the environmental pollutio n. Six surfa ce sediment samples collected from two extreme zones of the wetland sys- tem were analyzed for heavy metals such as Copper, Zinc, Manganese, Cadmium, Lead, Nickel and Mercury. Highest metal concentration was found at industrial zone and lowest concentration was detected at southern upstream of the wetland system. The results showed that the pollution level is significant in the industrial zone. Comparison of the re- sults with different sediment quality g uidelines indicated ultra high degree of contamination in th e industrial zone. The numerical value of degree of contamination, pollution load index, sum of toxic units, enrichment factor and geo-accu- mulation index confirmed the above fact. Based on National Oceanic and Atmospheric Administration Guidelines, the health of the ecosystem was seriously impaired with frequent occurring of biological effects in the industrial zone. The percentage of heavy metal calculated with respect to the industrial zone as the base line and the correlation analysis with organic matter indicated that, mobility of the specific metal has higher impact on its concentration at the fresh water region of the wetland. Keywords: Heavy Metal, Sediment Quality Guidelines, Degree of Contamination, Pollution Load Index, Index of Geo-Accumulation 1. Introduction Sediments are the layers of relatively finely divided mat- ter covering the bottom of rivers, streams, lakes, reser- voirs, bays, estuaries and ocean. Unlike water quality which is susceptible to seasonal variation, dependent on in and out flow and weather, sediment quality is more constant and will have more farfetched implications. As- sessment of sediments in a complex aquatic system re- sulted in a better understanding of the adverse impacts that contaminants in sediments pose to fish, wild life and humans who depend this impacted waterways. Therefore apart from polluted water, fate of contaminated sediment has been chosen as one of the aspects responsible for ecological decline. Lake sediments provide a useful ar- chive of information on changing lacustrine and water- shed ecology [1]. The composition of the sediment se- quences provides the best natural achieves of recent en- vironmental changes [2]. Sediment is a habitat and major nutrient source for aquatic organisms. Sediment analysis is important in eva- luating qualities of total ecosystems of a water body in addition to water sample analysis practiced for many years because it reflects the long term quality situations independent of the current inputs [3] and it is the ultimate sink of contaminants in the aquatic system [4]. Accumu- lation of heavy metals occur in upper sediment of the aquatic environment by biological and geochemical mechanisms and becomes toxic to sediment dwelling organisms and fish, resulting in death, reduced growth, or in impaired reproduction and lower species diversity [5]. Trace elements also occur naturally in rock forming minerals; hence they can reach the environment from natural processes [6]. The occurrence of metals in aquatic ecosystems in excess of natural background loads has become a problem of increasing concern. Heavy metals in environment may accumulate to toxic levels without visible signs. This may occur naturally from normal geological phenomenon such as ore formation, weather- ing of rocks and leaching or due to increased population, urbanization, industrial activities, agricultural practices, exploration and exploitation of natural resources [7].  Ecotoxicity and Ecosystem Health of a Ramsar Wetland System of India711 One of the major problems that heavy metals cause with respect to their effects on aquatic organisms is their long biological half-life. Therefore, they are among the most frequently monitored micropollutants, and reliable techniques have been established for their extraction and quantification [8-10], since sediment contamination by heavy metals in rivers and estuaries has become an issue of increasing environmental concern. Such contamina- tion is often caused by human activities, including min- ing, smelting, electroplating and other industrial proc- esses that have metal residues in their wastes, and by non-point source surface runoff. It is accepted that without defensible sediment quality guidelines it would be difficult to assess the extend of sediment contamination [11]. Sediments were classified as non-polluted, moderately polluted and heavily pol- luted, based on Sediment Quality Guidelines of United State Environmental Protection Agency [12]. Hakanson et al. [13] had suggested a contamination factor (Cif) and the degree of contamination (Cd) to describe the con- tamination of given toxic substance. Tomlinson et al. [14] had employed a simple method based on pollution load index (PLI) to assess the extent of pollution by metals in estuarine sediments. The need for chemical guidelines that could be used to predict adverse biological effects in contaminated sediments lead to the development of sediment quality guidelines [15-18]. The ecotoxicologi- cal sense of heavy metal contamination in sediments was determined using sediment quality guidelines developed for marine and estuarine ecosystem [19]. The potential acute toxicity of contaminants in sediment sample can be estimated as the sum of the toxic units (∑TU) defined as the ratio of the determined concentration to PEL value [20]. Pollution will be measured as enrichment factor (EF), which is the amount or ratio of the sample metal enrichment above the concentration present in the refer- ence station or material [21,22]. Sediment geo accumula- tion index (GeoI) is the quantitative check of metal pol- lution in aquatic sediments [23]. These impacts were assessed by means of the geo-accumulation index (Igeo) [24] and Igeo classification is reported based on the chemical analysis of the bulk sediments. The Igeo has been widely utilized as a measure of pollution in fresh- water [25-27] and marine sediments [28-30]. The over all objective of this research work was to evaluate the degree and extend to which the heavy metal contamination has affected the Vembanad wetland sys- tem, one of the Ramsar site in the south west coast of India. In this study heavy metals such as copper, zinc, manganese, cadmium, lead, nickel and mercury in sur- face sediments were analysed using different sediment quality guidelines. The numerical value of different sediment quality indices such as degree of contamination, pollution load index, sum of toxic units, enrichment fac- tor and geo-accumulation index were also calculated for the data interpretation. Hence the present study aimed to understand the pollution load at industrial region of the wetland system and its impact towards the fresh water region of the Vembanad Lake. The Vembanad wetland system (Latitude 9˚30' and 10˚12'; Longitude 76˚10' and 76˚29') is a complex aquatic system of coastal backwaters, lagoons, marshes, man- groves and reclaimed lands with an intricate network of natural and man made channels and its associated drain- age basins are situated in the humid tropical region on the south west coast of the Indian peninsula. The total area of the wetland system is 2195 km2. This system in- cludes the Vembanad backwaters and the lower reaches of the five rivers draining in to it. The five rivers which drain in to the Vembanad Lake are Muvattupuzha, Meenachil, Manimala, Pamba and Achenkoil. All these rivers originate from the Western Ghats, flow westwards through the wetland system and join the Lakshadweep/ Arabian Sea. The wetland is typically divided into two distinct segments, the freshwater dominant southern zone and the salt-water dominant northern zone both separated by a bund at Thanneermukkom. The estuarine zone and organically rich sedimentary substratum of the inshore region makes it a highly preferred and desirable habitat for shrimps breeding. Vembanad is renowned for its live clam resources and sub-fossil deposits. Vembanad wet- land has been designated as a Ramsar Site in November 2002. The wetland system is facing many problems, which include; pollution due to industrial, agricultural and do- mestic effluents. It is estimated that nearly 260 million liters of effluents reach the estuaries daily form the in- dustries located in the northern part of the wetland sys- tem [31]. The Cochin estuarine system receives effluents containing a large dose of heavy metals [32]. The distri- bution and toxicity of heavy metals in core sediments also indicated severe pollution in the wetlands [33,34]. The increasing loads of sewage and industrial waste have created conditions that are extremely destructive to flora and fauna. During the tidal activity pollutants from the northern side moves towards the southern side making the fresh water system also threatened. In addition agri- cultural inputs from the lands located around the lake also pollute the freshwater region of the lake. Sampling Stations Six sampling stations were selected in the wetland sys- tem starting from the northern industrial region to the southern fresh water region. Six surface sediment sam- ples were collected from each site, using a gravity corer with PVC core-liner. Four centimeters of the surface Copyright © 2011 SciRes. JEP  Ecotoxicity and Ecosystem Health of a Ramsar Wetland System of India 712 sediments were extracted from the core-liner and placed in labeled polythene bags. In the laboratory the sediments were air-dried [23] to a constant weight and homoge- nized with a pestle and mortar, in order to normalize for variation in grain size distribution. The sampling sites are marked in the area map (Figure 1). 2. Analytical Methods For the digestion of the sediment sample one gram of dried and homogenized sediment sample was weighed into 250 ml beaker. An empty beaker was included in the analysis as a reagent empty blank. 50 ml of distilled wa- ter was added to the sample. The digestion was per- formed with a mixture HNO3 and HClO4. Digestion was continued until the volume was reduced to about 15 ml. The beakers were allowed to cool to room temperature. The digests were then filtered into a 50ml volumetric flask and made up to the volume with distilled water [35]. The digested samples were analyzed for heavy metal following Atomic Absorption Spectrophotometer [15] by Thermo M5 series. The concentration of manganese, cadmium, copper, lead, nickel, zinc and mercury were determined in sediment samples and the values are re- ported in units of mg/Kg. The contamination factor for the sediment samples were calculated by the equation; Figure 1. Area map of Vembanad wetland system showing the sediment sampling sites. Contamination Factor (CF) = Metal content in sedi- ment/Background level of metal (1) The method proposed by Tomlinson et al. [14] had employed in the present study to find the sediment pollu- tion load index (PLI) which is given by the equation; PLI = (Product of n number of CF values)1/n (2) Enrichment factors (EF) for metal concentration in sediments at all the stations was calculated and used for comparison. The following equation was used to calcu- late the EFc values. EFc = X/Fe (sediment)/X/Fe (Earth’s crust) (3) where X is the metal studied and X/Fe is the ratio of the concentration of element X to iron. Iron was chosen as the element of normalization because natural sources (98%) vastly dominate its input. The crustal abundance data of Bowen [36] were used for all EF values. The geoaccumulation index Igeo values were calcu- lated for different metals as introduced by Muller [37] is as follows: Igeo = Log2(Cn/1.5*Bn) (4) where Cn is the measured concentration of element n in the sediment simple and Bn is the geochemical back- ground for the element n which is Esther directly meas- ured in pre civilization sediments of the area or taken from the literature (average shale values). The factor 1.5 was introduced to include the possible variation of the background values that are due to lithological variations. 3. Results One of the simple ways of assessing the level of pollu- tion in an aquatic ecosystem is the comparison with dif- ferent sediment quality guidelines. The range and the mean concentration of heavy metals determined in the sediment samples and their comparative assessment with different international sediment quality guidelines are tabulated in Tabl e 1. The concentration of copper varied from 38.7 mg/Kg to 1723.75 mg/Kg. Zinc has a variation from 70.7 mg/Kg to 1963.67 mg/Kg. Manganese con- centration in the surface sediments according to the pre- sent investigation varied from 320.51 mg/Kg to 15586.88 mg/Kg. Cadmium in the sediment ranges from 0.27 mg/Kg to 6.35 mg/Kg. The concentration of lead ranged from 21.70 mg/Kg to 162.59 mg/Kg. Nickel has a varia- tion from 49.59 mg/Kg to 75.70 mg/Kg. The level of contamination in aquatic system can be assessed by determining a factor called the degree of contamination (mCd). Elemental background concentra- tion reported for continental crust was used as the refer- ence value. The calculated value for the degree of con- tamination ranges from 1.47 to 35.39. The extend of pol- lution in an aquatic environment can be evaluated by a Copyright © 2011 SciRes. JEP  Ecotoxicity and Ecosystem Health of a Ramsar Wetland System of India Copyright © 2011 SciRes. JEP 713 Table 1. Concentration range of different heavy metals and its comparison with different SQGs. Ontario MOE NOAA SQGFDEP SQGCCME USEPA Element mg/Kg Mean Range Low Severe ERL ERMTELPEL IGM PEL CSCR SQG NP SQG MP SQG HP Cu 799.15 38.87 - 1723.75 16 110 34 270 18.711035.719760 - 125 <25 25 - 50>50 Zn 528.21 70.07 - 1963.67 120 820 150410 124.0270 70 - 400 <90 90 - 200>200 Mn 4928.9 320.51 - 15586.88 460 1110 1500 - 3000 - - - Cd 6.63 0.27 - 26.35 0.6 10 1.29.6 0.684.200.6 3.53 - 8 - - - Pb 66.40 21.70 - 162.59 31 250 46.7218 30.211035 91.3100 - 400 <40 40 - 60>60 Ni 64.35 49.59 - 75.70 16 75 20.951.615.943 123315100 <20 20 - 50>50 ERL-Effect Range Low, ERM- Effect Range Median, TEL-Threshold Effect Level, PEL-Probable Effect Level, IGM-Interim sediment quality Goals, NP-Non Polluted, MP-Moderately Polluted, HM-Heavily Polluted. simple method based on pollution load index (PLI). The world average concentration of elements reported for Shale was taken as the reference for PLI. Station 6/VL reported lower PLI value (1.02) and the highest (12.92) was reported for station 2/VL. The potential acute toxic- ity of contaminants in sediment samples can be estimated as the sum of toxic units (∑TU) defined as the ratio of determined concentration to PEL values. The TU values also show the same trend as like mCd and PLI. The dif- ferent values observed for degree of contamination, pol- lution load index and sum of toxic units are summarized in Table 2. All the values indicated metal contamination in the Vembanad Lake. A common approach to estimate how much the sedi- ment is impacted (naturally and anthropogenically) with heavy metal is to calculate the enrichment factor (EF) for metal concentrations above uncontaminated background levels. The average standard reported for Shale was used as the reference value in the present study. The enrich- ment factors for different metals in different stations are tabulated in Tabl e 3 . Index of geochemical accumulation (Igeo) has been used widely to evaluate the degree of metal contamination or pollution in terrestrial, aquatic and marine environment. World average reported for Shale was used as the control in the present study. Geo- accumulation index for different stations is summarized in Table 4. Correlation matrix provides clues about the carrier substances and the chemical association of these metals in the ecosystem. In the present study Pearson’s correla- tion has employed for different metals with organic mat- ter. The correlation matrix is given in Table 5. 4. Discussion 4.1. Spatial Variation of Heavy Metals Figure 2 represents the spatial variation of different heavy metals in the surface sediments of Vembanad wet- land system. The mean concentration of different heavy metals follows the order manganese > copper > zinc > lead > nickel > cadmium > mercury. The average con- centration of copper is 799.15 mg/Kg, which was above the all compared sediment quality guidelines. The high- est deposition was found in the Cochin bar mouth and lowest was reported in the station 6/VL, which is in the southern end. High level of copper indicates a higher input of organic matter deposition, which might be from urban and industrial waste water sediment deposition. The average concentration of zinc is 528.21 mg/Kg, which was also above the all sediment quality guidelines. Manganese in earth crust is 1060 mg/Kg; in soils it is 61 - 1060 mg/Kg. The station 2/VL has reported 15586.88 which is far away from the guideline values. A uniform decreasing trend was observed for manganese except for the station 1/VL. The average abundance of cadmium in the earth crust is 0.16 ppm; in soils it is 0.1 - 0.5 mg/Kg. Increased cadmium concentration might be related to industrial activity, atmospheric emission and deposition of organic and fine grain sediments. Lead is considered as a good indicator of pollution by urban run-off water. The use of gasoline is mainly responsible for the lead pollution especially in urban area. The average concen- tration of lead in the present study is 66.40 mg/Kg, which is in the category of highly polluted sediments according to United State Environmental Protection Agency Guide- lines. The background value of nickel in the earth crust is 1.2 mg/Kg; in soil it is 2.5 mg/Kg. Nickel is used princi- pally in its metallic form combined with other metals and nonmetals as alloys. The mean value of nickel is 64.35 mg/Kg, which is above the United State Environmental Protection Agency Guidelines for highly polluted sedi- ments. The mercury pollution is severe in the sediments of the Cochin bar mouth with a concentration of 4.91 mg/Kg. 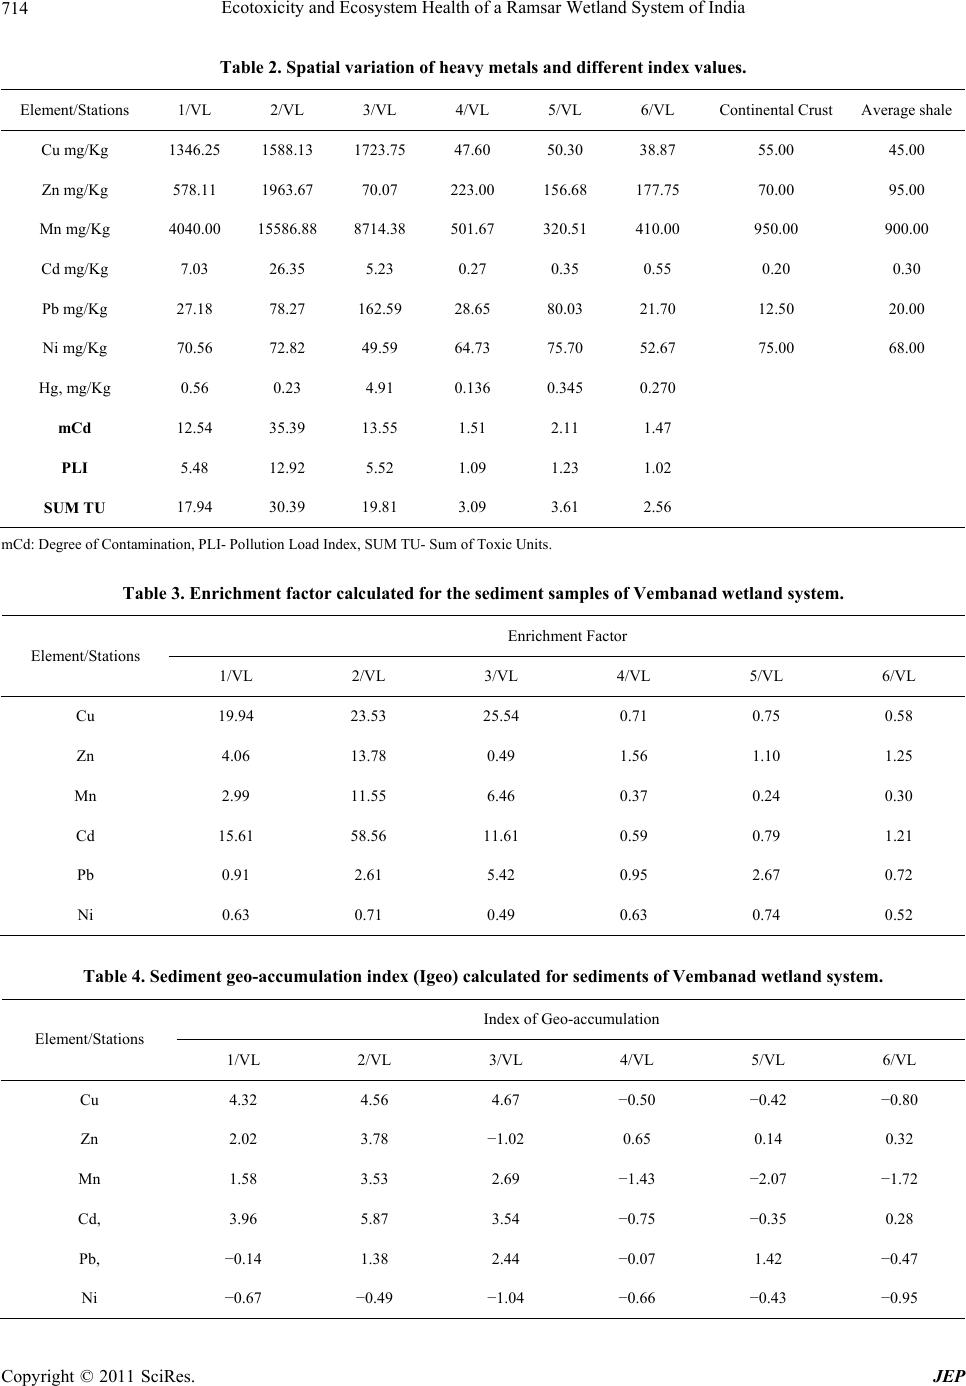 Ecotoxicity and Ecosystem Health of a Ramsar Wetland System of India 714 Table 2. Spatial variation of heavy metals and different index values. Element/Stations 1/VL 2/VL 3/VL 4/VL 5/VL 6/VL Continental Crust Average shale Cu mg/Kg 1346.25 1588.13 1723.75 47.60 50.30 38.87 55.00 45.00 Zn mg/Kg 578.11 1963.67 70.07 223.00 156.68 177.75 70.00 95.00 Mn mg/Kg 4040.00 15586.88 8714.38 501.67 320.51 410.00 950.00 900.00 Cd mg/Kg 7.03 26.35 5.23 0.27 0.35 0.55 0.20 0.30 Pb mg/Kg 27.18 78.27 162.59 28.65 80.03 21.70 12.50 20.00 Ni mg/Kg 70.56 72.82 49.59 64.73 75.70 52.67 75.00 68.00 Hg, mg/Kg 0.56 0.23 4.91 0.136 0.345 0.270 mCd 12.54 35.39 13.55 1.51 2.11 1.47 PLI 5.48 12.92 5.52 1.09 1.23 1.02 SUM TU 17.94 30.39 19.81 3.09 3.61 2.56 mCd: Degree of Contamination, PLI- Pollution Load Index, SUM TU- Sum of Toxic Units. Table 3. Enrichment factor calculated for the sediment samples of Vembanad wetland system. Enrichment Factor Element/Stations 1/VL 2/VL 3/VL 4/VL 5/VL 6/VL Cu 19.94 23.53 25.54 0.71 0.75 0.58 Zn 4.06 13.78 0.49 1.56 1.10 1.25 Mn 2.99 11.55 6.46 0.37 0.24 0.30 Cd 15.61 58.56 11.61 0.59 0.79 1.21 Pb 0.91 2.61 5.42 0.95 2.67 0.72 Ni 0.63 0.71 0.49 0.63 0.74 0.52 Table 4. Sediment geo-accumulation index (Igeo) calculated for sediments of Vembanad wetland system. Index of Geo-accumulation Element/Stations 1/VL 2/VL 3/VL 4/VL 5/VL 6/VL Cu 4.32 4.56 4.67 −0.50 −0.42 −0.80 Zn 2.02 3.78 −1.02 0.65 0.14 0.32 Mn 1.58 3.53 2.69 −1.43 −2.07 −1.72 Cd, 3.96 5.87 3.54 −0.75 −0.35 0.28 Pb, −0.14 1.38 2.44 −0.07 1.42 −0.47 Ni −0.67 −0.49 −1.04 −0.66 −0.43 −0.95 Copyright © 2011 SciRes. JEP 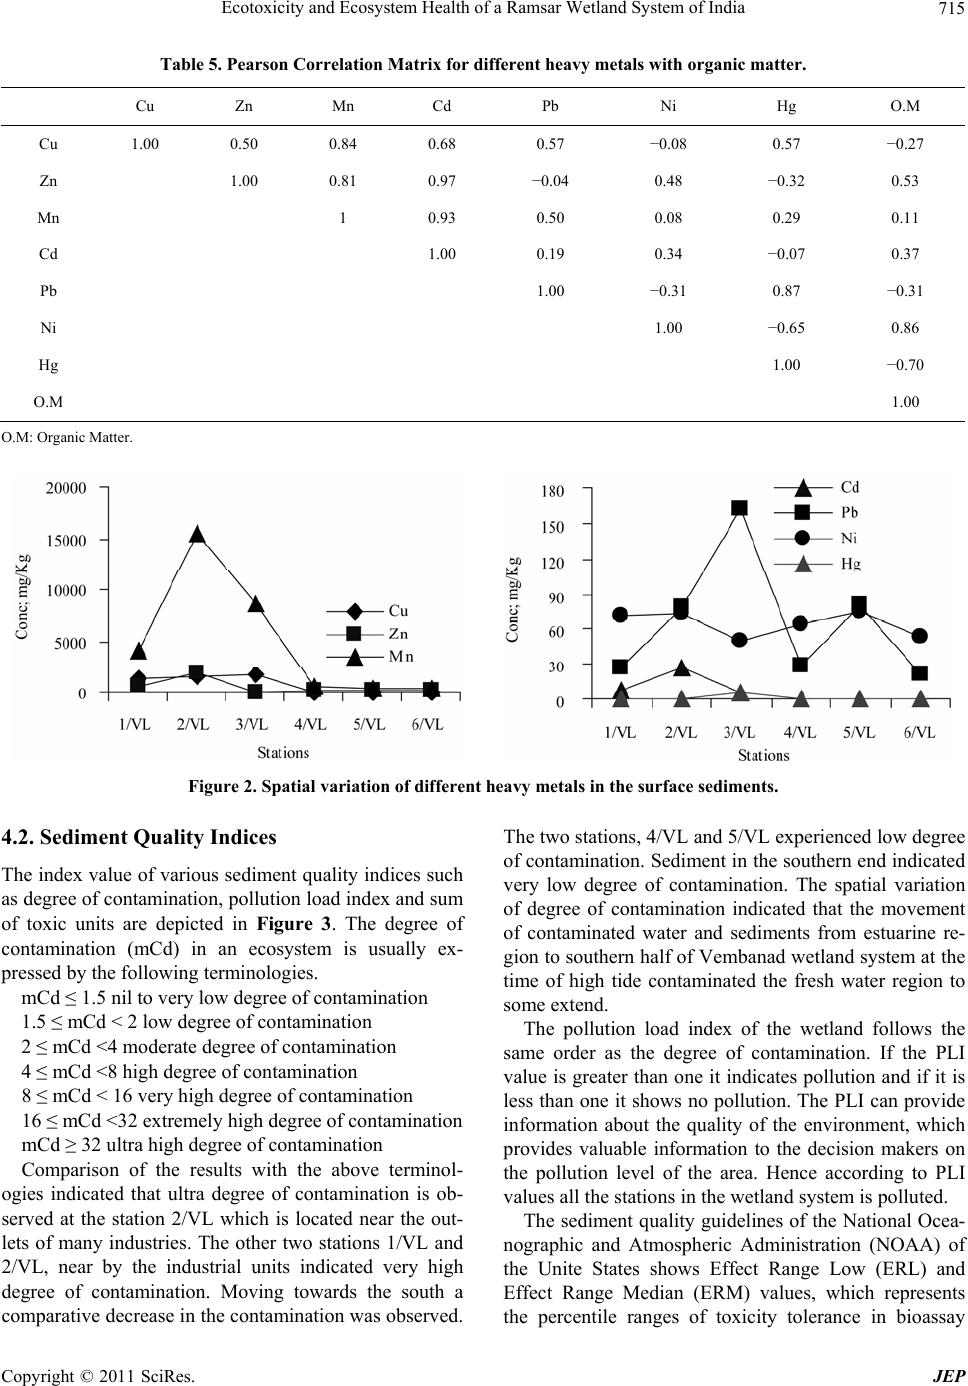 Ecotoxicity and Ecosystem Health of a Ramsar Wetland System of India715 Table 5. Pearson Correlation Matrix for different heavy metals with organic matter. Cu Zn Mn Cd Pb Ni Hg O.M Cu 1.00 0.50 0.84 0.68 0.57 −0.08 0.57 −0.27 Zn 1.00 0.81 0.97 −0.04 0.48 −0.32 0.53 Mn 1 0.93 0.50 0.08 0.29 0.11 Cd 1.00 0.19 0.34 −0.07 0.37 Pb 1.00 −0.31 0.87 −0.31 Ni 1.00 −0.65 0.86 Hg 1.00 −0.70 O.M 1.00 O.M: Organic Matter. Figure 2. Spatial variation of different heavy metals in the surface sediments. 4.2. Sediment Quality Indices The index value of various sediment quality indices such as degree of contamination, pollution load index and sum of toxic units are depicted in Figure 3. The degree of contamination (mCd) in an ecosystem is usually ex- pressed by the following terminologies. mCd ≤ 1.5 nil to very low degree of contamination 1.5 ≤ mCd < 2 low degree of contamination 2 ≤ mCd <4 moderate degree of contamination 4 ≤ mCd <8 high degree of contamination 8 ≤ mCd < 16 very high degree of contamination 16 ≤ mCd <32 extremely high degree of contamination mCd ≥ 32 ultra high degree of contamination Comparison of the results with the above terminol- ogies indicated that ultra degree of contamination is ob- served at the station 2/VL which is located near the out- lets of many industries. The other two stations 1/VL and 2/VL, near by the industrial units indicated very high degree of contamination. Moving towards the south a comparative decrease in the contamination was observed. The two stations, 4/VL and 5/VL experienced low degree of contamination. Sediment in the southern end indicated very low degree of contamination. The spatial variation of degree of contamination indicated that the movement of contaminated water and sediments from estuarine re- gion to southern half of Vembanad wetland system at the time of high tide contaminated the fresh water region to some extend. The pollution load index of the wetland follows the same order as the degree of contamination. If the PLI value is greater than one it indicates pollution and if it is less than one it shows no pollution. The PLI can provide information about the quality of the environment, which provides valuable information to the decision makers on the pollution level of the area. Hence according to PLI values all the stations in the wetland system is polluted. The sediment quality guidelines of the National Ocea- nographic and Atmospheric Administration (NOAA) of the Unite States shows Effect Range Low (ERL) and Effect Range Median (ERM) values, which represents the percentile ranges of toxicity tolerance in bioassay Copyright © 2011 SciRes. JEP  Ecotoxicity and Ecosystem Health of a Ramsar Wetland System of India 716 Figure 3. Variation of different sediment quality index val- ues for Vembanad wetland system. tests for aquatic and benthic biota. These effects are given by Metal < ERL minimal effect range biological effects are rarely observed ERL < Metal < ERM moderate effect range biological effects occur occasionally Metal > ERM probable effect range biological effects occur frequently The mean concentration of copper and zinc exceeded the ERM limits, which represents a probable effect range with in which adverse biological effects frequently occur. Spatial variation of trace elements indicated that biologi- cal effects are rare in southern half and frequent in estua- rine side. The potential acute toxicity for the sediments were determined by calculating the sum of toxic units and showed similar trend like mCd and PLI. The enrichment factor method normalizes the meas- ured heavy metal content with respect to a sample refer- ence such as iron. It can be used to differentiate between the metal originating from anthropogenic activities and those from natural procedure, and to assess the degree of anthropogenic influence. Five contamination categories are recognized on the basis of the enrichment factor, which are EF < 2 deficiency to minimal enrichment EF 2 - 5 moderate enrichment EF 5 - 20 significant enrichment EF 20 - 40 very high enrichment EF > 40 extremely high enrichment A value of 0.5 ≤ EF ≤ 1.5 suggests that traces of metal may be due to crystal materials or natural weathering processes. Samples having EF value greater than 5 are considered to be contaminated with that particular ele- ment. Figure 4 represents all the EF values of the heavy metals. The station 2/VL showed very high enrichment for the metal cadmium. It is presumed that high EF val- ues indicate an anthropogenic source of heavy metals, mainly from activities such as industrialization and ur- banization. Comparatively less enrichment was observed in samples of southern region. But according to Khan et al. [38] EF value less than one are considered significant. Areas with EF values <1 should be viewed with caution as they imply preferential release of these metals, making them bioavailabe. The Index of geo-accumulation calculated for the de- gree of metal pollution is assessed in terms of seven con- tamination classes based on the increasing numerical value of the index as follows: Igeo Igeo < 0 unpolluted 0 <= Igeo < 1 unpolluted to moderately polluted 1 <= Igeo < 2 moderately polluted 2 <= Igeo < 3 moderately polluted to strongly polluted 3 <= Igeo < 4 strongly polluted 4 <= Igeo < 5 strongly polluted to very strongly pol- luted Igeo >= 5 very strongly polluted Figure 5 represents the geo-accumulation index for different heavy metals in the wetland. It indicates strong pollution in the industrial zone and unpolluted to moder- ate pollution in the freshwater region. Elements copper Figure 4. Variation of enrichment factor along different stations. Figure 5. Variation of geo-accumulation index for different stations. Copyright © 2011 SciRes. JEP  Ecotoxicity and Ecosystem Health of a Ramsar Wetland System of India717 and cadmium have higher values in northern half where as it is very low in southern side. 4.3. Pearson’s Correlation Matrix Correlation analysis of heavy metals with organic matter present in the sediment was carried out. Zinc and nickel have good correlation with organic matter where as mercury have a strong negative correlation. The element cadmium has good correlation with all other elements except mercury. Copper also has good correlation with other metals except nickel and organic matter. The per- centage of different metals in the sediments of fresh wa- ter region with reference to industrial zone was calcu- lated. The concentration of nickel in both the regions was same, which indicated the higher mobility of the metal nickel. The lowest percentage was reported for copper, which indicated its lower mobility. The above facts were conformed from the correlation matrix, where nickel has good correlation with organic matter and copper have no correlation. Hence the concentration of the heavy metals in fresh water is a proportionate of the mobility of metal and contamination load at industrial side. 5. Conclusions The study of “Ecotoxicity and ecosystem health of a Ramsar wetland system of India” showed a clear pattern of anthropogenic impact on Vembanad wetland system. From the observation it is clear that manganese and cop- per showed more pronounced level followed by zinc, lead, nickel, cadmium and mercury. Comparison of heavy metal concentration with different international sediment quality guidelines indicated that most of the heavy metal concentration in the northern side of the wetland system has crossed the extreme limits where as southern half is with in the range of guideline values. The assessment of level of contamination by calculating the degree of contamination for different stations confirmed ultra degree of contamination at station near by industrial area. Enrichment factor determined for the deferent heavy metals indicated anthropogenic origin of heavy metal in estuarine side. Index of geo-accumulation was also showed the same trend like enrichment factor. Ac- cording to NOAA guidelines the health of the ecosystem was seriously impaired with frequent biological effects were occurring in estuarine side. The extend of pollution at the fresh water region also depends on the mobility of the specific metal. Nickel has higher mobility which has hundred percentage contribution, where as copper is less mobile which indicated its lowest contribution from the industrial zone. Anthropogenic source from the industrial activities at the upstream of the wetland contributed huge load of heavy metals to the estuarine region which is seriously attacking the fresh water region of the Vemba- nad wetland system. 6. Acknowledgements The authors wish to express their gratitude to the De- partment of Science and Technology (DST), Government of India for the financial assistance to carryout the re- search work. REFERENCES [1] A. S. Cohen, “Paliolimnology,” Oxford University Press, New York, 2003. [2] Fagbote Emmanuel Olubunmi and Olanipekun Edward Olorunsola, “Evaluation of the Status of Heavy Metal Pollution of Sediment of Agbabu Bitumen Deposit Area, Nigeria,” European Journal of Scientific Research, Vol. 41, No. 3, 2010, pp. 373-382. [3] O. K. Adeyemo, O. A. Adedokun, R. K. Yusuf and E. A. Adeleye, “Seasonal Changes in Physicao-Chemical Pa- rameters and Nutrient Load of River Sediment in Ibadan City, Nigeria,” Global NEST Journal, Vol. 10, No. 3, 2008, pp. 326-336. [4] O. A. Davies and J. F. N. Abowei, “Sediment Quality of Lower Reaches of Okpoka Creek, Niger Delta, Nigeria,” European Journal of Scientific Research, Vol. 26, No. 3, 2009, pp. 437-442. [5] S. M. Praveena, M. Radojevic, M. H. Abdullah and A. Z. Avis, “Factor-Cluster Analysis and Enrichment Study of Mangrove Sediments—An Example from Mengkabong Sabah,” The Malaysian Journal of Analytical Sciences, Vol. 2, No. 2, 2007, pp. 421-430. [6] A. Akinmosin, O. O. Osinowo and M. A. Oladunjoye, “Radiogenic Components of the Nigeria Tarsand Depos- its,” Earth Science Research Journal, Vol. 13, No. 1, 2009, pp. 64-73. [7] S. O. Ajayi and O. Osibanjo, “Pollution Studies in Nige- rian Rivers. Water Quality of Some Nigerian River,” En- vironment Pollution (Series B), Vol. 2, 1981, pp. 87-95. doi:10.1016/0143-148X(81)90044-6 [8] M. Chen and Q. Mal, “Comparison of Three Aqua Regia Digestion Methods for Twenty Florida Soils,” Soil Sci- ence Society of America Journal, Vol. 65, No. 2, 2001, pp. 491-499. doi:10.2136/sssaj2001.652491x [9] V. Sandroni, M. M. C. Smith and A. Donovan, “Micro- wave Digestion of Sediment, Soils and Urban Particulate Matter for Trace Metal Analysis,” Talanta, Vol. 60, No. 4, 2003, pp. 715-719. doi:10.1016/S0039-9140(03)00131-0 [10] S. Mc Cready, G. F. Birch and S. E. Taylor, “Extraction of Heavy Metals in Sydney Harbour Sediments Using 1M Hcl and 0.05M EDTA and Implications for Sediment Quality Guidelines,” Australian Journal of Earth Sci- ences, Vol. 50, No. 2, 2003, pp. 249-255. doi:10.1046/j.1440-0952.2003.00994.x [11] A. Jones-Lee and G. F. Lee, “Unreliability of Co-occur- Copyright © 2011 SciRes. JEP  Ecotoxicity and Ecosystem Health of a Ramsar Wetland System of India 718 Rence Based Sediment Quality Guidelines for Contami- nated Sediment Evaluation at Superfund/Hazardous Chemical Sites,” Journal of Remediation, Vol. 15, No. 2, 2005, pp. 19-33. doi:10.1002/rem.20040 [12] G. Perin, M. Bonardi, R. Fabris, B. Simoncini, S. Ma- nente, L. Tosi and S. Scotto, “Heavy Metal Pollution in Central Venice Lagoon Bottom Sediments: Evaluation of the Metal Bioavailability by Geochemical Speciation Procedure,” Environmental Technology, Vol. 18, No. 6, 1997, pp. 593-604. doi:10.1080/09593331808616577 [13] L. Hakanson, “Ecological Risk Index for Aquatic Pollu- tion Control. A Sedimentological Approach,” Water Re- Search, Vol. 14, 1980, pp. 975-1001. doi:10.1016/0043-1354(80)90143-8 [14] D. C. Tomlinson, J. G. Wilson, C. R. Harris and D. W. Jeffery, “Problems in the Assessment of Heavy Metals Levels in Estuaries and the Formation of a Pollution In- dex,” Helgol Wiss Meeresunters, Vol. 33, No. 1-4, 1980, pp. 566-575. doi:10.1007/BF02414780 [15] USEPA, “Sediment Classification Method Compen- dium,” EPA, Washington DC, 1992. [16] E. R. Long, D. D. Macdonald, S. L. Smith and F. D. Cal- der, “Incidence of Adverse Biological Effects with in Ranges of Chemical Concentrations in Marine and Estua- rine Sediments,” Environmental Management, Vol. 19, No. 1, 1995, pp. 81-97. doi:10.1007/BF02472006 [17] E. R. Long and D. D. Macdonald, “Recommended Use of Empirically Derived Sediment Quality Guidelines for Marine and Estuarine Ecosystems,” Humman and Eco- logical Risk Assessment, Vol. 4, No. 5, 1998, pp. 1019- 1039. doi:10.1080/10807039891284956 [18] D. D. McDonald, C. G. Ingersoll and T. A. Berger, “De- velopment and Evaluation of Consensus-Based Sediment Quality Guidelines for Freshwater Ecosystems,” Archives of Environmental Contamination and Toxicology, Vol. 39, No. 1, 2000, pp. 20-31. doi:10.1007/s002440010075 [19] G. Bakan and H. B. Ozkoc, “An Ecological Risk Assess- ment of the Impact of Heavy Metals in Surface Sediments on Biota from the Mid-Black Sea Coast of Turkey,” In- ternational Journal of Environmental Studies, Vol. 64, No. 1, 2007, pp. 45-57. [20] F. Pederson, E. Bjorestad, H. V. Anderson, J. Kjolholt and C. Poll, “Characterization of Sediments from Copen- hagen Harbour by Use of Biotests,” Water Science and Technology, Vol. 37, No. 6-7, 1998, pp. 233-240. doi:10.1016/S0273-1223(98)00203-0 [21] G. M. S. Abrahim and P. J. Parker, “Assessment of Heavy Metal Enrichment Factors and the Degree of Con- tamination in Marine Sediment from Tamaki Estuary, Auckland, New Zealand,” Environmental Monitoring and Assessment, Vol. 136, 2008, pp. 227-238. doi:10.1007/s10661-007-9678-2 [22] L. L. Mediolla, M. C. D. Domínguez and M. R. G. Sandoval, “Environmental Assessment of and Active Tailings Pile in the State of Mexico (Central Mexico),” Research Journal of Environmental Sciences, Vol. 2, No. 3, 2008, pp. 197-208. doi:10.3923/rjes.2008.197.208 [23] A. S. Jumbe and N. Nandini, “Heavy Metals Analysis and Sediment Quality Values in Urban Lakes,” American Journal of Environmental Sciences, Vol. 5, No. 6, 2009, pp. 678-687. doi:10.3844/ajessp.2009.678.687 [24] G. Müller, “Schwermetalle in Den Sedimenten des Rheins—Veränderungen Seit 1971,” Umschau, Vol. 79, 1979, pp. 778-783. [25] G. Müller, “Schwermetalle in den sedimenten des Elbe bei Stade,” Naturwissenschaften, Vol. 67, 1980, pp. 560- 561. doi:10.1007/BF00450667 [26] M. Singh, A. A. Ansari, G. Müller and I. B. Singh, “Heavy Metals in Freshly Deposited Sediments of the Gomati River (a Tributary of the Ganga River): Effects of Human Activities,” Environmental Geology, Vol. 29, No. 3-4, 1997, pp. 246-252. doi:10.1007/s002540050123 [27] M. Kralik, “A Rapid Procedure for Environmental Sam- pling and Evaluation of Polluted Sediments,” Applied Geochemistry, Vol. 14, No. 6, 1999, pp. 807-816. doi:10.1016/S0883-2927(98)00096-1 [28] P. Stoffers, G. P. Glasby, C. J. Wilson, K. R. Davies and P. Walter, “Heavy Metal Pollution in Wellington Harbor. New Zealand,” Journal of Marine Freshwater Research, Vol. 20, 1986, pp. 495-512. doi:10.1080/00288330.1986.9516169 [29] G. W. Bryan and W. J. Langston, “Bioavailability, Ac- cumulation and Effects of Heavy Metals in Sediments with Special Reference to United Kingdom Estuaries: A Review,” Environmental Pollution, Vol. 76, No. 2, 1992, pp. 89-131. doi:10.1016/0269-7491(92)90099-V [30] W. W. Dickinson, G. B. Dunbar and H. McLeod, “Heavy Metal History from Cores in Wellington Harbour, New Zealand,” Environmental Geology, Vol. 27, No. 1, 1996, pp. 57-69. doi:10.1007/BF00770603 [31] K. K. T. Balachandran, M. Joseph, V. N. Nair, V. K. Sankaranarayanan and P. Sheeba, “Geochemistry of Surficial Sediments along the Central Southwest Coast of India-Seasonal Changes in Regional Distribution,” Jour- nal of Coastal Research, Vol. 19, No. 3, 2003, pp. 664- 683. [32] P. S. Harikumar, K. Madhavan, P. Shimjidha and K. R. Bindu, “Study on Hydrochemistry and Sediment Quality of Vemband Lake in the Southwest (Kerala) Coast of In- dia,” Eco-Chronicle, Vol. 2, No. 2, 2007, pp. 69-80. [33] P. S. Harikumar and U. P. Nasir, “Ecotoxicological Im- pact Assessment of Heavy Metals in Core Sediments of a Tropical Estuary,” Ecotoxicology and Environmental Safety, Vol. 73, No. 7, 2010, pp. 1742-1747. doi:10.1016/j.ecoenv.2010.08.022 [34] P. S. Harikumar, U. P. Nasir, and M. P. M. Rahman, “Distribution of Heavy Metals in the Core Sediments of a Tropical Wetland System,” International Journal of En- vironmental Science and Technology, Vol. 6, No. 2, 2009, pp. 222-232. [35] ASTM, “D 3974, Standard Practices for Extraction of Trace Elements from Sediments,” ASTM International, 100 Barr Harber Drive, West Conshohocken, 1981, pp. 393-395. Copyright © 2011 SciRes. JEP  Ecotoxicity and Ecosystem Health of a Ramsar Wetland System of India Copyright © 2011 SciRes. JEP 719 [36] H. J. M. Bowen, “Environmental Chemistry of the Ele- ments,” Academic Press, New York, 1979. [37] G. Muller, “Index of Geoaccumulation in Sediments of the Rhine River,” Geojournal, Vol. 2, No. 3, 1969, pp. 108-118. [38] A. H. Khan, R. F. Nolting, S. J. V. Gaast and W. Van Raaphorst, “Trace Element Geochemistry at the Sediment Water Interface in the North Sea and the Western Wad- den Sea,” Netherlands Institute for Sea Research. NIOZ Report 1992-10, BARC Report 1992-1, BEON Report 18, 1992. |