

Paper Menu >>
Journal Menu >>
 Open Journal of Physical Chemistry, 2011, 1, 45-54 doi:10.4236/ojpc.2011.12007 Published Online August 2011 (http://www.SciRP.org/journal/ojpc) Copyright © 2011 SciRes. OJPC 45 Thermal Degradation Studies of Some Strongly Acidic Cation Exchange Resins Pravin U. Singare*1, Ram S. Lokhande2, Rupa S. Madyal3 1Department of Chemistry, Bhavan’s College, Andheri, Mumbai, India 2Department of Chemistry, University of Mumbai, Vidyanagari, Santacruz, Mumbai, India 3Department of Chemistry, South Indians’ Welfare Society College, Sion, Mumbai, India E-mail: [email protected] Received April 19, 2011; revised June 13, 2011; accepted July 22, 2011 Abstract The thermal degradation of some sulfonic cationites namely Amberlite IR-120, Indion-223 and Indion-225 was investigated using instrumental techniques like thermal analysis (TG) and Scanning Electron Micros- copy (SEM). Fourier Transform Infrared Spectroscopy (FTIR) was used to characterize the resins degrada- tion steps. The sulfonic cationites undergo degradation through dehydration, followed by decomposition of sulfonic acid functional groups liberating SO2. The thermogravimetric analysis of above cationites at higher temperature up to 520˚C, show mass loss of 61.61% and 25.43% respectively for Indion-223 and Indion-225, while Amberlite IR-120 cationite get burned off completely. Keywords: Sulfonic Cationites, Thermal Degradation, FTIR, SEM, Nuclear Resin, Thermal Analysis 1. Introduction Ion-exchange resins are produced and commercialized in a wide range of formulations with different characteris- tics, and have now a large practical applicability in vari- ous industrial processes, such as chemical, and nuclear industry for treatment of liquid waste [1-16]. For their versatile properties, the cationic resins are used both in the ion exchange area and in the heterogeneous catalysis field [17]. These resins exhibit a high exchange capacity and an excellent osmotic shock resistance. So, the cati- onic resins, produced with a high degree of purity, be- came important as catalysts in various food technologies [18] and for purification in heavy-water moderated nu- clear reactors in nuclear industries [19-21]. In many cases their use is limited by the relatively low thermal stability [22]. Hence, knowledge of the thermal behavior of cation exchange resins is necessary. Abundant data exist on the thermal degradation of anion exchange res- ins [23-25] and on carboxylic cationites with low acidity [26-27]; literature seems to offer relatively poor informa- tion on polystyrene-divinylbenzene sulfonic cationites [28-33]. Therefore, in the present investigation thermal degradation of strongly acidic sulfonic cationites was performed to understand the degradation steps and to compare the relative thermal stability. 2. Experimental 2.1. Materials The following commercial cationites were used: · Strongly acidic gel-type resin with sulfonic acid functionality based on styrene-divinylbenzene matrix: Amberlite IR-120 (Rohm and Haas Co, USA). · Nuclear grade strongly acidic gel-type resin with sulfonic acid functionality based on styrene-divinyl- benzene matrix: Indion-223 (Ion Exchange India Ltd., Mumbai). · Strongly acidic gel-type resin with sulfonic acid fun- ctionality based on styrene-divinylbenzene matrix: Indion-225 (Ion Exchange India Ltd., Mumbai). The details regarding the physical properties of catio- nites used are given in Table 1. The soluble impurities of the resins were removed by repeated soxhlet extraction using water and occasionally with distilled methanol to remove non polymerized im- purities. The resins were then dried over P2O5 in desic- cators at room temperature. 2.2. Thermal Analysis The thermogravimetric experiments were performed on a  46 P. U. SINGARE ET AL. Table 1. The main characteristics of the investigated catio- nites. Cationites Exchange Capacity (mEq./mL) Particle size Moisture Content (%) Maximum Temperature Stability ˚C Amberlite IR-120 1.9 16 - 50 mesh 45 121 Indion-223 1.8 0.3 - 1.2 mm 53 120 Indion-225 2.0 0.3 - 1.2 mm 50 120 DTG-60H, (Shimadzu, Japan) thermal analysis system between 30˚C - 550˚C using aluminum cell (6 mm in diameter and 2.5 mm in depth). The measurements of resin samples were carried out in nitrogen flow (50 mL· mi n –1) at heating rate (β = 10 K·min–1). The mass of resin sample used was ~5 - 20 mg. In order to character- ize the decomposition steps of the investigated ion-ex- change resins, FTIR and Scanning Electron Microscopy (SEM) were used in addition to thermal analysis. 2.3. FTIR Spectra FTIR spectra (in 4000 - 450 cm–1 range) of thermal de- composed samples, up to the characteristics mass-loss steps temperatures, were recorded in KBr pellets (2 mg cationite/200 mg KBr) using a FTIR PerkinElmer 1750 spectrophotometer. Since in the thermal analysis, the major weight loss was observed between 200˚C - 400˚C, the resin samples were heated in an oven for 3h at 10˚C higher tempera- tures above the maximum operating temperature, and also at 200 and 400˚C. The thermal degradation of resin was studied by comparing the spectra of fresh and heated resin samples. 2.4. Scanning Electron Microscopy (SEM) The thermal degradation studies of ion exchange resins was also studied by examining the surface morphology of fresh resin samples and samples heated at 400˚C using JSM-6380LA Scanning Electron Microscope (Jeol Ltd., Japan).The powders were precisely fixed on an alumi- num stub using double-sided graphite tape and then were made electrically conductive by coating in a vaccum with a thin layer of carbon, for 30 seconds and at 30 W. The pictures were taken at an excitation voltage of 10 - 15 KV and a magnification of ×100 and ×130. 3. Results and Discussion 3.1. Characterization and Thermal Degradation Study of Amberlite IR-120: 3.1.1. TGA Analysis Figure 1 represents a dynamic weight loss profile of Amberlite IR-120 from room temperature to 550˚C. Thermogravimetric curve of Amberlite IR 120 shows 22% weight loss up to 200˚C due to moisture content and the weight decreased gradually till 400˚C. Above 400˚C whole compound burned off completely and weight loss measurement was not possible. 3.1.2. FT IR Analysis Figure 2 shows the IR spectrum of the fresh resin sam- ple Amberlite IR-120. The bands at 2923 and 2876 cm–1 are due to the aliphatic C-H stretching absorbance of methyl group in the main chain and in aromatic rings and of methylene group respectively. SO2 asymmetric stre- tching at 1382 cm–1. Strong band at 1652 cm–1 indicates aromatic C=C bond. The four sharp peaks at 1009 cm–1 , 1037 cm–1, 1126 cm–1, 1186 cm–1 are due to SO3 sym- metric stretching. The peaks at 1500 - 1600 cm–1 are due to deformation and skeletal vibrations of C-H in DVB. Bands appear at 2366 cm–1 which may be assigned to O-H stretching vibration originating from the polymer. At 200˚C, the 21% weight loss was observed without any loss of peak in the IR spectra. At 400˚C IR investi- gation indicates that the peaks in the region 1500 - 1000 cm–1 either shows a general broadening or no longer ex- ists (Figure 3). Non-existence of the SO unit was con- firmed by the absence of the peaks from 1500 - 1000cm–1, with decomposition of the functional group i.e. sulfonic portions of the ring. But slight broadening of the band is observed at 1652 cm–1 for aromatic C=C bond remained unchanged. This corresponds to the few chain scissions in the DVB matrix. 3.1.3. SEM Anal ysi s Figure 4, shows the surface morphology of Amberlite IR-120 resins at room temperature indicating plane sph- erical structure. At 400˚C, resin show large cracks and thread like appearance on the surface (Figure 5). 3.2. Characterization and Thermal Degradation Study of Indion-223: 3.2.1. TGA Analysis Thermogravimetric curve of Indion—223H+ shown in Figure 6. The 30% weight loss up to 200˚C can be at- tributed to moisture content. The second major weight loss begins at 270˚C and ends at 400˚C, which might be due to slow degradation of side chain and loss of sul- phonic functional group. The mass loss from 400˚C to 521˚C was gradual which might be due to degradation of styrene/DVB matrix. 3.2.2. FT IR Analysis T he IR spectrum of Indion-223 in the 3700 - 400 cm−1 Copyright © 2011 SciRes. OJPC  P. U. SINGARE ET AL. Copyright © 2011 SciRes. OJPC 47 Figure 1. TG curve of Amberlite IR-120. Figure 2. IR spectrum of Amberlite IR-120 at room temperture.  P. U. SINGARE ET AL. Copyright © 2011 SciRes. OJPC 48 Figure 3. IR spectrum of Amberlite IR-120 at different tem- perture. Figure 4. Scanning electron micrograph of the surface of the Amberlite IR-120 at room temperature. Figure 5. Scanning electron micrograph of the surface of the Amberlite IR-120 at 400˚C. region is shown in Figure 7. FTIR spectral analysis shows SO3 sharp symmetric stretching band at 1005 - 1126 cm–1. O-H stretching at 2364 cm–1. S-O stretching at 668 cm–1. SO2 asymmetric stretching at 1382 cm–1. C=C aromatic nucleus skeletal vibration band at 1500 - 1600 cm–1 and OH hydrogen bonded broad stretching band at 3200 - 3500 cm–1. The band at 2900 cm–1 attrib- uted to C-H stretching vibrations in the main chain and in aromatic rings; the peaks at 1500 - 1600 cm–1 are due to deformation and skeletal vibrations of C-H in Poly- styrene/DVB. FTIR investigation shows that that strong bands at 668 cm–1, 1019cm–1 and 1382 cm–1 which are related to SO and 2364cm–1 stretching frequency of C-H units re- mained upto 200˚C, but at 400˚C both the groups disap- peared (Figure 8). This indicates that at 200˚C the 29.7% weight loss is due to moisture, whereas 31.8% loss is due to the functional group i.e. SO and breaking of C-H bond. 3.2.3. SEM Anal ysi s Surfaces of resins at room temperature (Figure 9) and at 400˚C (Figure 10) were examined by a Jeol JSM- 6380LA scanning electron microscope. It was found that at 400˚C resin showed crack in the spherical structure which supports breaking of polymer matrix at that tem- perature. 3.3. Characterization and Thermal Degradation Study of Indion-225: 3.3.1. TGA Analysis Thermogravimetric curve of Indion-225 H+ is shown in Figure 11. Thermogravimetric curve shows ~13% weight loss up to 200˚C, corresponding to the moisture content. Degradation of resin between 270˚C - 340˚C takes place sharply and further gradually up to 521˚C which might be due to decomposition of the sulphonic functional group with rapid evolution of SO3 or SO2 showing mass loss of ~12.5%. 3.3.2. FT IR Analysis The IR spectrum of Indion-225 H+ in the 3700 - 400 cm–1 region is shown in Figure 12. FTIR spectral analy- sis shows four sharp peaks at 1009 cm–1 , 1037 cm–1, 1126 cm–1, 1186 cm–1 are due to SO3 symmetric stretching. O- H stretching at 2900 - 2400 cm–1. S-O stretching at 672 cm–1. C=C aromatic nucleus skeletal vibration band at 1550 - 1670 cm–1 and OH hydrogen bonded broad stretching band at 3200 - 3500 cm–1. The sharp peak at 2900 cm–1 range attributed to C-H stretching skeletal vibrations of C-H in Polystyrene/DVB. The degradation occurs in a single step and mass loss is 25% up to 521˚C. SO2 is the dominate product evolved at 190˚C and 380˚C while water is also present during the entire degradation pathway but in relatively small amount. Loss of SO unit can also be confirmed by IR investigation. The characteristic band for SO unit at 1009 cm–1 , 1037 cm–1, 1126 cm–1,1186 cm–1 are no longer exist (Figure 13). The evolution of water occurs in the same temperature regime as SO2, between 185 and 400˚C, as spectrum at 200˚C shows broadened bands indicating light decrease in SO content. This is likely due to the s 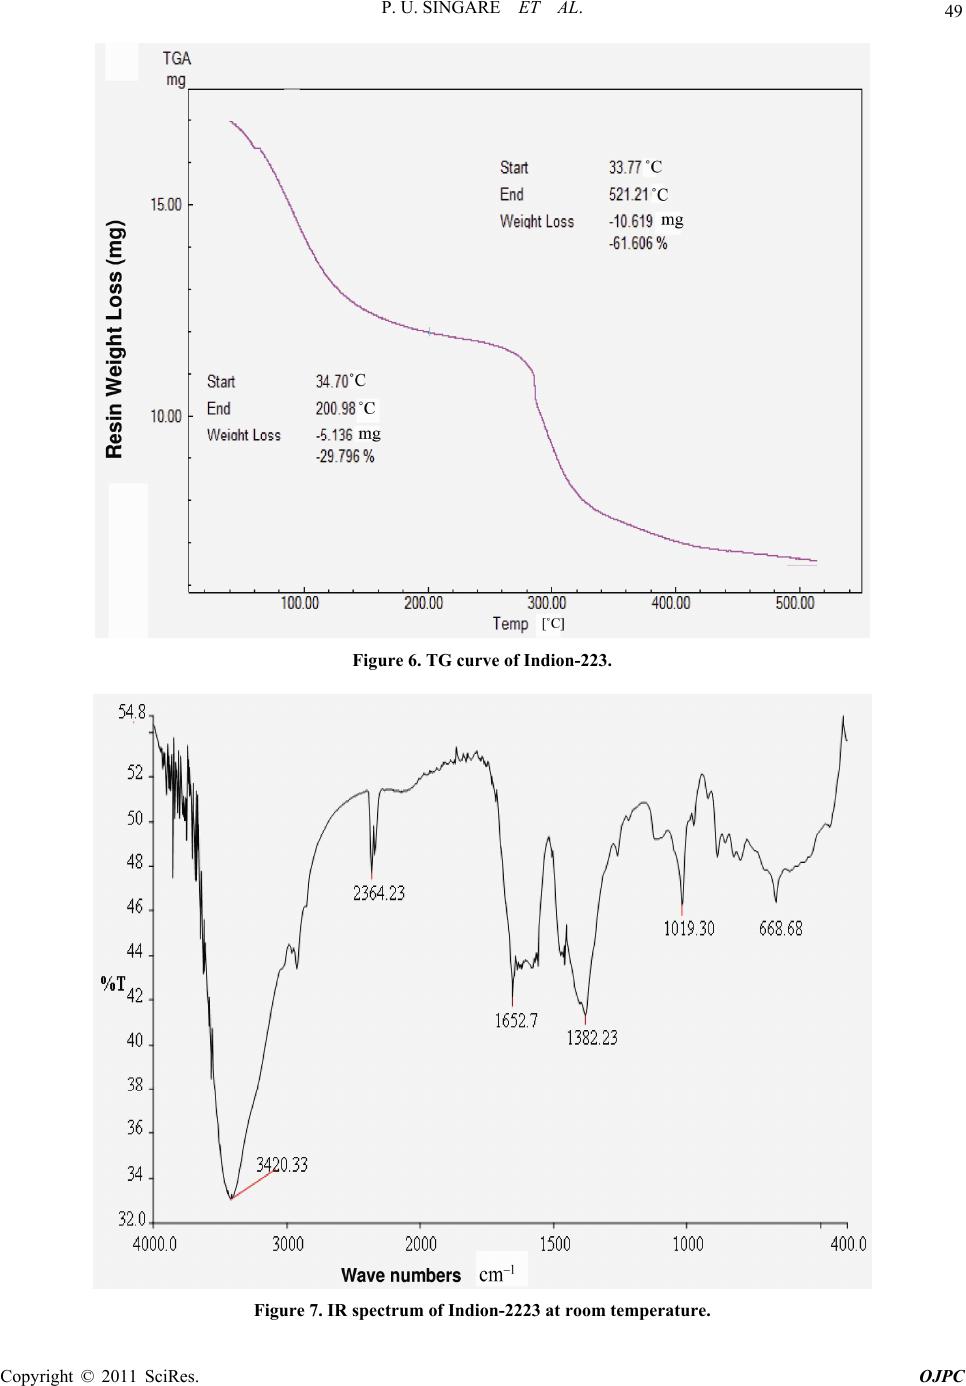 P. U. SINGARE ET AL. Copyright © 2011 SciRes. OJPC 49 Figure 6. TG curve of Indion-223. Figure 7. IR spectrum of Indion-2223 at room temperature. 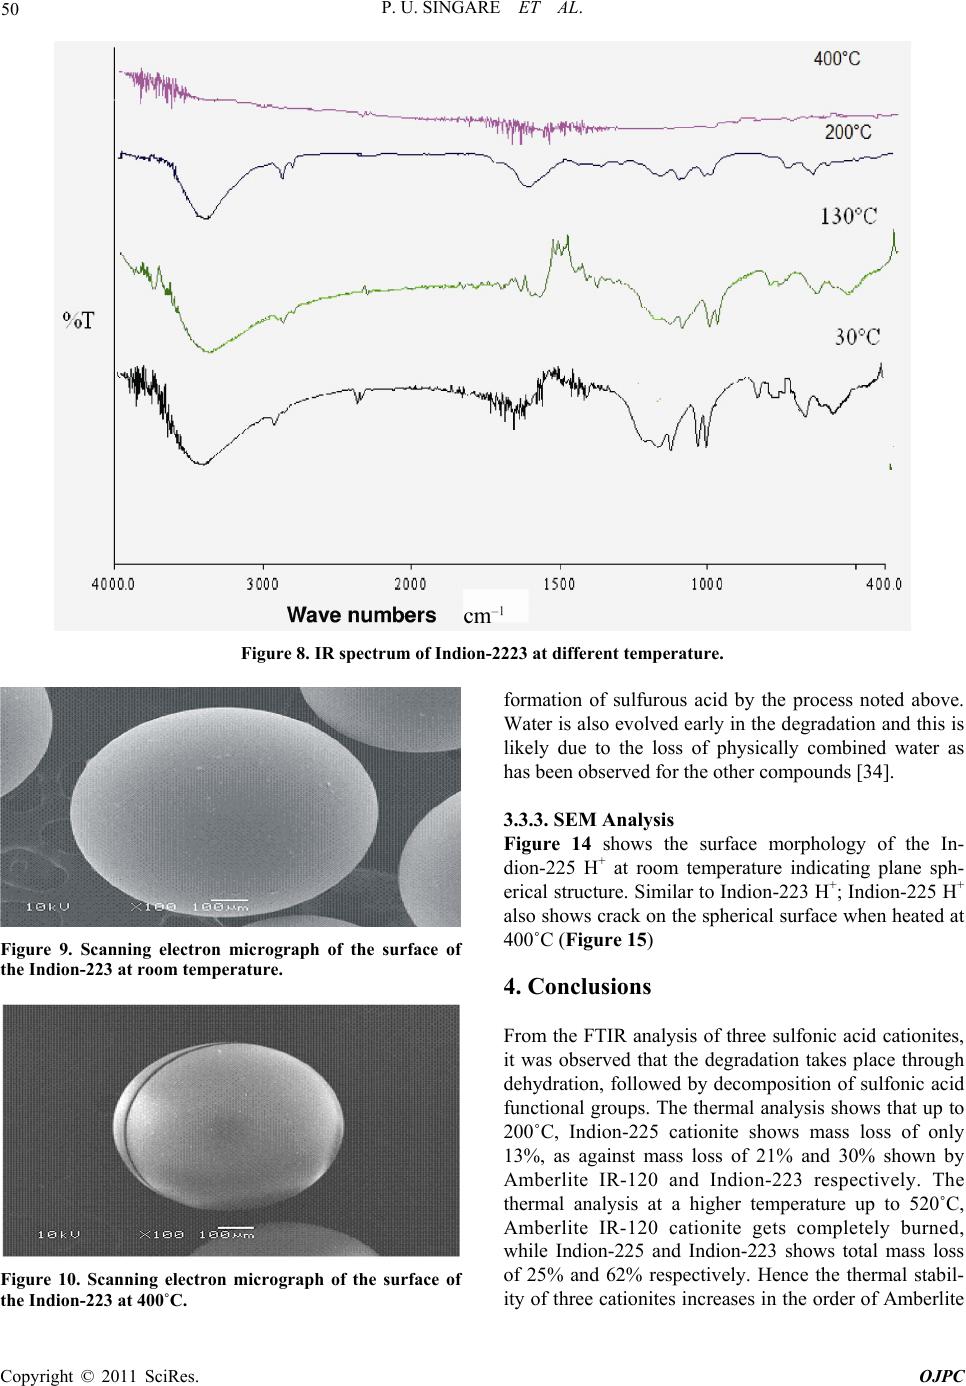 50 P. U. SINGARE ET AL. Figure 8. IR spectrum of Indion-2223 at different temperature. Figure 9. Scanning electron micrograph of the surface of the Indion-223 at room temperature. Figure 10. Scanning electron micrograph of the surface of the Indion-223 at 400˚C. formation of sulfurous acid by the process noted above. Water is also evolved early in the degradation and this is likely due to the loss of physically combined water as has been observed for the other compounds [34]. 3.3.3. SEM Anal ysi s Figure 14 shows the surface morphology of the In- dion-225 H+ at room temperature indicating plane sph- erical structure. Similar to Indion-223 H+; Indion-225 H+ also shows crack on the spherical surface when heated at 400˚C (Figure 15) 4. Conclusions From the FTIR analysis of three sulfonic acid cationites, it was observed that the degradation takes place through dehydration, followed by decomposition of sulfonic acid functional groups. The thermal analysis shows that up to 200˚C, Indion-225 cationite shows mass loss of only 13%, as against mass loss of 21% and 30% shown by Amberlite IR-120 and Indion-223 respectively. The thermal analysis at a higher temperature up to 520˚C, Amberlite IR-120 cationite gets completely burned, while Indion-225 and Indion-223 shows total mass loss of 25% and 62% respectively. Hence the thermal stabil- ty of three cationites increases in the order of Amberlite i Copyright © 2011 SciRes. OJPC 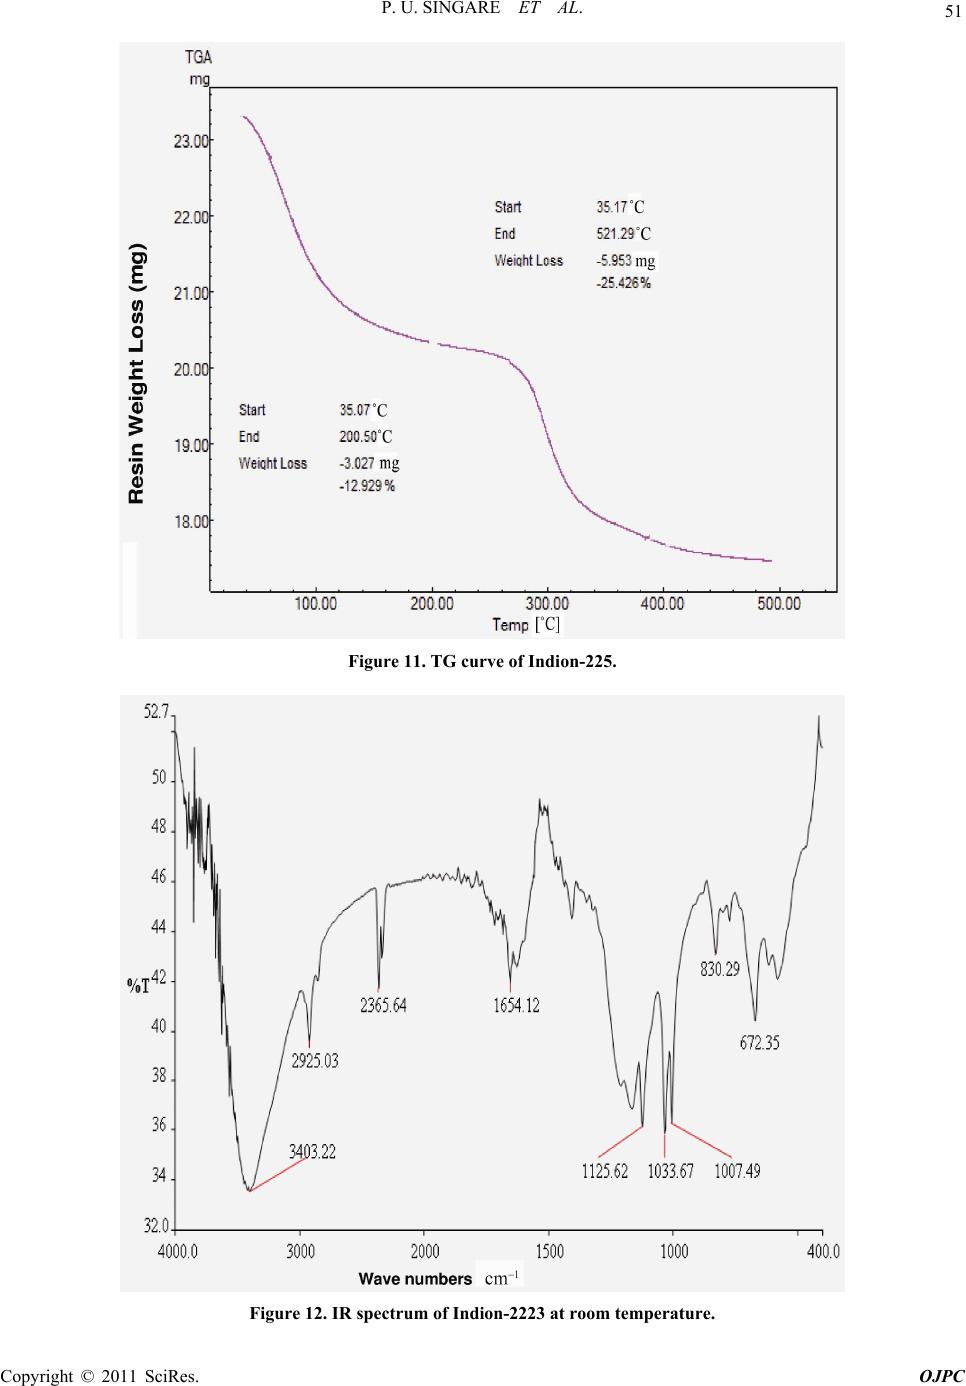 P. U. SINGARE ET AL. Copyright © 2011 SciRes. OJPC 51 Figure 11. TG curve of Indion-225. Figure 12. IR spectrum of Indion-2223 at room temperature. 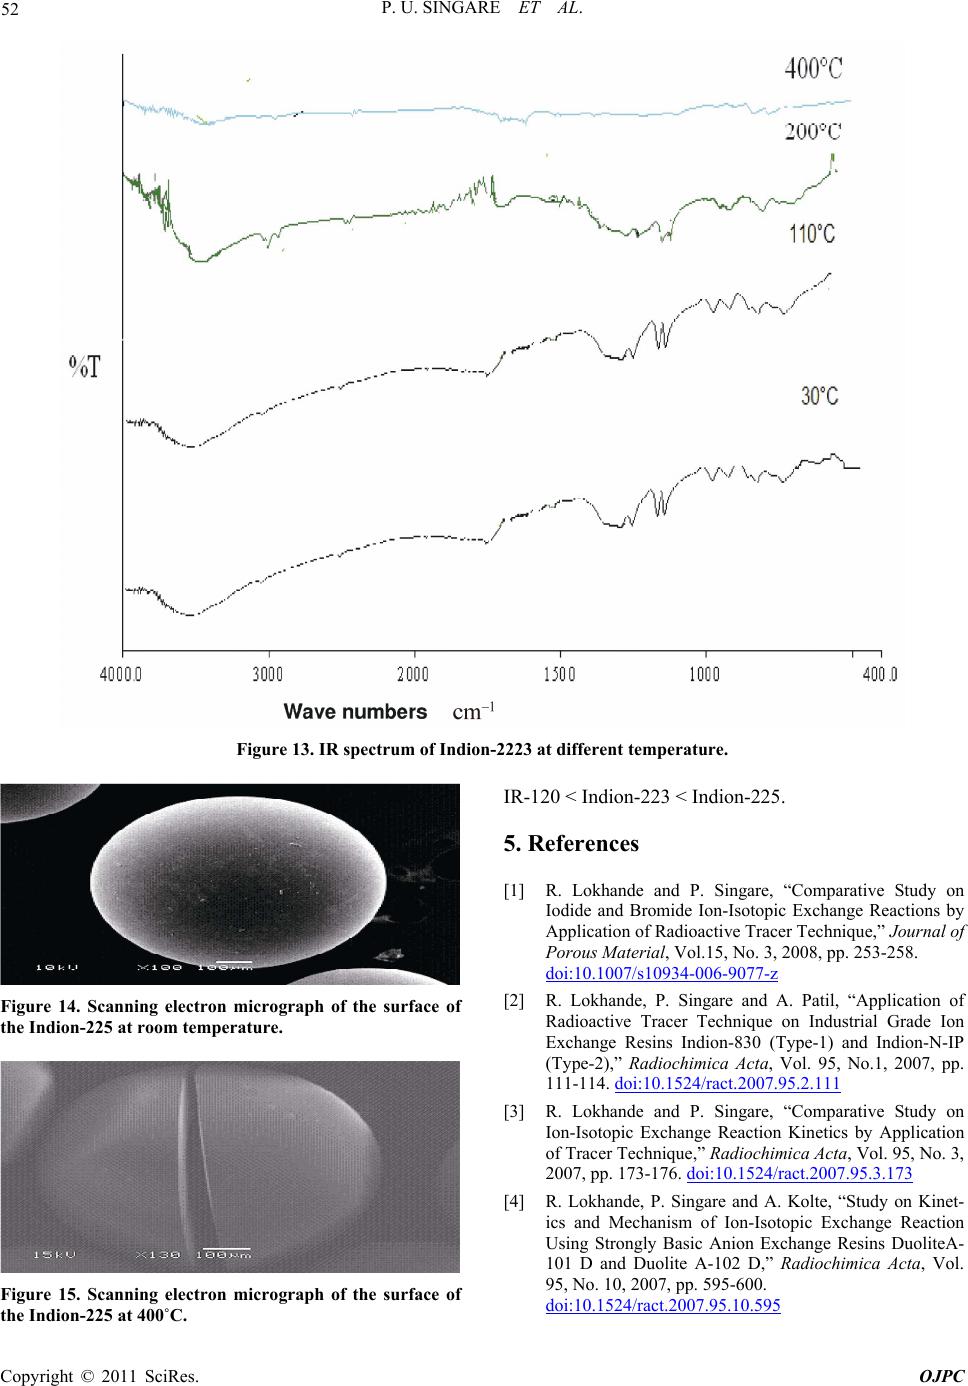 52 P. U. SINGARE ET AL. Figure 13. IR spectrum of Indion-2223 at different temperature. Figure 14. Scanning electron micrograph of the surface of the Indion-225 at room temperature. Figure 15. Scanning electron micrograph of the surface of the Indion-225 at 400˚C. IR-120 < Indion-223 < Indion-225. 5. References [1] R. Lokhande and P. Singare, “Comparative Study on Iodide and Bromide Ion-Isotopic Exchange Reactions by Application of Radioactive Tracer Technique,” Journal of Porous Material, Vol.15, No. 3, 2008, pp. 253-258. doi:10.1007/s10934-006-9077-z [2] R. Lokhande, P. Singare and A. Patil, “Application of Radioactive Tracer Technique on Industrial Grade Ion Exchange Resins Indion-830 (Type-1) and Indion-N-IP (Type-2),” Radiochimica Acta, Vol. 95, No.1, 2007, pp. 111-114. doi:10.1524/ract.2007.95.2.111 [3] R. Lokhande and P. Singare, “Comparative Study on Ion-Isotopic Exchange Reaction Kinetics by Application of Tracer Technique,” Radiochimica Acta, Vol. 95, No. 3, 2007, pp. 173-176. doi:10.1524/ract.2007.95.3.173 [4] R. Lokhande, P. Singare and A. Kolte, “Study on Kinet- ics and Mechanism of Ion-Isotopic Exchange Reaction Using Strongly Basic Anion Exchange Resins DuoliteA- 101 D and Duolite A-102 D,” Radiochimica Acta, Vol. 95, No. 10, 2007, pp. 595-600. doi:10.1524/ract.2007.95.10.595 Copyright © 2011 SciRes. OJPC  P. U. SINGARE ET AL. 53 [5] R. Lokhande, P. Singare and M. Dole, “Comparative Study on Bromide and Iodide Ion-Isotopic Exchange Re- actions Using Strongly Basic Anion Exchange Resin Duolite A-113,” Journal of Nuclear and Radiochemical Science, Vol. 7, No. 2, 2006, pp. 29-32. [6] R. Lokhande, P. Singare and P. Karthikeyan, “The Ki- netics and Mechanism of Bromide Ion Isotope Exchange Reaction in Strongly Basic Anion-Exchange Resin Duolite A-162 Determined by the Radioactive Tracer Technique,” Russian Journal of Physical Chemistry A, Vol. 81, No. 11, 2007, pp. 1768-1773. doi:10.1134/S0036024407110088 [7] R. Lokhande, P. Singare and M. Dole, “Application of Radiotracer Technique to Study the Ion Isotope Exchange Reactions Using a Strongly Basic Anion-Exchange Resin Duolite A-113,” Radiochemistry, Vol. 49, No. 5, 2007, pp. 519-522. doi:10.1134/S106636220705013X [8] R. Lokhande, P. Singare and A. Patil, “Application of Radioactive Tracer Technique for Characterization of some Strongly Basic Anion Exchange Resins,” Radio- chimica Acta, Vol. 96, No. 2, 2008, pp. 99-104. doi:10.1524/ract.2008.1465 [9] R. Lokhande, P. Singare and S. Tiwari, “Study of Bro- mide Ion-Isotopic Exchange Reaction Kinetics Using a Weakly Basic Macro Porous Resin Indion-860,” Radio- chemistry, Vol. 50, No. 6, 2008, pp. 633-637. doi:10.1134/S106636220806009X [10] R. Lokhande, P. Singare and S. Parab, “Application of Radioactive Tracer Technique to Study the Kinetics of Iodide Ion-Isotopic Exchange Reaction Using Strongly- Basic Anion Exchange Resin Duolite A-116,” Radio- chemistry, Vol. 50, No. 6, 2008, pp. 642-644. doi:10.1134/S1066362208060118 [11] R. Lokhande, P. Singare and V. Patil, “Application of Radioactive Tracer Technique to Study the Kinetics and Mechanism of Reversible Ion-Isotopic Exchange Reac- tionusing Strongly Basic Anion Exchange Resin Indion -850,” Radiochemistry, Vol. 50, No. 6, 2008, pp. 638- 641. doi:10.1134/S1066362208060106 [12] R. Lokhande, P. Singare and T. Prabhavalkar, “The Ap- plication of the Radioactive Tracer Technique to Study the Kinetics of Bromide Isotope Exchange Reaction with the Participation of Strongly Basic Anion Exchange Resin Indion FF-IP,” Russian Journal of Physical Chem- istry A, Vol. 82, No. 9, 2008, pp. 1589-1595. doi:10.1134/S0036024408090331 [13] R. Lokhande, P. Singare and A. Kolte, “Application of Radioactive Tracer Technique for Characterization of Strongly Basic Anion Exchange Resins Duolite A 101D and Duolite A 102D,” Radiochemistry, Vol. 52,No. 1, 2010, pp. 81-86. doi:10.1134/S1066362210010182 [14] R. Lokhande, P. Singare and S. Tiwari, “Application of 82Br as a Radioactive Tracer Isotope to Study the Bro- mide Ion-Isotopic Exchange Reaction in Strongly Basi- cAnion Exchange Resin Duolite-A161,” Russian Journal of Physical Chemistry A, Vol. 83, No. 8, 2009, pp. 1389-1394. doi:10.1134/S003602440908024X [15] S. K. Samanta, T. K. Theyyunni, B. M. MISRA, “Col- umn Behavior of Aresorcinol-Formaldehyde Polycon- densate Resin for Radio Cesium Removal Fromsimulated Radwaste Solution,” Journal of Nuclear Science and Technology, Vol. 32, No. 4, 1995, pp. 425-429. doi:10.3327/jnst.32.425 [16] International Atomic Energy Agency, “Advances in Technologies for the Treatment of Low and Intermediate Level Radioactive Liquid Wastes,” Technical Reports Series, No. 370, IAEA, Vienna, 1994. [17] B. Saha and M. Streat, “Cation Exchange Resin- Cata- lysed Esterification of Acetic Acid with 2-(1-Cyclohex- enyl) Cyclohexanone,” Catalysis Letters, Vol. 51, No. 1-2, 1998, pp. 121-127. doi:10.1023/A:1019084901133 [18] E. Dickinson and G. Stanisly, “Colloids and Foods,” Ap- plied Science Publisher, London, New York, 1982, p. 220. [19] International Atomic Energy Agency, “Operation and Control of Ion Exchange Processes for Treatment of Ra- dioactive Wastes,” Technical Reports Series, No. 78, IAEA, Vienna, 1967. [20] International Atomic Energy Agency, “Treatment of Low- and Intermediate-Level Liquid Radioactive Wastes,” Technical Reports Series, No. 236, IAEA, Vi- enna, 1984. [21] C. Simister, F. Caron and R. Gedye, “Determination of the Thermal Degradation Rate of Polystyrene-Divinyl Benzene Ion Exchange Resins in Ultra-Pure Water at Ambient and Service Temperature,” Journal of Radio- analytical and Nuclear Chemistry, Vol. 261, No. 3, 2004, pp. 523-531. doi:10.1023/B:JRNC.0000037092.52163.3d [22] Yu. Egiazarov, V. Radkevich, L. Kravchuk and A. Ivko, “Thermal Stability and Activity in Hydrogen Oxidation of Palladium Catalysts Supported on Fibrous Sulfonic Cation Exchanger in the Hydrogen and Magnesium Forms,” RussianJournal of Applied Chemistry, Vol. 77, No. 9, 2004, pp. 1500-1504. doi:10.1007/s11167-005-0059-8 [23] M. Hyder, S. Bartenev, L. Lazarev, V. Romanovskiy, S. Strelkov, G. Zachinyaev, E. Nazin, A. Aldochin, Y. Glagolenko, A. Maliych and S. Rovniy, “Russian Studies of the Safety of Anion Exchange in Nitric Acid,” Separa- tion Science and Technology, Vol. 34, No. 6-7, 1999, pp. 1183-1194. doi:10.1080/01496399908951088 [24] M. Tomoi, K. Yamaguchi, R. Ando, Y. Kantake, Y. Aosaki and H. Kubota, “Synthesis and Thermal Stability of Novel Anion Exchange Resins with Spacerchains,” Journal of Applied Polymer Science, Vol. 64, No. 6, 1997, pp. 1161-1167. doi:10.1002/(SICI)1097-4628(19970509)64:6<1161::AI D-APP16>3.0.CO;2-Z [25] P. Tulupov and N. Polyanskii, “Thermal Stability of An- ion-ExchangeResins,” Russian Chemical Review, Vol. 42, No. 9, 1973, pp. 754-771. doi:10.1070/RC1973v042n09ABEH002730 [26] A. Chapiro and P. Seidler, “Preparation et Proprietes de Quelques Membranes Semi-permeables Obtenues par Greffage de Films de Polytetrafluoroethylene dans leur Masse,” European Polymer Journal, Vol. 1, No. 3, 1965, Copyright © 2011 SciRes. OJPC  P. U. SINGARE ET AL. Copyright © 2011 SciRes. OJPC 54 pp. 189-205. doi:10.1016/0014-3057(65)90037-6 [27] D. Chambree, C. Iditoiu, E. Segal and A. Cesaro, “The Study of Non-isothermal Degradation of Acrylic Ion-Ex- Change Resins,” Journal of Thermal Analysis and Calo- rimetry,Vol. 82, No. 3, 2005, pp. 803-811. doi:10.1007/s10973-005-0967-0 [28] C. Iditoiu, E. Segal and D.Chambree, “Kinetics of Non-isothermal Behaviour of Synthetic Cationites with Low Acidity,” Journal of Thermal Analysis and Calo- rimetry, Vol. 56, No. 1, 1999, pp. 407-417. doi:10.1023/A:1010171222225 [29] C. Iditoiu, C. Popescu and D. Chambre, “Non-isothermal Dehydration Kinetics of Some Cationites,” Journal of Thermal Analysis and Calorimetry, Vol. 55, No. 3, 1999, pp. 885-893. doi:10.1023/A:1010142102614 [30] M. Matsuda, K. Funabashi, T. Nishi, H. Yusa and M. Kikuchi, “Decomposition of Ion Exchange Resins by Pyrolysis,” Nuclear Technology, Vol. 75, No. 1, 1986, pp. 187-193. [31] M. Matsuda, K. Funabashi and H. Yusa, “Influence of Functional Sulfonic Acid Group on Pyrolysis Character- istics for Cation Exchange Resin,” Journal of Nuclear Science and Technology, Vol. 24, No. 2, 1987, pp. 124- 128. doi:10.3327/jnst.24.124 [32] S. Petterson and G. Kemmler, “Experience of Resin Py- rolysis,” Waste Management, Arizona Board of Regents, Vol. 2, 1984, pp. 223-225. [33] L. Petrus, E. Stamhuis and G. Joosten, “Thermal Deacti- vation of Strong-Acid Ion-Exchange Resins in Water,” Industrial and Engineering Chemistry Product Research and Development, Vol. 20, No. 2, 1981, pp. 366-371. doi:10.1021/i300002a026 [34] B. Boinon, D. Ainad-Tabet and J. Montheard, “Thermal Degradation of Poly Ortho Chloro Methyl Styrene and Polymetachloromethylstyrene,” Polymer Degradation and Stability, Vol. 28, No. 2, 1990, pp. 197-207. doi:10.1016/0141-3910(90)90006-S |