

Paper Menu >>
Journal Menu >>
 J. Biomedical Science and Engineering, 2011, 4, 529-534 doi:10.4236/jbise.2011.48068 Published Online August 2011 (http://www.SciRP.org/journal/jbise/ JBiSE ). Published Online August 2011 in SciRes. http://www.scirp.org/journal/JBiSE Pattern of respiratory-induced changes in fingertip blood volume measured by light transmission Meir Nitzan1, Daniel Dayan1, Eran Shalom1, Yu val Slovik2, Alan Murray3 1Department of Applied Physics/Medical Engineering, Jerusalem College of Technology, Jerusalem, Israel; 2Department of Otorhinolaringology, Head and Neck Surgery, Soroka University Medical Center, Beer Sheva, Israel; 3Department of Medical Physics Freeman Hospital, Newcastle, UK. Email: [email protected] Received 16 May 2011; revised 13 June 2011; accepted 5 July 2011. ABSTRACT Respiratory-induced fluctuations in heart rate and arterial blood pressure have been intensively investi- gated, but there is little information on the effect of respiration on peripheral blood volume. In the cur- rent study, blood volume changes in the finger, ob- tained by light transmission measurements, were measured during regular breathing (6 s periods) and long breathing (12 s periods). Respiratory chest-cir- cumference changes were simultaneously measured in order to associate the pattern of tissue blood vol- ume change with the respiratory cycle. Sixteen sub- jects were studied, and in fourteen finger blood vol- ume increased during inspiration and decreased during expiration in the long-breathing periods. In all 14 subjects the start of blood volume decrease was significantly delayed from the start of expiration by mean ± SD 1.00 ± 0.65 s (p < 0.001, range 0 - 2.3 s). The start of blood volume increase was significantly delayed from the end of expiration by 3.45 ± 1.76 s (p < 0.005). In eight, finger blood volume started to in- crease more than 2 s before the start of inspiration. For the 6 s breathing period, blood volume decreased during inspiration in five examinations, and in- creased in seven. The increase in peripheral blood volume during inspiration could be attributed to the higher abdominal pressure during inspiration, and to the decrease in sympathetic activity during inspira- tion and the subsequent vasodilatation. The decrease in peripheral blood volume during inspiration is probably due to the negative thoracic pressure dur- ing inspiration and its mechanical effect on thoracic vessels. Keywords: Light Absorption; Deep Breathing; Sympathetic Nervous system; Tissue Blood Volume 1. INTRODUCTION Respiratory-induced fluctuations in heart rate—respira- tory sinus arrhythmia—and similar fluctuations in arte- rial blood pressure have been intensively investigated, but in only a few studies the pattern of the chang e during inspiration and during expiration was investigated. Heart rate increases and systolic blood pressure decreases dur- ing inspiration [1-3] but there is strong variability in the relationship between heart rate or systolic blood pressure and the respiratory changes in chest circumference. The origin of these respiratory-induced fluctuations is not decisively known. They have been attributed to fluctua- tions in central autonomic activity caused by spontane- ous oscillations in respiratory center activity or by resp i- ratory-induced mechanical effects on the aortic baro- receptors and the pulmonary stretch receptors [2-4]. The direct mechanical effect of respiratory-induced thoracic pressure changes on arterial blood pressure and on cen- tral veins may also be significant [5-7]. Respiratory-ind uced flu ctuatio ns hav e also been fo und in the peripheral circulatory system. Deep inspiration reduces skin blood flow, measured by skin temperature [8,9] and by laser Doppler flowmetry [9-12], and this reduction has been attributed to higher sympathetic ac- tivity. Peripheral blood volume, as measured by light transmission through the tissue, has been shown to fluc- tuate at the respiratory rate [13-18], as it does with each heart beat, and so induces the photoplethysmographic (PPG) signal. Two possible mechanisms have been suggested for the origin of tissue blood fluctuations with respiration: mechanical influence of the negative thoracic pressure during inspiration on the arteries and veins in the thorax [14-17] and respiratory changes in sympathetic activity [15-18]. The effect of respiration on sympathetic activity has been demonstrated by several studies [19-21], which showed higher muscle sympathetic nerve activity 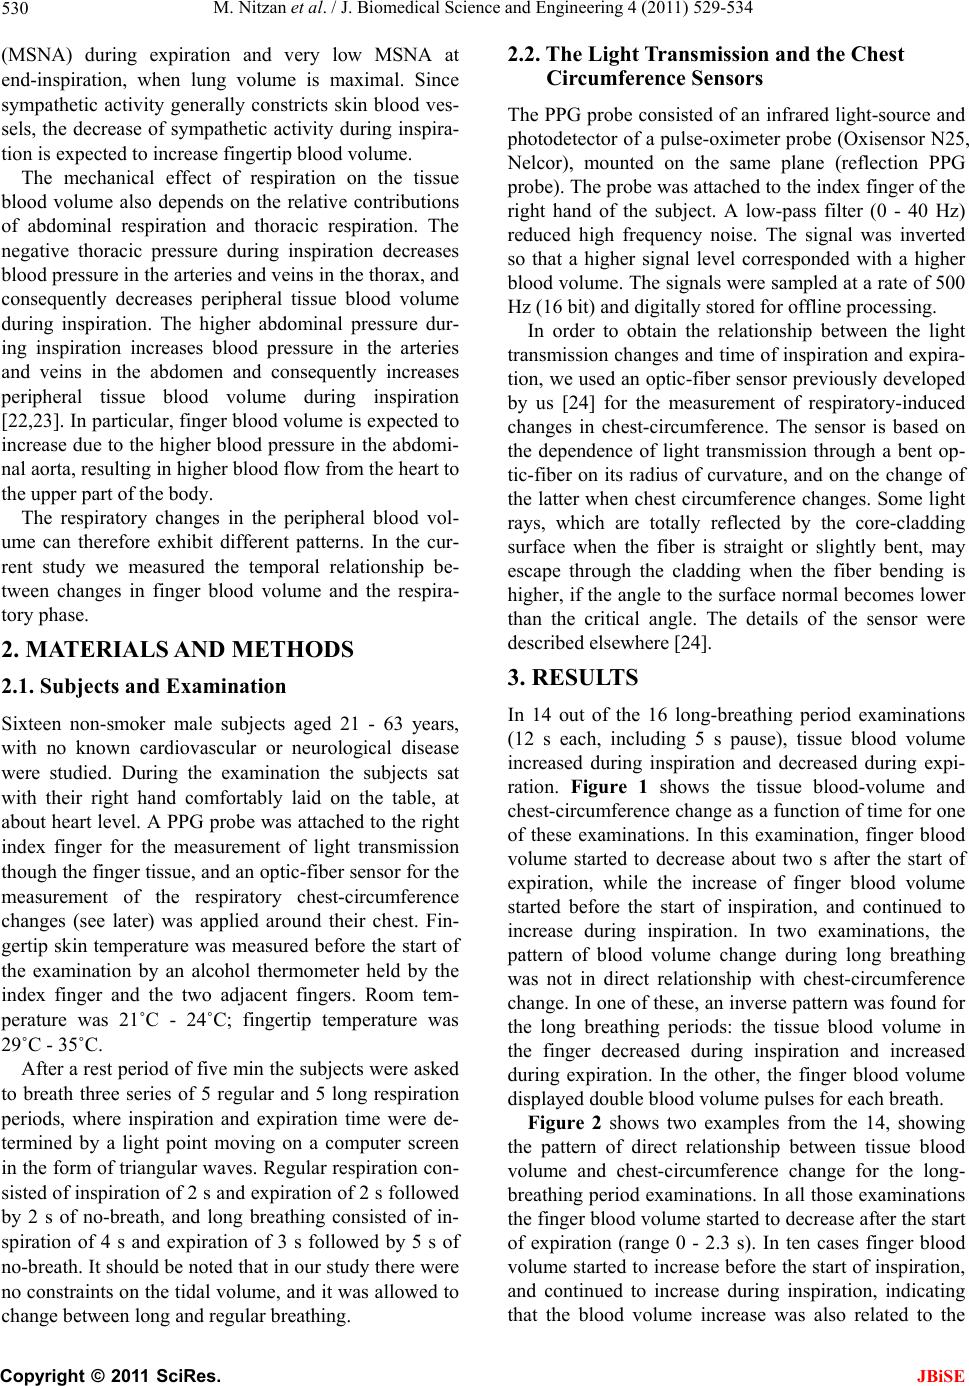 M. Nitzan et al. / J. Biomedical Science and Engineering 4 (2011) 529-534 530 (MSNA) during expiration and very low MSNA at end-inspiration, when lung volume is maximal. Since sympathetic activity generally constricts skin blood ves- sels, the decrease of sympathetic activity during inspira- tion is expected to in crease fingertip blood volume. The mechanical effect of respiration on the tissue blood volume also depends on the relative contributions of abdominal respiration and thoracic respiration. The negative thoracic pressure during inspiration decreases blood pressure in the arteries and veins in the thorax , and consequently decreases peripheral tissue blood volume during inspiration. The higher abdominal pressure dur- ing inspiration increases blood pressure in the arteries and veins in the abdomen and consequently increases peripheral tissue blood volume during inspiration [22,23]. In particular, finger blood volume is expected to increase due to the higher blood pressure in the abdomi- nal aorta, resulting in higher blood flow from the heart to the upper part of the body. The respiratory changes in the peripheral blood vol- ume can therefore exhibit different patterns. In the cur- rent study we measured the temporal relationship be- tween changes in finger blood volume and the respira- tory phase. 2. MATERIALS AND METHODS 2.1. Subjects and Examination Sixteen non-smoker male subjects aged 21 - 63 years, with no known cardiovascular or neurological disease were studied. During the examination the subjects sat with their right hand comfortably laid on the table, at about heart level. A PPG probe was attached to the right index finger for the measurement of light transmission though the finger tissue, and an op tic-fiber sensor for the measurement of the respiratory chest-circumference changes (see later) was applied around their chest. Fin- gertip skin temperature was measured before the start of the examination by an alcohol thermometer held by the index finger and the two adjacent fingers. Room tem- perature was 21˚C - 24˚C; fingertip temperature was 29˚C - 35˚C. After a rest period of five min the subjects were asked to breath three series of 5 regular and 5 long respiration periods, where inspiration and expiration time were de- termined by a light point moving on a computer screen in the form of triangular waves. Regular respiration con- sisted of inspiration of 2 s and expiration of 2 s followed by 2 s of no-breath, and long breathing consisted of in- spiration of 4 s and expiration of 3 s followed by 5 s of no-breath. It should be noted that in our study there were no constraints on the tidal volume, and it was allowed to change between long and regular breathing. 2.2. The Light Transmission and the Chest Circumference Sensors The PPG probe consisted of an infrared light-source and photodetector of a pulse-oximeter probe (Oxisensor N25, Nelcor), mounted on the same plane (reflection PPG probe). The probe was attached to the ind ex finger of the right hand of the subject. A low-pass filter (0 - 40 Hz) reduced high frequency noise. The signal was inverted so that a higher signal level corresponded with a higher blood volume. The signals were sampled at a rate of 500 Hz (16 bit) and digita l l y store d fo r of fl i ne pr ocessi n g. In order to obtain the relationship between the light transmission changes and time of inspiration and expira- tion, we used an optic-fiber sensor previously developed by us [24] for the measurement of respiratory-induced changes in chest-circumference. The sensor is based on the dependence of light transmission through a bent op- tic-fiber on its radius of curvature, and on the change of the latter when chest circumference changes. Some light rays, which are totally reflected by the core-cladding surface when the fiber is straight or slightly bent, may escape through the cladding when the fiber bending is higher, if the angle to the surface normal becomes lower than the critical angle. The details of the sensor were described elsewhere [24]. 3. RESULTS In 14 out of the 16 long-breathing period examinations (12 s each, including 5 s pause), tissue blood volume increased during inspiration and decreased during expi- ration. Figure 1 shows the tissue blood-volume and chest-circumference change as a function of time for one of these examinations. In this examination, finger blood volume started to decrease about two s after the start of expiration, while the increase of finger blood volume started before the start of inspiration, and continued to increase during inspiration. In two examinations, the pattern of blood volume change during long breathing was not in direct relationship with chest-circumference change. In one of these, an inverse pattern was found for the long breathing periods: the tissue blood volume in the finger decreased during inspiration and increased during expiration. In the other, the finger blood volume displayed double bloo d volume pulses for each breath. Figure 2 shows two examples from the 14, showing the pattern of direct relationship between tissue blood volume and chest-circumference change for the long- breathing period examinations. In all those examinations the finger blood volume started to decrease after the start of expiration (range 0 - 2.3 s). In ten cases finger blood volume started to increase before the start of inspiration, and continued to increase during inspiration, indicating that the blood volume increase was also related to the C opyright © 2011 SciRes. JBiSE  M. Nitzan et al. / J. Biomedical Science and Engineering 4 (2011) 529-534 531 end of the previo us phase of expiration. In 8, the changes started more than 2 s before inspiration, and in 2, just before. To allow the relationship between tissue blood volume and chest-circumference change to be seen more clearly, the pulses in tissue blood volume were elimi- nated by depicting only the diastolic (minimal) blood volume for each pulse, and Figure 3 shows the results for the same examinations as in Figure 2. The time of the increase and decrease of the blood volume pulse relative to respiratory phase was charac- terized by two parameters: the time-difference TDI from the end of expiration to the start of blood volume in- crease, and the time-difference TDD from the start of expiration to the start of blood volume decrease, as shown in Figure 1. The time of the start of expiration was taken as the time of the maximum of the chest-cir- cumference change curve; the time of the end of expira- tion was taken as the time of the end of the breathing instruction triangle (BG in Figure 2). Figure 1. The changes in tissue blood volume (TBV) and chest-circumference (CC) as a function of time. TDI is the time difference between the end of decrease of CC and the start of increase of TBV; TDD is the time difference between the start of decrease of CC and the start of decrease of TBV. (a) (b) Figure 2. Two examinations showing, for long breathing peri- ods, a direct relationship between tissue blood volume (TBV) increase (upper curve) and chest circumference (CC) increase (middle curve). TBV changes during regular breathing show an inverse relationship (a) and a direct relationship (b) with chest circumference increase. Upward direction indicates increase in TBV and chest circumference. The lower curve in each ex- amination (denoted by BG—breathing graph) shows the trian- gular waves displayed on the computer screen for breathing instruction. (a) (b) Figure 3. The two examinations of Figure 2, showing the changes in the minimal (diastolic) blood volume (upper curve) and chest circumference increas e (lower curve) . C opyright © 2011 SciRes. JBiSE  M. Nitzan et al. / J. Biomedical Science and Engineering 4 (2011) 529-534 532 Figure 4. The time of the start of tissue blood volume increase, TDI, relative to the end of expiration (empty circles) and the time of the start of tissue blood volume decrease, TDD, relative to the start of expiration (full circles) for the long breathing periods. Each pair of circles presents the values of TDI and TDD for one of the 14 subjects, displaying a direct relationship between tissue blood volume change and chest circumference change. Figure 4 presents the detailed results for the mean values of TDI and TDD for each of the 14 subject ex- aminations. These mean values were obtained by aver- aging, for each subject, the values for all the long- breathing pulses, not including the first in each group. The increase in blood volume was significantly delayed from the end of expiration by TDI 3.45 ± 1.76 s (mean ± SD, p < 0.005) and the decrease in blood volume was significantly delayed from the start of expiration by TDD 1.00 ± 0.65 s (p < 0.001). Figures 2 and 3 also present results of blood volume measurements with regular breathing of the 6 s period. A pattern of direct relationship between tissue blood vol- ume change and chest-circumference change (i.e. in- crease of tissue blood volume during inspiration and decrease during expiration) was found in some subjects as shown in Figure 2(b) for one examination, while for other subjects it was an inverse relationship (as in Fig- ure 2(a)). For the 14 examinations, seven showed a di- rect relationship, five an inverse relationship and in two the relationship was not clearly defined. No quantitative results could be derived from the examinations of regu- lar breathing due to the low signal-to-noise ratio in the blood volume measurement. 4. DISCUSSION In the current study we measured the blood volume changes in the finger, as obtained by light transmission measurements, during regular breathing (6 s periods) and during long breathing (12 s periods). The examinations were performed simultaneously with measurement of chest-circumference change, in order to see whether in- spiration was associated with an increase or decrease in tissue blood volume. The main finding of the study was that in all except two long-breathing examinations of finger blood volume changes, tissue blood volume in- creased during inspiration and decreased during expira- tion (direct relationship). In only one examination did tissue blood volume decrease during inspiration and in- crease during expiration (inverse relationship). This in- verse relationship was also found in some regular- breathing examinations, even though the long-breathing examinations in these subjects were associated with a direct relationship pattern. An important finding was the relative timing of blood volume change. The start of the decrease in finger blood volume followed the start of expiration, suggesting that the former was induced by the latter. On the other hand the start of the increase in finger blood volume preceded the start of inspiration in the majority of the examina- tions. Though the increase in finger blood volume re- lated to inspiration, it is likely to have been initiated by the end of previous expirat i o n . As presented in the Background Section, two possible mechanisms have been suggested as the origin of the tissue blood volume fluctuations with respiration: me- chanical influence of the thoracic pressure on the tho- racic blood vessels [14-17] and sympathetic activity os- cillations [15-18]. The sympathetic activity has been shown to decrease during inspiration [19-21], which can explain the increase in fingertip blood volume during inspiration, found in almost all of our long-breathing results. Though those studies on sympathetic activity (measured by MSNA) were performed with spontaneous breathing, with a respiration frequency which was even higher than our regu lar breathing, it seems reasonable to suggest that sympathetic activity is similarly modulated by the respiratory pattern of our long-breathing exami- nations. In former publications the mechanical effect of breathing on the peripheral blood volume was attributed to the negative internal thoracic pressure during inspira- tion which decreases blood pressure in the thoracic ar- teries and increases blood volume in the thoracic veins. These two effects are expected to decrease peripheral tissue blood volume during inspiration. However, inspi- ration is generally also accompanied with increased ab- dominal pressure, which increases the blood pressure in the abdominal arteries and veins and diverts blood to the peripheral tissue [22,23]. This effect increases the blood volume in the peripheral blood vessels during inspiration and can explain the increase in tissue blood volume dur- C opyright © 2011 SciRes. JBiSE  M. Nitzan et al. / J. Biomedical Science and Engineering 4 (2011) 529-534 533 ing inspiration and its decrease during expiration (direct relationship) in long breathing. In addition to the effect of sympathetic activity decrease during inspiration, the respiratory change in tissue blood volume is probably affected by the two opposing effects of thoracic and ab- dominal breathing on the peripheral tissue blood volume. 5. CONCLUSIONS While in most long-breathing examinations finger blood volume increased when chest-circumference increased, an inverse relationship between the two parameters was found in one long-breathing examination and also in several examinations of regular breathing. It is likely that different mechanisms are involved in the effect of respiration on peripheral blood volume, probably in- cluding lower thoracic pressure, higher abdominal pres- sure and lower sympathetic activity during inspiration. 6. ACKNOWLEDGEMENTS The study was supported by E.W. Joseph Fun d. REFERENCES [1] Gilad, O., Swenne, C.A., Davrath, L.R. and Akselrod, S. (2005) Phase-averaged characterization of respiratory si- nus arrhythmia pattern. American Journal of Physiology— Heart and Circulatory Physiology, 288, H504-H510. doi:10.1152/ajpheart.00366.2004 [2] Kotani, K., Takamasu, K., Jimbo, Y. and Yamamoto, Y. (2008) Postural induced phase shift of respiratory sinus arrhythmia and blood pressure variations: Insight from respiratory-phase domain analysis. American Journal of Physiology—Heart and Circulatory Physiology, 294, H1481-H1489. doi:10.1152/ajpheart.00680.2007 [3] Sin, P.Y.W., Galletly, D.C. and Tzeng, Y.C. (2010) Influ- ence of breathing frequency on the pattern of respiratory sinus arrhythmia and blood pressure; old questions revis- ited. American Journal of Physiology—Heart and Circu- latory Physiology, 298, H1588-H1599. [4] Cohen, M.A. and Tailor, J.A. (2002) Short-term cardio- vascular oscillations in man: Measuring and modeling the physiologies. The Journal of Physiology, 542, 669-683. doi:10.1113/jphysiol.2002.017483 [5] Izzo, J.L. (1990) Labile hypertension, vasomotor instabil- ity and postural syndromes. In: Laragh, J.H. and Brenner, B.M., Eds., Hypertension: Pathophysiology, Diagnosis and Management. Raven Press, New York, 1415-1427. [6] Muzi, M. and Ebert T.J. (1993) Quantification of heart rate variability with power spectral analysis. Current Opinion in Anesthesiology, 6, 3-17. [7] Triedman, J.K. and Saul, J.P. (1994) Blood pressure modulation by central venous pressure and respiration. Buffering effects of the heart rate reflexes. Circulation, 89, 169-179. [8] Mulinos M.G. and Shulman, I. (1938) Vasoconstriction in the hand from a deep inspiration. American Journal of Physiology—Heart and Circulatory Physiology, 125, 310-322. [9] Allen, J., Frame, J.R. and Murray, A. (2002) Microvas- cular blood flow and skin temperature changes in the fingers following a deep inspiratory gasp. Physiological Measurement, 23, 365-373. doi:10.1088/0967-3334/23/2/312 [10] Wallin, B.G., Batelsson, K., Kienbaum, P., et al. (1998) Two neural mechanisms for respiration induced cutane- ous vasodilatation in humans? The Journal of Physiology, 513, 559-569. d oi:10.1111/j.146 9-7793.1998.559bb.x [11] Rauh, R., Posfay, A. and Muck-Weynmann, M. (2003) Quantification of inspiratory-induced vasoconstrictive episodes: A comparison of laser Doppler fluxmetry and photoplethysmography. Clinical Physiology and Func- tional Imaging, 23, 344-348. doi:10.1046/j.1475-0961.2003.00516.x [12] Mayrovitz, H.N. and Groseclose, E.E. (2005) Inspira- tion-induced vasoconstrictive responses in dominant versus non-dominant hand. Clinical Physiology and Functional Imaging, 25, 69-77. doi:10.1111/j.1475-097X.2004.00592.x [13] Nitzan, M., De Boer, H., Turivnenko, S., et al. (1994) Power spectrum analysis of the spontaneous fluctuations in the photoplethysmographic signal. Journal of Basic and Clinical Physiology and Pharmacology, 5, 269-276. doi:10.1515/JBCPP.1994.5.3-4.269 [14] Bernardi, L., Radaelli, A., Solda, P.L., et al. (1996) Auto- nomic control of skin microvessels: Assessment by power spectrum of photoplethysmographic waves. Clinical Sci- ence, 90, 345-355. [15] Johansson, A. and Oberg, P.A. (1999) Estimation of res- piratory volumes from the photoplethysmographic signal. Part 2: A model study. Medical and Biological Engineer- ing and Computing, 37, 48-53. doi:10.1007/BF02513265 [16] Nilsson, L., Johansson, A. and Kalman, S. (2003) Mac- rocirculation is not the sole determinant of respiratory induced variations in the reflection mode photoplethys- mographic signal. Physiological Measurement, 24, 925- 937. doi:10.1088/0967-3334/24/4/009 [17] Nilsson, L., Johansson, A. and Kalman, S. (2003) Respi- ratory variations in the reflection mode photoplethys- mographic signal. Relationships to peripheral venous pressure. Medical and Biological Engineering and Computing, 41, 249-254. doi:10.1007/BF02348428 [18] Nitzan, M., Faib, I. and Friedman, H. (2006) Respira- tion-induced changes in tissue blood volume distal to oc- cluded artery, measured by photoplethysmography. Jour- nal of Biomedical Optics, 11, 040506-1-040506-3. doi:10.1117/1.2236285 [19] Seals, D.R., Suwarno, N.O., Joyner, M.J., et al. (1993) Respiratory modulation of muscle sympathetic nerve ac- tivity in intact and lung denervated humans. Circulation Research, 72, 440-454. [20] St. Croix, C.M., Satoh, M., Morgan, B.J., et al. (1999) Role of respiratory motor output in within-breath modu- lation of muscle sympathetic nerve activity in humans. Circulation Research, 85, 457-469. [21] Dempsey, J.A., Sheel, A.W., St. Croix, C.M. and Morgan, B.J. (2002) Respiratory influences on sympathetic vaso- motor outflow in humans. Respiratory Physiology & Neu- robiology, 130, 3-20. doi:10.1016/S0034-5687(01)00327-9 [22] Aliverti, A., Bovio, D., Fullin, I., et al. (2009) The ab- C opyright © 2011 SciRes. JBiSE  M. Nitzan et al. / J. Biomedical Science and Engineering 4 (2011) 529-534 Copyright © 2011 SciRes. 534 JBiSE dominal circulatory pump. PLoS ONE, 4, e5550. doi:10.1371/journal.pone.0005550 [23] Aliverti, A., Uva, B., Laviola, M., et al. (2010) Concomi- tant ventilator and circulatory functions of the diaphragm and abdominal muscles. Journal of Applied Physiology, 109, 1432-1440. doi:10.1152/japplphysiol.00576.2010 [24] Babchenko, A., Khanokh, B., Shomer, Y. and Nitzan, M. (1999) A fiber-optic sensor for the measurement of the respiratory chest circumference changes. Journal of Biomedical Optics, 4, 224-229. |