

Paper Menu >>
Journal Menu >>
 Journal of Signal and Information Processing, 2011, 2, 232-237 doi:10.4236/jsip.2011.23032 Published Online August 2011 (http://www.SciRP.org/journal/jsip) Copyright © 2011 SciRes. JSIP A Time-Frequency Approach for Discrimination of Heart Murmurs Sepideh Jabbari, Hassan Ghassemian School of Electrical and Computer Engineering, Tarbiat Modares University, Tehran, Iran. Email: [email protected] Received May 29th, 2011; revised July 18th, 2011; accepted July 26th, 2011. ABSTRACT In this paper, a novel fram ework based on a time-frequ ency (TF) approach is proposed for detection of murmurs from heart sound signal. First, a high-resolution TF algorithm, matching pursuit, was used to decompose each heart beat into a series of TF atoms selected from a redundant dictionary. Next, representative components of murmurs were iden- tified by clustering the selected a toms of all th e beats into a finite numb er of clusters. Then, Wign er-Ville distrib ution of the representative components was used to generate a set of 8 features which were fed to a classifier. Experiments with a dataset consisting of heart sounds from 35 normal and 35 pathological subjects showed a classification accuracy of 95.71% in dist i ng ui shing murmur s fr o m n or mal heart sounds. Keywords: Phonocardiogram (PCG), Murmur, Matching Pursuit (MP), Time-Frequency Atom, Clustering 1. Introduction Mechanical activity of the heart is evaluated by ausculta- tion and analysis of phonocardiogram (PCG) signal, which is a recording of heart sounds. PCG provides val- uable information on the structural integrity and function of heart valves. Heart sounds normally consist of two regularly repeated thuds, known as S1 and S2 for every heat beat. An underlying pathology such as diseased valves produces some additional and abnormal sounds which are called murmurs. The automatic detection of murmurs has been widely considered for several decades because of the human auditory limitations in distin- guishing them from normal heart sounds [1]. PCG is highly nonstationary signal with multicompo- nent nature and identification of its components can be performed by a nonstationary signal analysis tool such as time-frequency (TF) analysis methods [2]. Short-time Fourier transform (STFT) is one of the existing tech- niques that tackles the nonstationarity of the PCG signal by segmenting it into stationary parts [3,4]. Wavelet transform (WT) was used to obtain TF decomposition of PCG signals in previous studies [5,6]. It does not require the fixed data window needed for STFT; however, even wavelet bases are not well suited to exact TF representa- tion of PCG components whose localizations in time and frequency vary widely. Some researchers performed analysis of PCG by using Wigner-Ville distribution (WV- D) [7]. A major drawback of the WVD is presence of cross-term artifacts caused by aliasing when analyzing multicomponent signals such as PCG. A true nonstation- ary TF technique would be one that can give an accurate parametric display of PCG characteristics with satisfac- tory TF resolution, cross-term suppression, and without segmentation requirements. The parameters of decom- posed components could be later used to extract crucial features for identification of murmurs. In this paper, we achieve this goal using a cross-term free high-resolution method, matching pursuit (MP) algorithm. MP is a signal decomposition method whereby a signal is decomposed into a linear combination of TF components (atoms) that are selected from a redundant dictionary [8]. Figure 1 represents the architecture of our proposed framework for heart murmur detection. PCG signal from an electronic stethoscope is processed along with a si- multaneously recorded electrocardiogram (ECG) stream as a reference signal. First, preprocessing stage is carried out consisting of filtering, down sampling, and beat seg- mentation. Next, all the beats are decomposed into a se- ries of TF atoms using the MP algorithm and a redundant Gabor-type dictionary. Each selected atom is described by a set of parameters including the amplitude, position in time, scale, frequency, and phase. Groups of atoms with similar morphology of parameters are then isolated into clusters. For each cluster, atoms are merged together 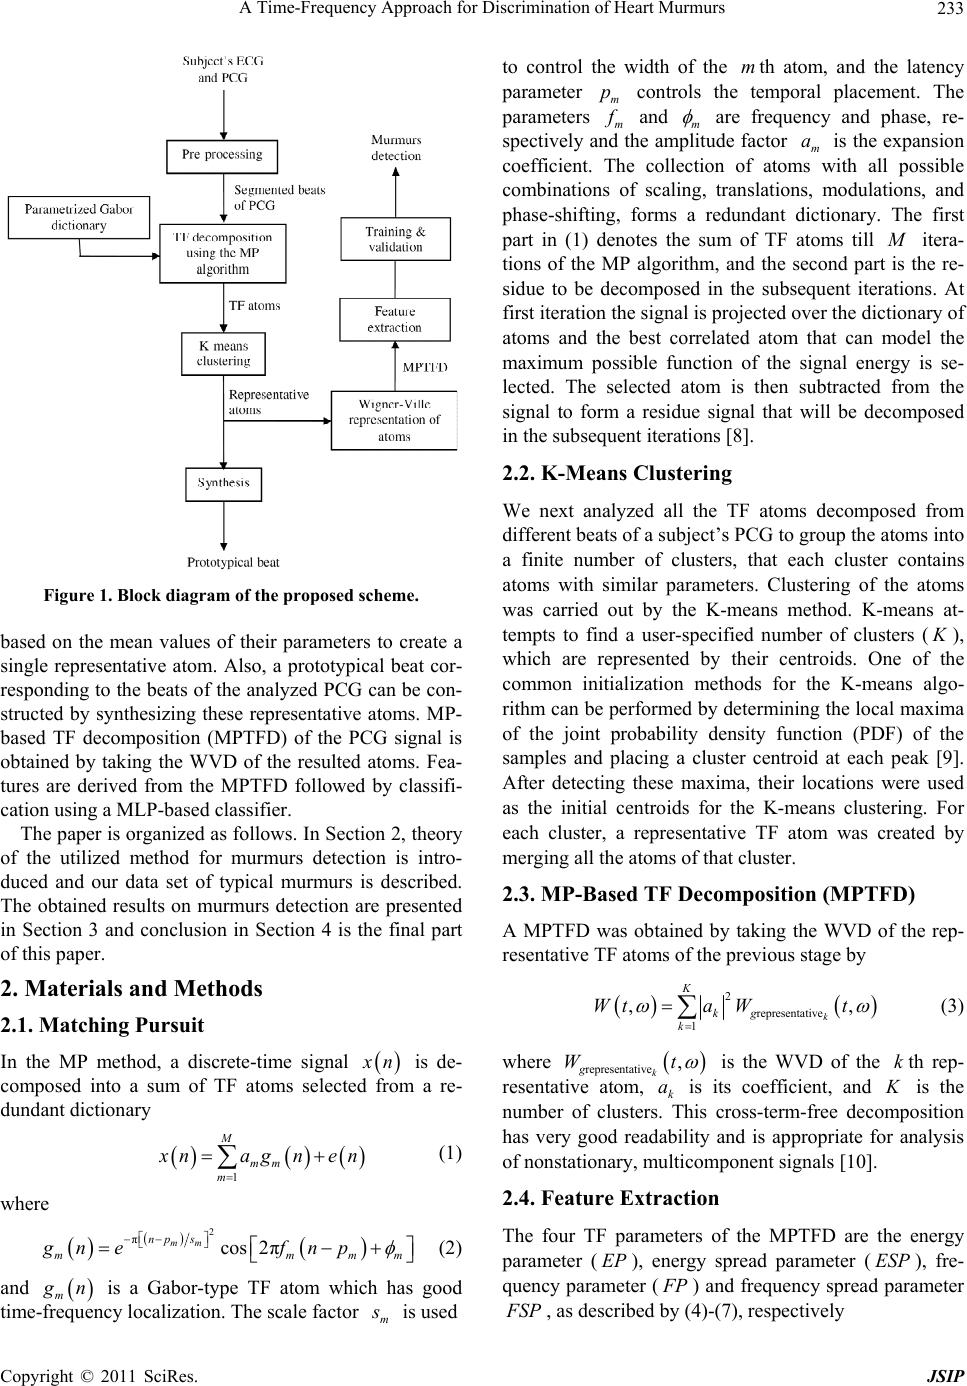 A Time-Frequency Approach for Discrimination of Heart Murmurs233 Figure 1. Block diagram of the propose d schem e . based on the mean values of their parameters to create a single representative atom. Also, a prototypical beat cor- responding to the beats of the analyzed PCG can be con- structed by synthesizing these representative atoms. MP- based TF decomposition (MPTFD) of the PCG signal is obtained by taking the WVD of the resulted atoms. Fea- tures are derived from the MPTFD followed by classifi- cation using a MLP-based classifier. The paper is organized as follows. In Section 2, theory of the utilized method for murmurs detection is intro- duced and our data set of typical murmurs is described. The obtained results on murmurs detection are presented in Section 3 and conclusion in Section 4 is the final part of this paper. 2. Materials and Methods 2.1. Matching Pursuit In the MP method, a discrete-time signal x n is de- composed into a sum of TF atoms selected from a re- dundant dictionary 1 M mm m x nagne n (1) where 2 πcos 2π mm np s mm gn efnp mm (2) and m g n is a Gabor-type TF atom which has good time-frequency localization. The scale factor m s is used to control the width of the th atom, and the latency parameter controls the temporal placement. The parameters m m m p f and m are frequency and phase, re- spectively and the amplitude factor m is the expansion coefficient. The collection of atoms with all possible combinations of scaling, translations, modulations, and phase-shifting, forms a redundant dictionary. The first part in (1) denotes the sum of TF atoms till a M itera- tions of the MP algorithm, and the second part is the re- sidue to be decomposed in the subsequent iterations. At first iteration the signal is projected over the dictionary of atoms and the best correlated atom that can model the maximum possible function of the signal energy is se- lected. The selected atom is then subtracted from the signal to form a residue signal that will be decomposed in the subsequent iterations [8]. 2.2. K-Means Clustering We next analyzed all the TF atoms decomposed from different beats of a subject’s PCG to group the atoms into a finite number of clusters, that each cluster contains atoms with similar parameters. Clustering of the atoms was carried out by the K-means method. K-means at- tempts to find a user-specified number of clusters ( K ), which are represented by their centroids. One of the common initialization methods for the K-means algo- rithm can be performed by determining the local maxima of the joint probability density function (PDF) of the samples and placing a cluster centroid at each peak [9]. After detecting these maxima, their locations were used as the initial centroids for the K-means clustering. For each cluster, a representative TF atom was created by merging all the atoms of that cluster. 2.3. MP-Based TF Decomposition (MPTFD) A MPTFD was obtained by taking the WVD of the rep- resentative TF atoms of the previous stage by 2 representative 1 ,, k K kg k Wta Wt (3) where representative ,W k gt is the WVD of the th rep- resentative atom, k is its coefficient, and is the number of clusters. This cross-term-free decomposition has very good readability and is appropriate for analysis of nonstationary, multicomponent signals [10]. k Ka 2.4. Feature Extraction The four TF parameters of the MPTFD are the energy parameter (), energy spread parameter (), fre- quency parameter ( EP ESP F P) and frequency spread parameter F SP , as described by (4)-(7), respectively Copyright © 2011 SciRes. JSIP 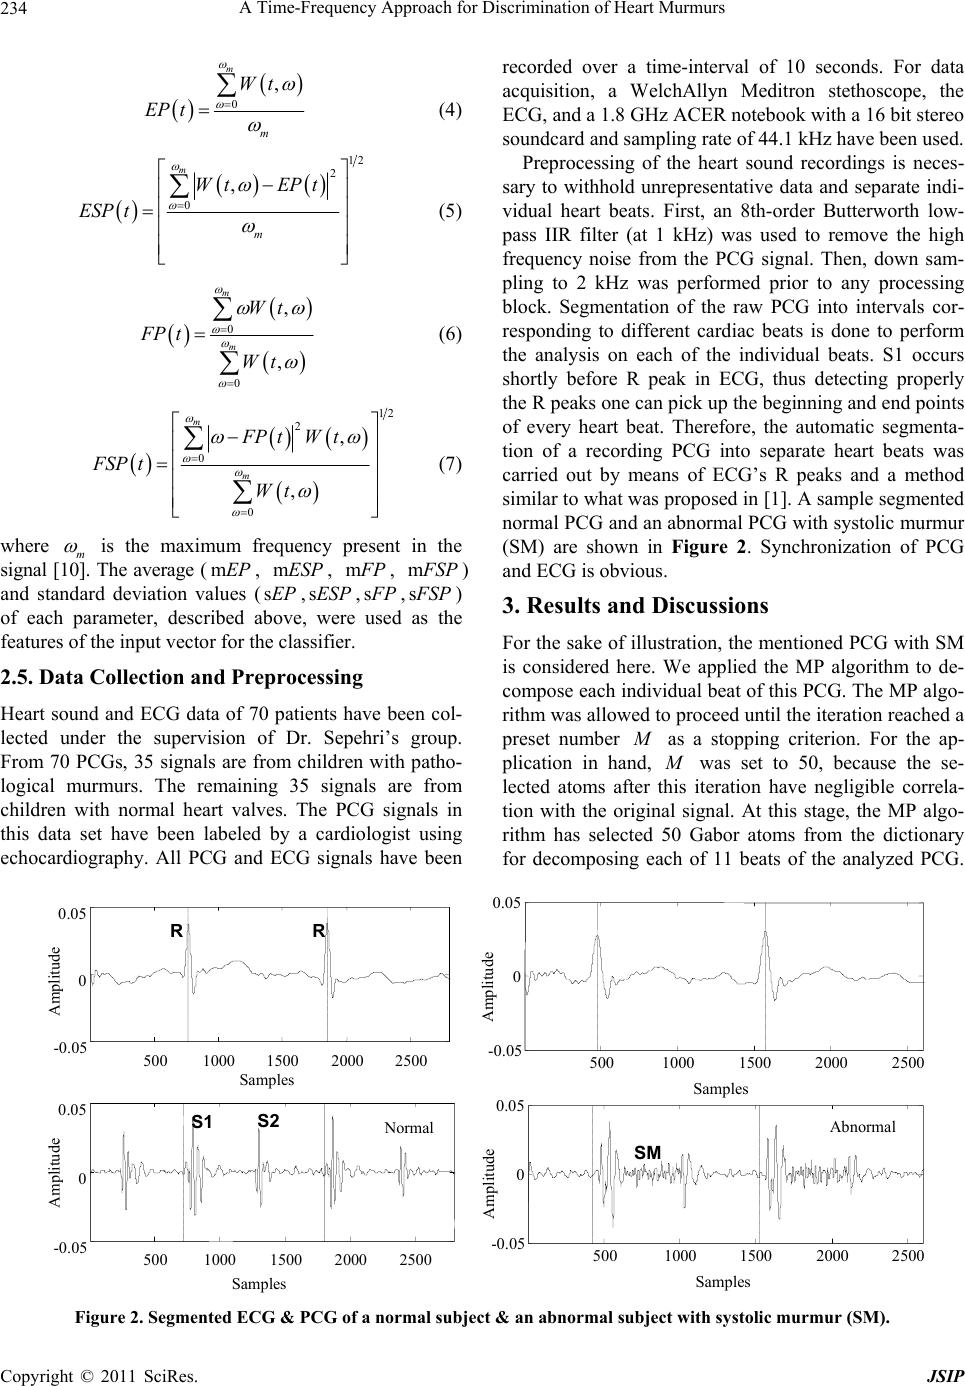 A Time-Frequency Approach for Discrimination of Heart Murmurs Copyright © 2011 SciRes. JSIP 234 0 , m m Wt EP t (4) 12 2 0 , m m Wt EPt ESP t (5) 0 0 , , m m Wt FP t Wt (6) 12 2 0 0 , , m m FP tWt FSP t Wt (7) where m is the maximum frequency present in the signal [10]. The average (, , mEP mESP m F P, m F SP ) and standard deviation values (s,s,EPESP s F P,s F SP ) of each parameter, described above, were used as the features of the input vector for the classifier. 2.5. Data Collection and Preprocessing Heart sound and ECG data of 70 patients have been col- lected under the supervision of Dr. Sepehri’s group. From 70 PCGs, 35 signals are from children with patho- logical murmurs. The remaining 35 signals are from children with normal heart valves. The PCG signals in this da set have been labeled by a cardiologist using echocdiography. All PCG and ECG signals have been recorded over a time-interval of 10 seconds. For data acquisition, a WelchAllyn Meditron stethoscope, the ECG, and a 1.8 GHz ACER notebook with a 16 bit stereo soundcard and sampling rate of 44.1 kHz have been used. Preprocessing of the heart sound recordings is neces- sary to withhold unrepresentative data and separate indi- vidual heart beats. First, an 8th-order Butterworth low- pass IIR filter (at 1 kHz) was used to remove the high frequency noise from the PCG signal. Then, down sam- pling to 2 kHz was performed prior to any processing block. Segmentation of the raw PCG into intervals cor- responding to different cardiac beats is done to perform the analysis on each of the individual beats. S1 occurs shortly before R peak in ECG, thus detecting properly the R peaks one can pick up the beginning and end points of every heart beat. Therefore, the automatic segmenta- tion of a recording PCG into separate heart beats was carried out by means of ECG’s R peaks and a method similar to what was proposed in [1]. A sample segmented normal PCG and an abnormal PCG with systolic murmur (SM) are shown in Figure 2. Synchronization of PCG and ECG is obvious. 3. Results and Discussions For the sake of illustration, the mentioned PCG with SM is considered here. We applied the MP algorithm to de- compose each individual beat of this PCG. The MP algo- rithm was allowed to proceed until the iteration reached a preset number M as a stopping criterion. For the ap- plication in hand, M was set to 50, because the se- lected atoms after this iteration have negligible correla- tion with the original signal. At this stage, the MP algo- rithm has selected 50 Gabor atoms from the dictionary for decomposing each of 11 beats of the analyzed PCG. at ar 500 100015002000 2500 -0.05 0 0.05 Samples 500 1000 1500 2000 2500 -0.05 0 0.05 Samples S1 S2 R R Normal Amplitude Amplitude 5001000 1500 20002500 -0.05 0 0.05 Samples 500 100015002000 2500 -0.05 0 0.05 Samples SM Abnormal Amplitude Amplitude Figure 2. Segmented ECG & PCG of a normal subject & an abnormal subject with systolic murmur (SM). 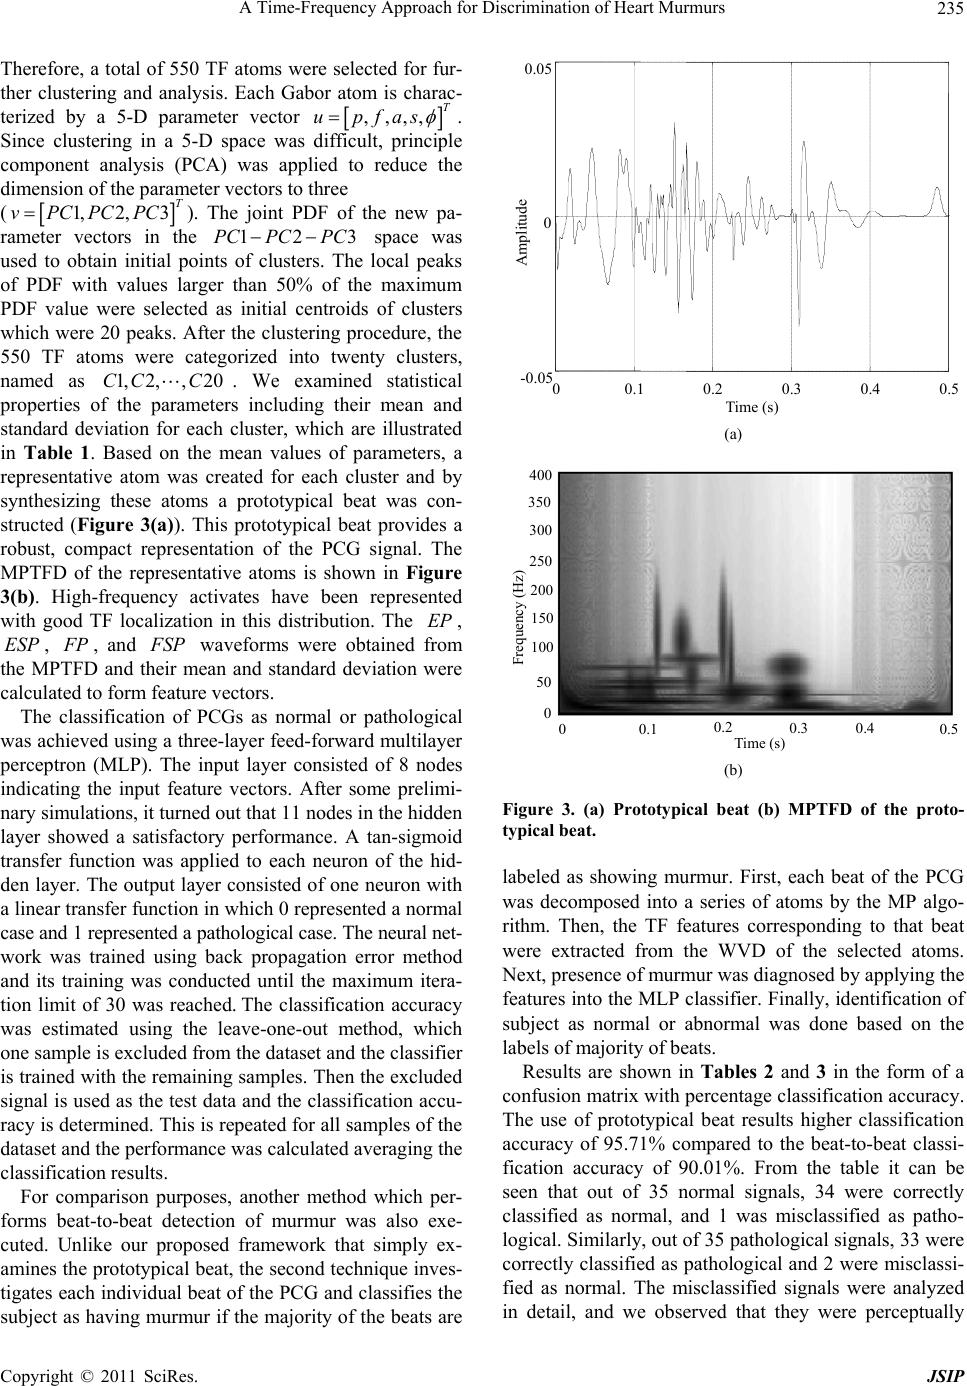 A Time-Frequency Approach for Discrimination of Heart Murmurs235 Therefore, a total of 550 TF atoms were selected for fur- ther clustering and analysis. Each Gabor atom is charac- terized by a 5-D parameter vector ,,,, T upfas 3PC . Since clustering in a 5-D space was difficult, principle component analysis (PCA) was applied to reduce the dimension of the parameter vectors to three (). The joint PDF of the new pa- rameter vectors in the 1,2,3 T vPCPCPC 12PC PC EP space was used to obtain initial points of clusters. The local peaks of PDF with values larger than 50% of the maximum PDF value were selected as initial centroids of clusters which were 20 peaks. After the clustering procedure, the 550 TF atoms were categorized into twenty clusters, named as CC . We examined statistical properties of the parameters including their mean and standard deviation for each cluster, which are illustrated in Table 1. Based on the mean values of parameters, a representative atom was created for each cluster and by synthesizing these atoms a prototypical beat was con- structed (Figure 3(a)). This prototypical beat provides a robust, compact representation of the PCG signal. The MPTFD of the representative atoms is shown in Figure 3(b). High-frequency activates have been represented with good TF localization in this distribution. The , , 1, 2,, ESP 20C F P, and F SP waveforms were obtained from the MPTFD and their mean and standard deviation were calculated to form feature vectors. The classification of PCGs as normal or pathological was achieved using a three-layer feed-forward multilayer perceptron (MLP). The input layer consisted of 8 nodes indicating the input feature vectors. After some prelimi- nary simulations, it turned out that 11 nodes in the hidden layer showed a satisfactory performance. A tan-sigmoid transfer function was applied to each neuron of the hid- den layer. The output layer consisted of one neuron with a linear transfer function in which 0 represented a normal case and 1 represented a pathological case. The neural net- work was trained using back propagation error method and its training was conducted until the maximum itera- tion limit of 30 was reached. The classification accuracy was estimated using the leave-one-out method, which one sample is excluded from the dataset and the classifier is trained with the remaining samples. Then the excluded signal is used as the test data and the classification accu- racy is determined. This is repeated for all samples of the dataset and the performance was calculated averaging the classification results. For comparison purposes, another method which per- forms beat-to-beat detection of murmur was also exe- cuted. Unlike our proposed framework that simply ex- amines the prototypical beat, the second technique inves- tigates each individual beat of the PCG and classifies the subject as having murmur if the majority of the beats are 00.1 0.2 0.3 0.4 0.5 -0.05 0 0.05 Time (s) Amplitude (a) Time (s) 0.1 0.2 0.3 0.40.5 0 50 100 150 200 250 300 350 400 0 Frequency (Hz) (b) Figure 3. (a) Prototypical beat (b) MPTFD of the proto- typical beat. labeled as showing murmur. First, each beat of the PCG was decomposed into a series of atoms by the MP algo- rithm. Then, the TF features corresponding to that beat were extracted from the WVD of the selected atoms. Next, presence of murmur was diagnosed by applying the features into the MLP classifier. Finally, identification of subject as normal or abnormal was done based on the labels of majority of beats. Results are shown in Tables 2 and 3 in the form of a confusion matrix with percentage classification accuracy. The use of prototypical beat results higher classification accuracy of 95.71% compared to the beat-to-beat classi- fication accuracy of 90.01%. From the table it can be seen that out of 35 normal signals, 34 were correctly classified as normal, and 1 was misclassified as patho- logical. Similarly, out of 35 pathological signals, 33 were correctly classified as pathological and 2 were misclassi- fied as normal. The misclassified signals were analyzed in detail, and we observed tat they were perceptually h Copyright © 2011 SciRes. JSIP 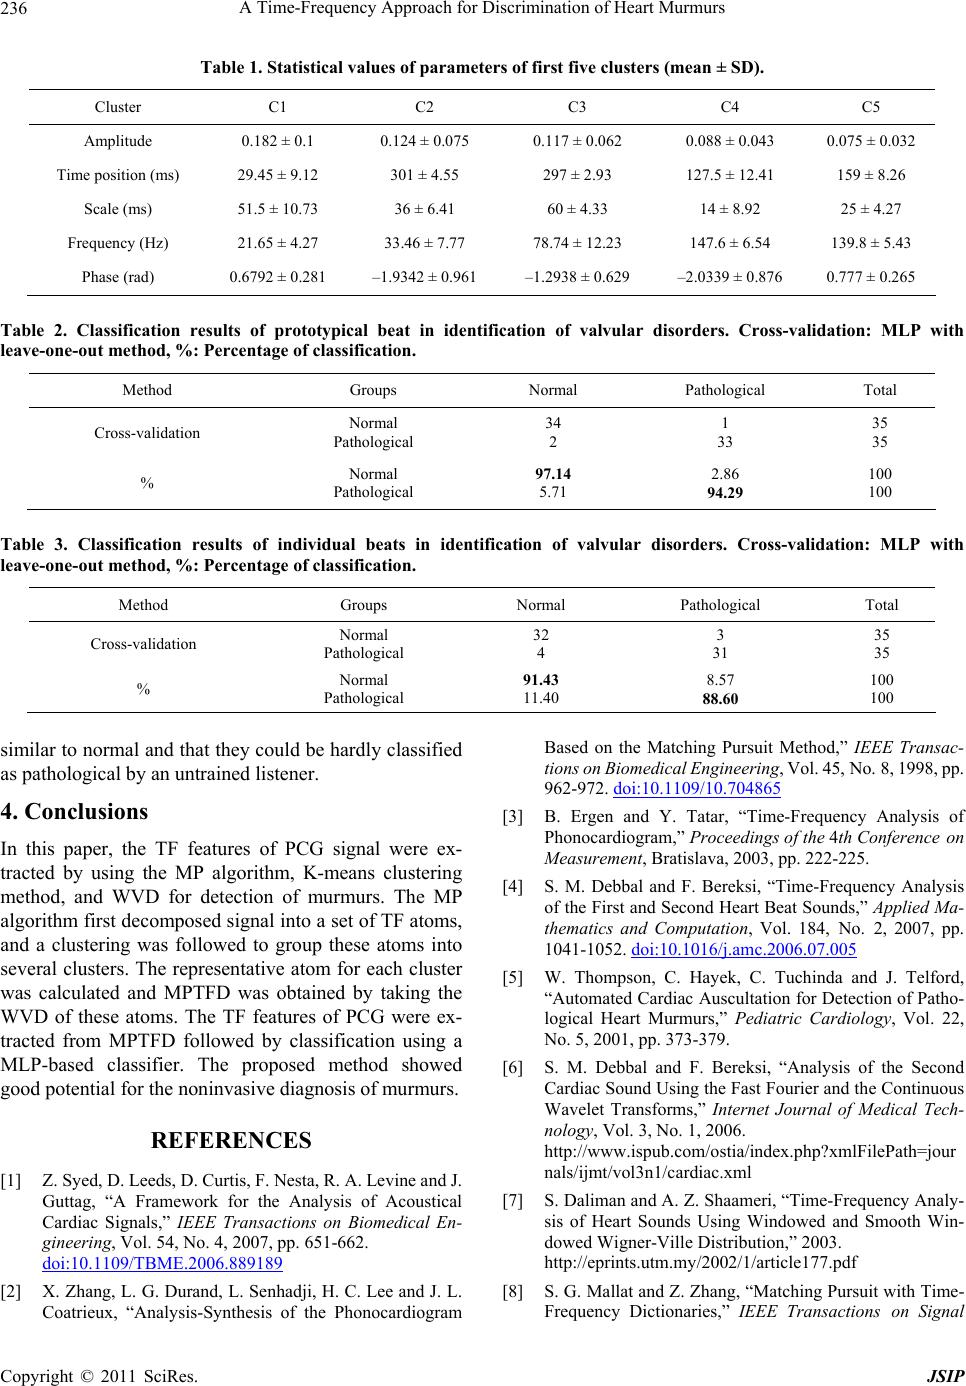 A Time-Frequency Approach for Discrimination of Heart Murmurs 236 Table 1. Statistical values of parameters of first five clusters (mean ± SD). Cluster C1 C2 C3 C4 C5 Amplitude 0.182 ± 0.1 0.124 ± 0.075 0.117 ± 0.062 0.088 ± 0.043 0.075 ± 0.032 Time position (ms) 29.45 ± 9.12 301 ± 4.55 297 ± 2.93 127.5 ± 12.41 159 ± 8.26 Scale (ms) 51.5 ± 10.73 36 ± 6.41 60 ± 4.33 14 ± 8.92 25 ± 4.27 Frequency (Hz) 21.65 ± 4.27 33.46 ± 7.77 78.74 ± 12.23 147.6 ± 6.54 139.8 ± 5.43 Phase (rad) 0.6792 ± 0.281 –1.9342 ± 0.961 –1.2938 ± 0.629 –2.0339 ± 0.876 0.777 ± 0.265 Table 2. Classification results of prototypical beat in identification of valvular disorders. Cross-validation: MLP with leave-one-out method, %: Percentage of classification. Method Groups Normal Pathological Total Cross-validation Normal Pathological 34 2 1 33 35 35 % Normal Pathological 97.14 5.71 2.86 94.29 100 100 Table 3. Classification results of individual beats in identification of valvular disorders. Cross-validation: MLP with leave-one-out method, %: Percentage of classification. Method Groups Normal Pathological Total Cross-validation Normal Pathological 32 4 3 31 35 35 % Normal Pathological 91.43 11.40 8.57 88.60 100 100 similar to normal and that they could be hardly classified as pathological by an untrained listener. 4. Conclusions In this paper, the TF features of PCG signal were ex- tracted by using the MP algorithm, K-means clustering method, and WVD for detection of murmurs. The MP algorithm first decomposed signal into a set of TF atoms, and a clustering was followed to group these atoms into several clusters. The representative atom for each cluster was calculated and MPTFD was obtained by taking the WVD of these atoms. The TF features of PCG were ex- tracted from MPTFD followed by classification using a MLP-based classifier. The proposed method showed good potential for the noninvasive diagnosis of murmurs. REFERENCES [1] Z. Syed, D. Leeds, D. Curtis, F. Nesta, R. A. Levine and J. Guttag, “A Framework for the Analysis of Acoustical Cardiac Signals,” IEEE Transactions on Biomedical En- gineering, Vol. 54, No. 4, 2007, pp. 651-662. doi:10.1109/TBME.2006.889189 [2] X. Zhang, L. G. Durand, L. Senhadji, H. C. Lee and J. L. Coatrieux, “Analysis-Synthesis of the Phonocardiogram Based on the Matching Pursuit Method,” IEEE Transac- tions on Biomedical Engineering, Vol. 45, No. 8, 1998, pp. 962-972. doi:10.1109/10.704865 [3] B. Ergen and Y. Tatar, “Time-Frequency Analysis of Phonocardiogram,” Proceedings of the 4th Conference on Measurement, Bratislava, 2003, pp. 222-225. [4] S. M. Debbal and F. Bereksi, “Time-Frequency Analysis of the First and Second Heart Beat Sounds,” Applied Ma- thematics and Computation, Vol. 184, No. 2, 2007, pp. 1041-1052. doi:10.1016/j.amc.2006.07.005 [5] W. Thompson, C. Hayek, C. Tuchinda and J. Telford, “Automated Cardiac Auscultation for Detection of Patho- logical Heart Murmurs,” Pediatric Cardiology, Vol. 22, No. 5, 2001, pp. 373-379. [6] S. M. Debbal and F. Bereksi, “Analysis of the Second Cardiac Sound Using the Fast Fourier and the Continuous Wavelet Transforms,” Internet Journal of Medical Tech- nology, Vol. 3, No. 1, 2006. http://www.ispub.com/ostia/index.php?xmlFilePath=jour nals/ijmt/vol3n1/cardiac.xml [7] S. Daliman and A. Z. Shaameri, “Time-Frequency Analy- sis of Heart Sounds Using Windowed and Smooth Win- dowed Wigner-Ville Distribution,” 2003. http://eprints.utm.my/2002/1/article177.pdf [8] S. G. Mallat and Z. Zhang, “Matching Pursuit with Time- Frequency Dictionaries,” IEEE Transactions on Signal Copyright © 2011 SciRes. JSIP  A Time-Frequency Approach for Discrimination of Heart Murmurs237 Processing, Vol. 41, No. 12, 1993, pp. 3397-3415. doi:10.1109/78.258082 [9] P. S. Bradley and U. M. Fayyad, “Refining Initial Points for K-Means Clustering,” Proceedings of the 15th Con- ference on Machine Learning, Wisconsin, 24-27 July 1998, pp. 91-99. [10] S. Krishnan and R. Rangaraj, “Adaptive Time-Frequency Analysis of Knee Joint Vibroarthrographic Signals for Noninvasive Screening of Articular Cartilage Pathology,” IEEE Transactions on Biomedical Engineering, Vol. 47, No. 6, 2000, pp. 773-783. doi:10.1109/10.844228 Copyright © 2011 SciRes. JSIP |