

Paper Menu >>
Journal Menu >>
 Journal of Signal and Information Processing, 2011, 2, 159-164 doi:10.4236/jsip.2011.23020 Published Online August 2011 (http://www.SciRP.org/journal/jsip) Copyright © 2011 SciRes. JSIP 159 Study on Evaluation Method of Aluminum Alloy Pulse MIG Welding Stability Based on Arc Voltage Probability Density Jing Nie1, Xiao-Feng Meng 1, Yu Shi2 1School of Instrumentation Science & Optoelectronics Engineering, Beihang University, Beijing, China; 2Key Laboratory of Non- Ferrous Metal Alloys and Processing of Ministry of Education, Lanzhou University of Technology, Lanzhou, China. Email: [email protected] Received February 24th, 2011; revised April 16th, 2011; accepted April 25th, 2011. ABSTRACT Bring forward a new analytica l method in order to evaluate the stability of the process of a luminum alloy pulsed MIG welding. The ratio of the first and the second peak in arc voltage signal probability density was selected to evaluate aluminum alloy pulse MIG welding stability. By calculating the arc voltage signal probability density from 80 sets of welding experiments, the ratio of the two peaks in arc voltage probability in every set was captured. And the evaluation system of aluminum alloy pulse MIG welding stability was established. The smaller the ratio of peaks in arc voltage signal probability density is, the better the stability of the welding will be; the bigger the ratio of peaks in arc voltage signal probability density is, the poorer the stability of the welding will be. Keywords: Aluminum Alloy, Pulse MIG, Welding Stability, Probability-Density, Arc Voltage 1. Introduction The process of aluminum alloy pulse MIG welding is characterized by its non-linearity, strong time-varying, strong coupling between the parameters, and so forth [1]. The reason why its process is unstable has not been well explained until now. Becaus e of the lack of the parameter matched stability evalu ation indicators, the control of the aluminum alloy pulse MIG welding by changing the welding parameters is very difficult. The fail of matching the parameter will probably lead to the instability in the welding process or even worse. In recent years, many scholars at home and abroad have studied the stability in the welding process: reference [2] put forward an on-line evaluation model of the process stability by use of the statistical analysis and partial least-squares regression. Reference [3] an d [4] found that the approximate entropy of the arc signal varied with the change of the parameter. Reference [5] and [6] analyzed the prob ability density of the corresponding welding current and voltage and fi- nally evaluated the welding stability. This paper analyzed the probability density distribu- tion of the 80 sets of voltage signal under different weld- ing speed, wire-feeder speed and duty cycle matched pa- rameters. 2. Experimental System The experiment applied DELEX VIRIO MIG-400L welding machine to pure Ar gas shield bead-on-plate welding. The designation of the welding wire was 5356, diameter 1.2 mm. The material of the workpiece was aluminum50581-H321 with the thick of 6mm. The torch was fixed during welding. And its distance between the workpiece was unchanging. The workpiece moved on the worktable. The initial wire extension was 15 mm. Data acquisition card PCL812PG was applied to the welding and its frequency was 1 kHz. The current sensor was CSM400FA/100 mA. The time between the arc igniting and ending was not less than 45 s. Video acquisition captured the condition of the arc and molten pool to judge the stability of the welding. Figure 1 was the ex- perimental system. Because of the finding that the duty cycle of the pulse current, the wire-feeder speed and welding speed impact the welding stability greatly, the experiment combined the duty cycle, the wire-feeder speed and the welding speed to weld. Th e base valu e o f the weld ing curren t was 25 A, the peak value 180 A, pulse frequency 40 Hz, welding voltage 18 V, and shielding airflow 18 L/min. Because the aluminum alloy pulse MIG welding was 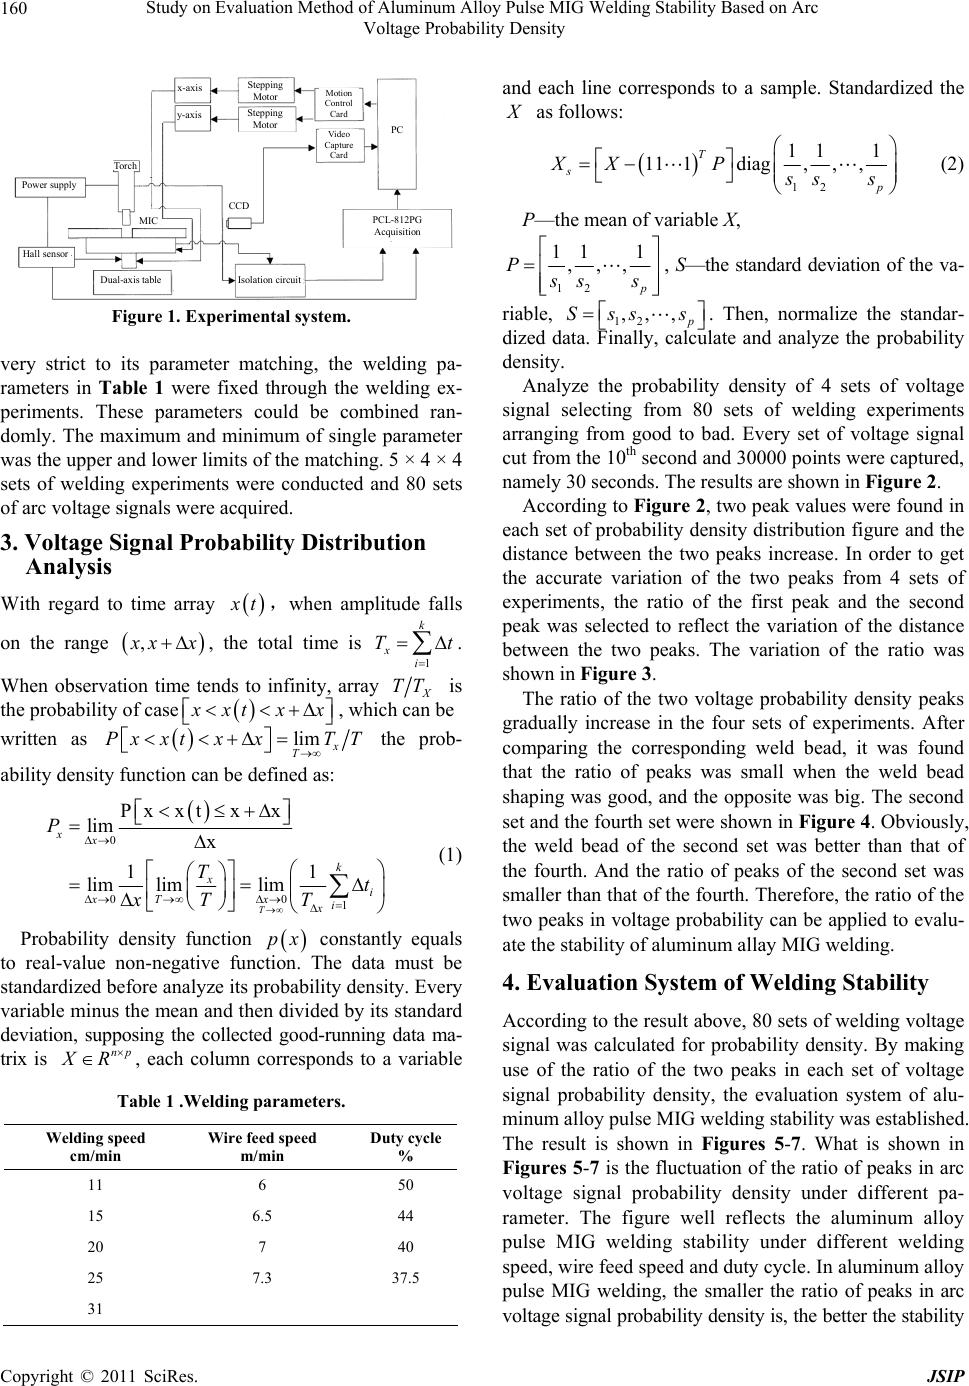 Study on Evaluation Method of Aluminum Alloy Pulse MIG Welding Stability Based on Arc 160 Voltage Probability Density x-axis y -axis PC Dual-axis table PCL-812PG Acquisition Motion Control Card Video Capture Card Power supply Hall sensor CCD MIC Isolation circuit Stepping Motor Stepping Motor Torch Figure 1. Experimental system. very strict to its parameter matching, the welding pa- rameters in Table 1 were fixed through the welding ex- periments. These parameters could be combined ran- domly. The maximum and minimum of single parameter was the upper and lower limits of the matching. 5 × 4 × 4 sets of welding experiments were conducted and 80 sets of arc voltage signals were acquired. 3. Voltage Signal Probability Distribution Analysis With regard to time array x t,when amplitude falls on the range , x xx , the total time is 1 k xi T t . When observation time tends to infinity, array X TT is the probability of case x xt x x , which can be written as limt xxT x T Px xT the prob- ability density function can be defined as: 0 00 1 Px xtxx lim x 11 lim limlim T xx k xi xTx i x P Tt xT T (1) Probability density function constantly equals to real-value non-negative function. The data must be standardized before analyze its probab ility density. Ev ery variable minus the mean and then divided by its standard deviation, supposing the collected good-running data ma- trix is px np X R , each column corresponds to a variable Table 1 .Welding parameters. Welding speed cm/min Wire feed speed m/min Duty cycle % 11 6 50 15 6.5 44 20 7 40 25 7.3 37.5 31 and each line corresponds to a sample. Standardized the X as follows: 12 11 1 11 1diag,,, T s p XX P s ss (2) P—the mean of variable X, 12 111 ,,, p P s ss , S—the standard deviation of the va- riable, 12 ,,, p Sss s . Then, normalize the standar- dized data. Finally, calculate and analyze the probability density. Analyze the probability density of 4 sets of voltage signal selecting from 80 sets of welding experiments arranging from good to bad. Every set of voltage signal cut from the 10th second and 30000 p oints wer e captur ed, namely 30 seconds. The results are shown in Figure 2. According to Figure 2, two peak values were found in each set of probability density distribution figure and the distance between the two peaks increase. In order to get the accurate variation of the two peaks from 4 sets of experiments, the ratio of the first peak and the second peak was selected to reflect the variation of the distance between the two peaks. The variation of the ratio was shown in Figure 3. The ratio of the two voltage probability density peaks gradually increase in the four sets of experiments. After comparing the corresponding weld bead, it was found that the ratio of peaks was small when the weld bead shaping was good, and th e opposite was big. The second set and the fourth set were shown in Figure 4. Obviously, the weld bead of the second set was better than that of the fourth. And the ratio of peaks of the second set was smaller than that of the fourth. Therefor e, the ratio of the two peaks in voltage probability can be applied to evalu- ate the stability of aluminum allay MIG welding. 4. Evaluation System of Welding Stability According to the result above, 80 sets of welding voltage signal was calculated for probability density. By making use of the ratio of the two peaks in each set of voltage signal probability density, the evaluation system of alu- minum alloy pulse MIG welding stability was established. The result is shown in Figures 5-7. What is shown in Figures 5-7 is the fluctuation of the ratio of peaks in arc voltage signal probability density under different pa- rameter. The figure well reflects the aluminum alloy pulse MIG welding stability under different welding speed, wire feed speed and duty cycle. In aluminum alloy pulse MIG welding, the smaller the ratio of peaks in arc voltage signal probability denity is, the bet ter the stabi lity s Copyright © 2011 SciRes. JSIP 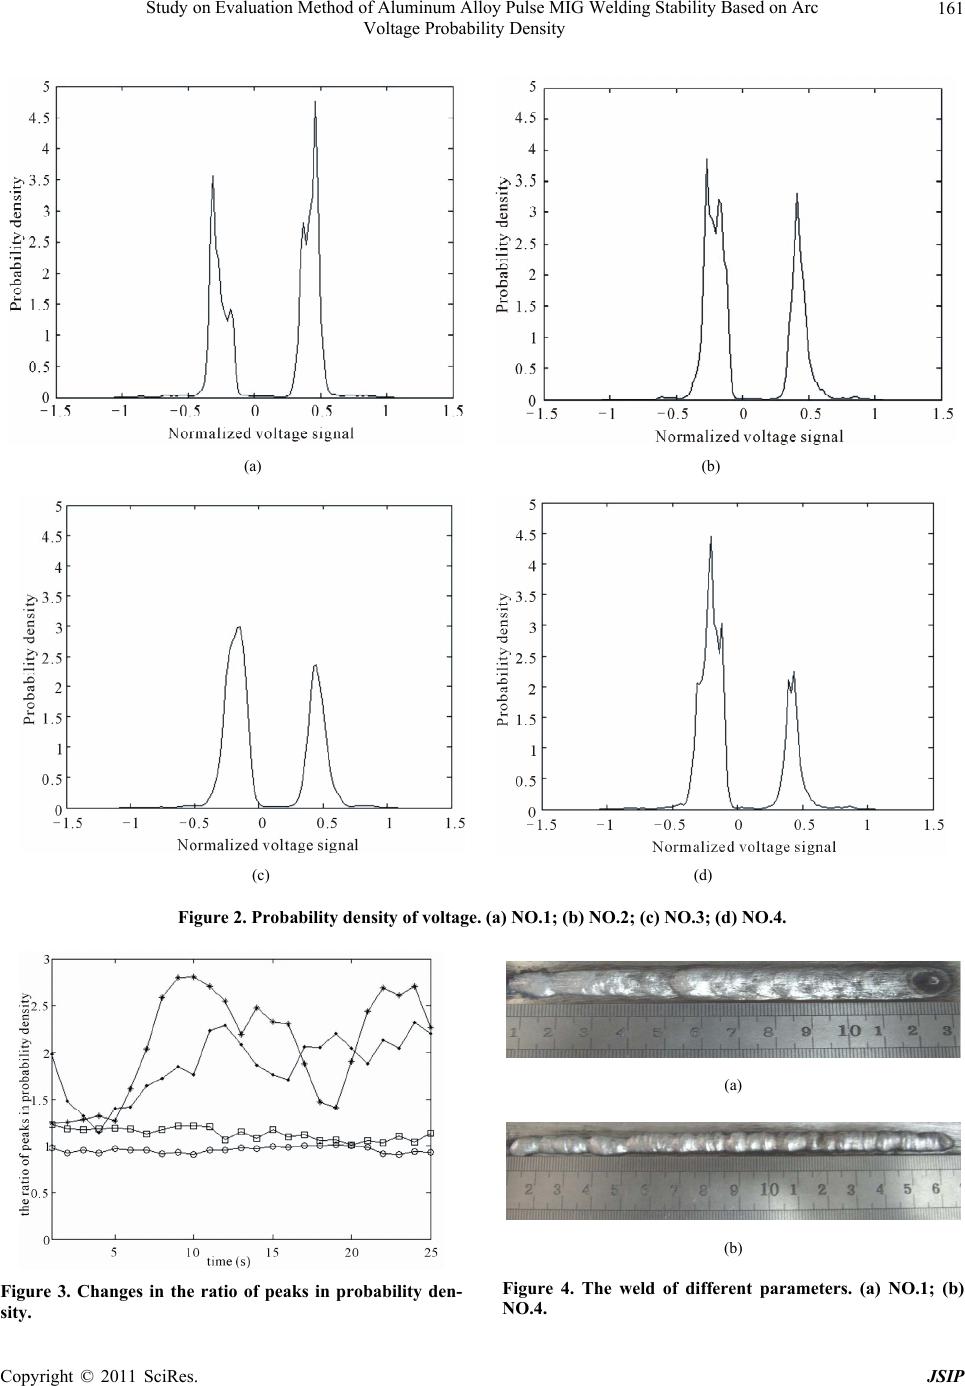 Study on Evaluation Method of Aluminum Alloy Pulse MIG Welding Stability Based on Arc Voltage Probability Density Copyright © 2011 SciRes. JSIP 161 (a) (b) (c) (d) Figure 2. Probability density of voltage. (a) NO.1; (b) NO.2; (c) NO.3; (d) NO.4. (a) (b) Figure 4. The weld of different parameters. (a) NO.1; (b) O.4. Figure 3. Changes in the ratio of peaks in probability den- sity. N 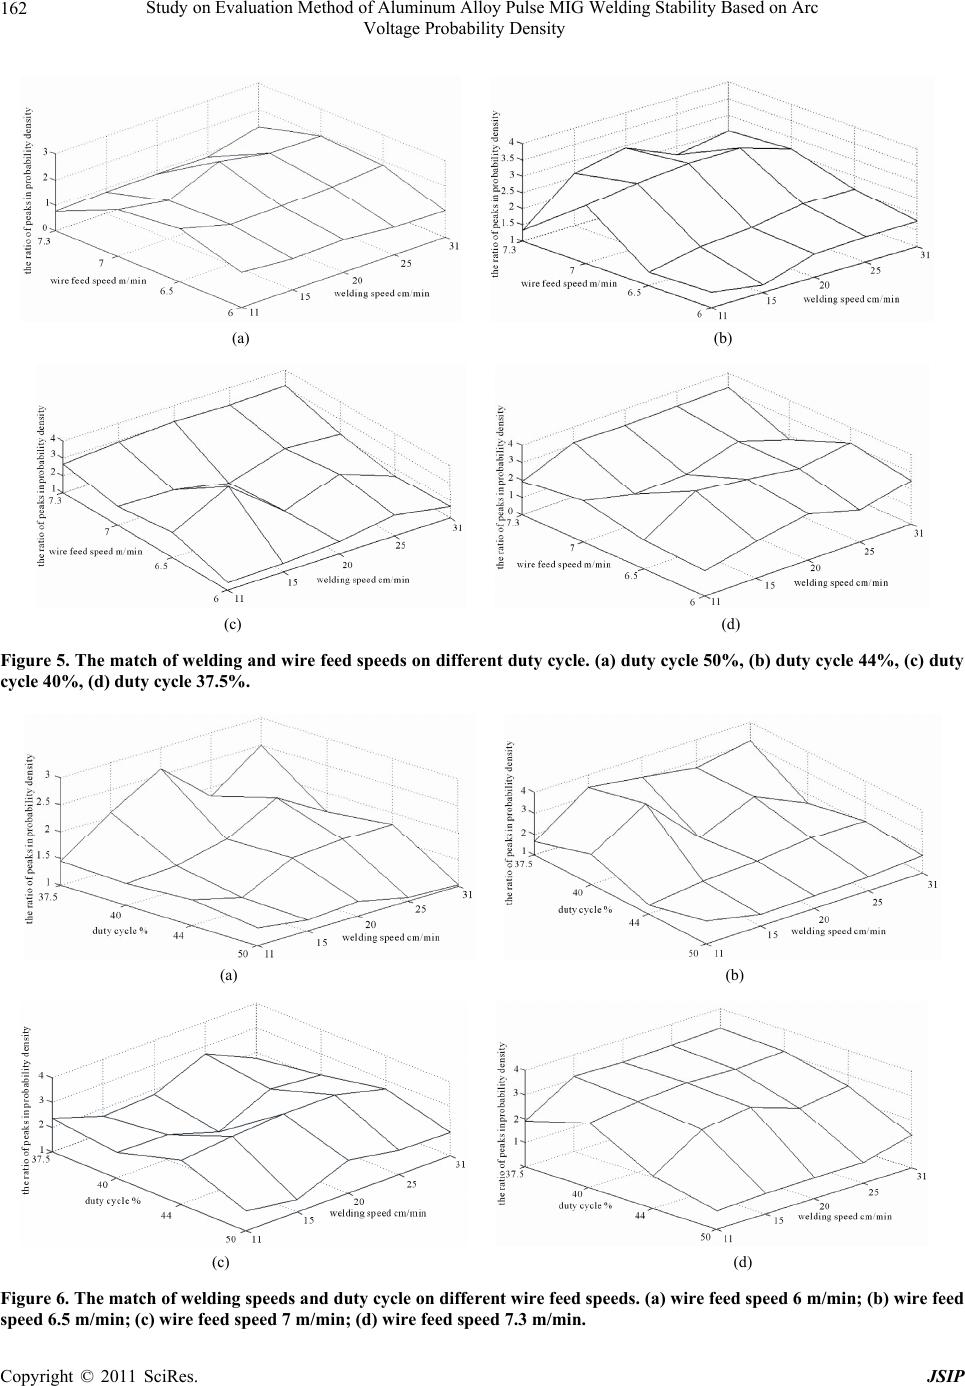 Study on Evaluation Method of Aluminum Alloy Pulse MIG Welding Stability Based on Arc 162 Voltage Probability Density (a) (b) (c) (d) Figure 5. The match of welding and wire feed speeds on different duty cycle. (a) duty cycle 50%, (b) duty cycle 44%, (c) duty cycle 40%, (d) duty cycle 37.5%. (a) (b) (c) (d) Figure 6. The match of welding speeds and duty cycle on different wire feed speeds. (a) wire feed speed 6 m/min; (b) wire feed speed 6.5 m/min; (c) wire feed speed 7 m/min; (d) wire feed speed 7.3 m/min. Copyright © 2011 SciRes. JSIP 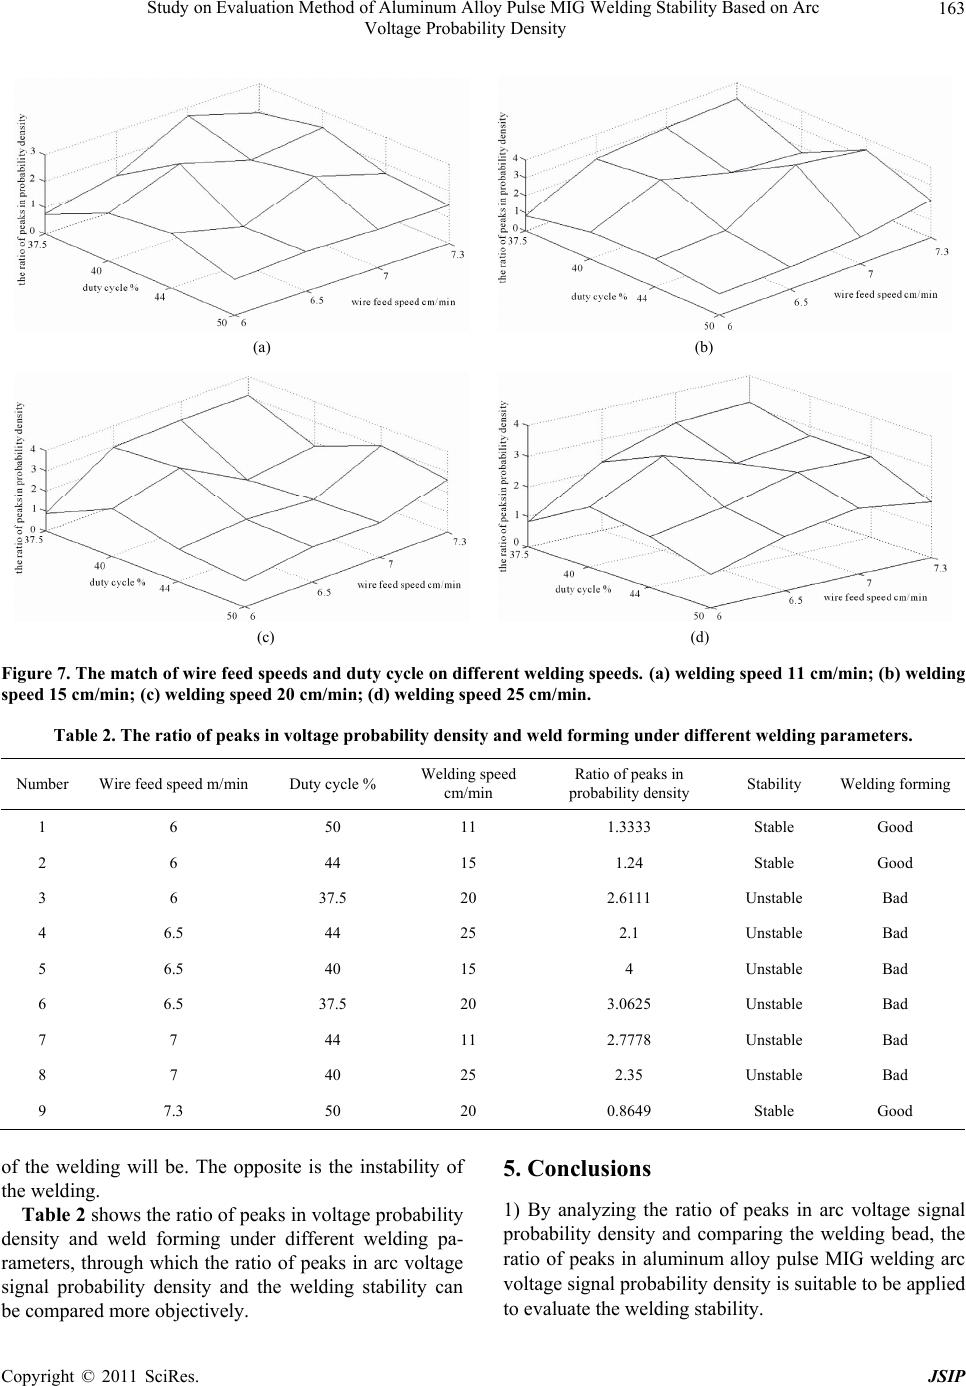 Study on Evaluation Method of Aluminum Alloy Pulse MIG Welding Stability Based on Arc 163 Voltage Probability Density (a) (b) (c) (d) Figure 7. The match of wire feed speeds and duty cycle on different welding speeds. (a) welding speed 11 cm/min; (b) welding speed 15 cm/min; (c) welding speed 20 cm/min; (d) welding speed 25 cm/min. Table 2. The ratio of peaks in voltage probability density and weld forming under different welding parameters. Number Wire feed speed m/minDuty cycle % Welding speed cm/min Ratio of peaks in probability density Stability Welding forming 1 6 50 11 1.3333 Stable Good 2 6 44 15 1.24 Stable Good 3 6 37.5 20 2.6111 Unstable Bad 4 6.5 44 25 2.1 Unstable Bad 5 6.5 40 15 4 Unstable Bad 6 6.5 37.5 20 3.0625 Unstable Bad 7 7 44 11 2.7778 Unstable Bad 8 7 40 25 2.35 Unstable Bad 9 7.3 50 20 0.8649 Stable Good of the welding will be. The opposite is the instability of the welding. Table 2 shows the ratio of peaks in voltage probability density and weld forming under different welding pa- rameters, through which the ratio of peaks in arc voltage signal probability density and the welding stability can be compared more objectively. 5. Conclusions 1) By analyzing the ratio of peaks in arc voltage signal probability density and comparing the welding bead, the ratio of peaks in aluminum alloy pulse MIG welding arc voltage signal probability density is suitable to be applied to evaluate the welding stability. Copyright © 2011 SciRes. JSIP 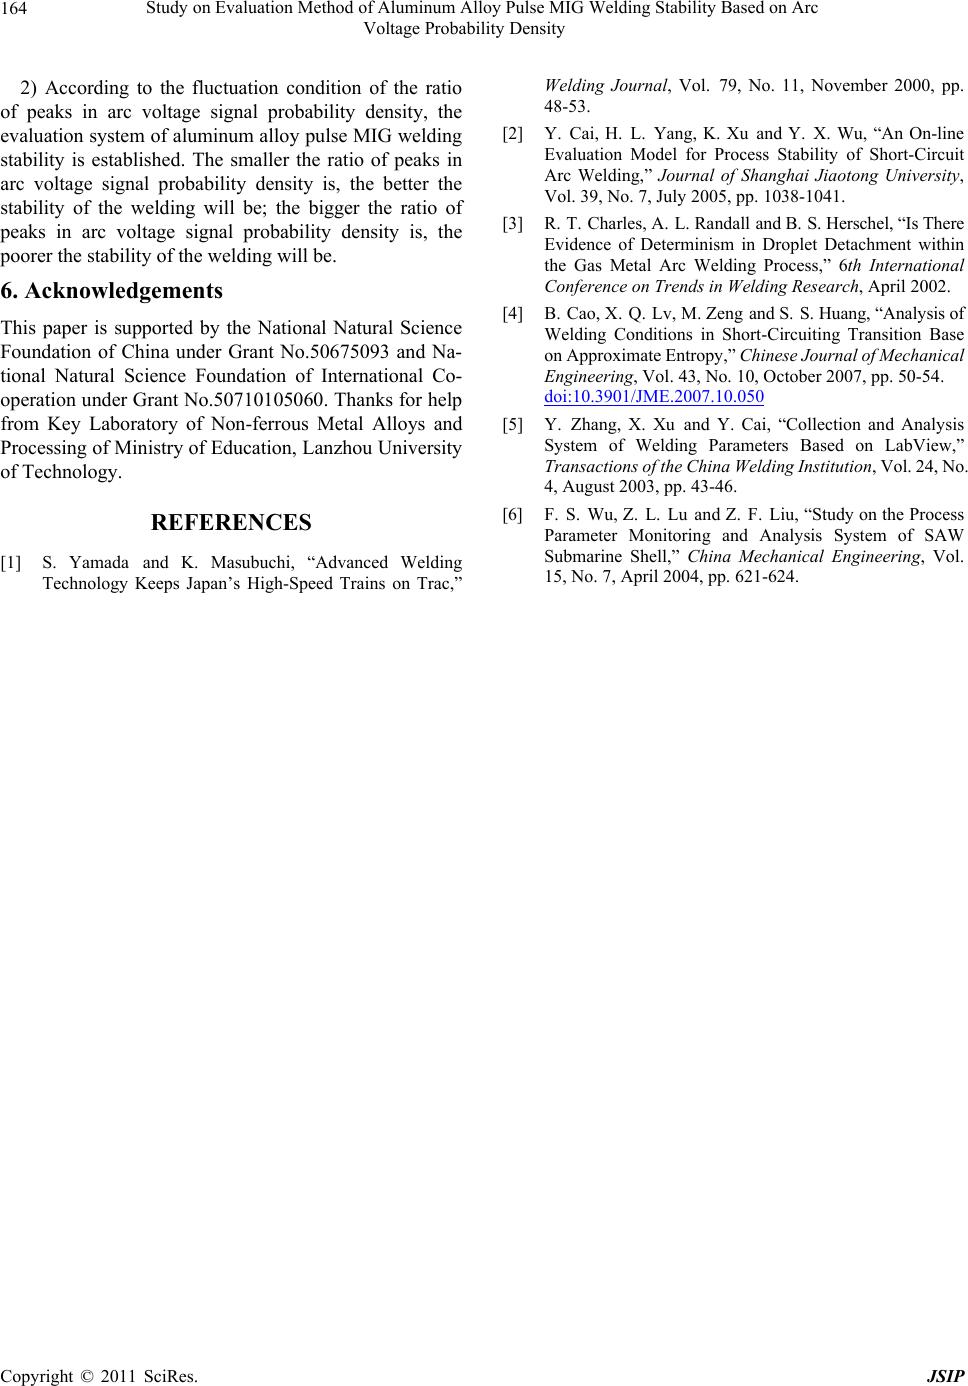 Study on Evaluation Method of Aluminum Alloy Pulse MIG Welding Stability Based on Arc 164 Voltage Probability Density 2) According to the fluctuation condition of the ratio of peaks in arc voltage signal probability density, the evaluation system of aluminum alloy pulse MIG welding stability is established. The smaller the ratio of peaks in arc voltage signal probability density is, the better the stability of the welding will be; the bigger the ratio of peaks in arc voltage signal probability density is, the poorer the stability of the welding will be. 6. Acknowledgements This paper is supported by the National Natural Science Foundation of China under Grant No.50675093 and Na- tional Natural Science Foundation of International Co- operation under Grant No.50710105060. Thanks for help from Key Laboratory of Non-ferrous Metal Alloys and Processing of Ministry of Education, Lanz hou University of Technology. REFERENCES [1] S. Yamada and K. Masubuchi, “Advanced Welding Technology Keeps Japan’s High-Speed Trains on Trac,” Welding Journal, Vol. 79, No. 11, November 2000, pp. 48-53. [2] Y. Cai, H. L. Yang, K. Xu and Y. X. Wu, “An On-line Evaluation Model for Process Stability of Short-Circuit Arc Welding,” Journal of Shanghai Jiaotong University, Vol. 39, No. 7, July 2005, pp. 1038-1041. [3] R. T. Charles, A. L. Randall and B. S. Herschel, “Is There Evidence of Determinism in Droplet Detachment within the Gas Metal Arc Welding Process,” 6th International Conference on Trends in Welding Research, April 2002. [4] B. Cao, X. Q. Lv, M. Zeng and S. S. Huang, “Analysis of Welding Conditions in Short-Circuiting Transition Base on Approximate Entrop y,” Chinese Journal of Mechanical Engineering, Vol. 43, No. 10, October 2007, pp. 50-54. doi:10.3901/JME.2007.10.050 [5] Y. Zhang, X. Xu and Y. Cai, “Collection and Analysis System of Welding Parameters Based on LabView,” Transactions of the Chi na Welding Institu tion, Vol. 24, No. 4, August 2003, pp. 43-46. [6] F. S. Wu, Z. L. Lu and Z. F. Liu, “Study on the Process Parameter Monitoring and Analysis System of SAW Submarine Shell,” China Mechanical Engineering, Vol. 15, No. 7, April 2004, pp. 621-624. Copyright © 2011 SciRes. JSIP |