

Paper Menu >>
Journal Menu >>
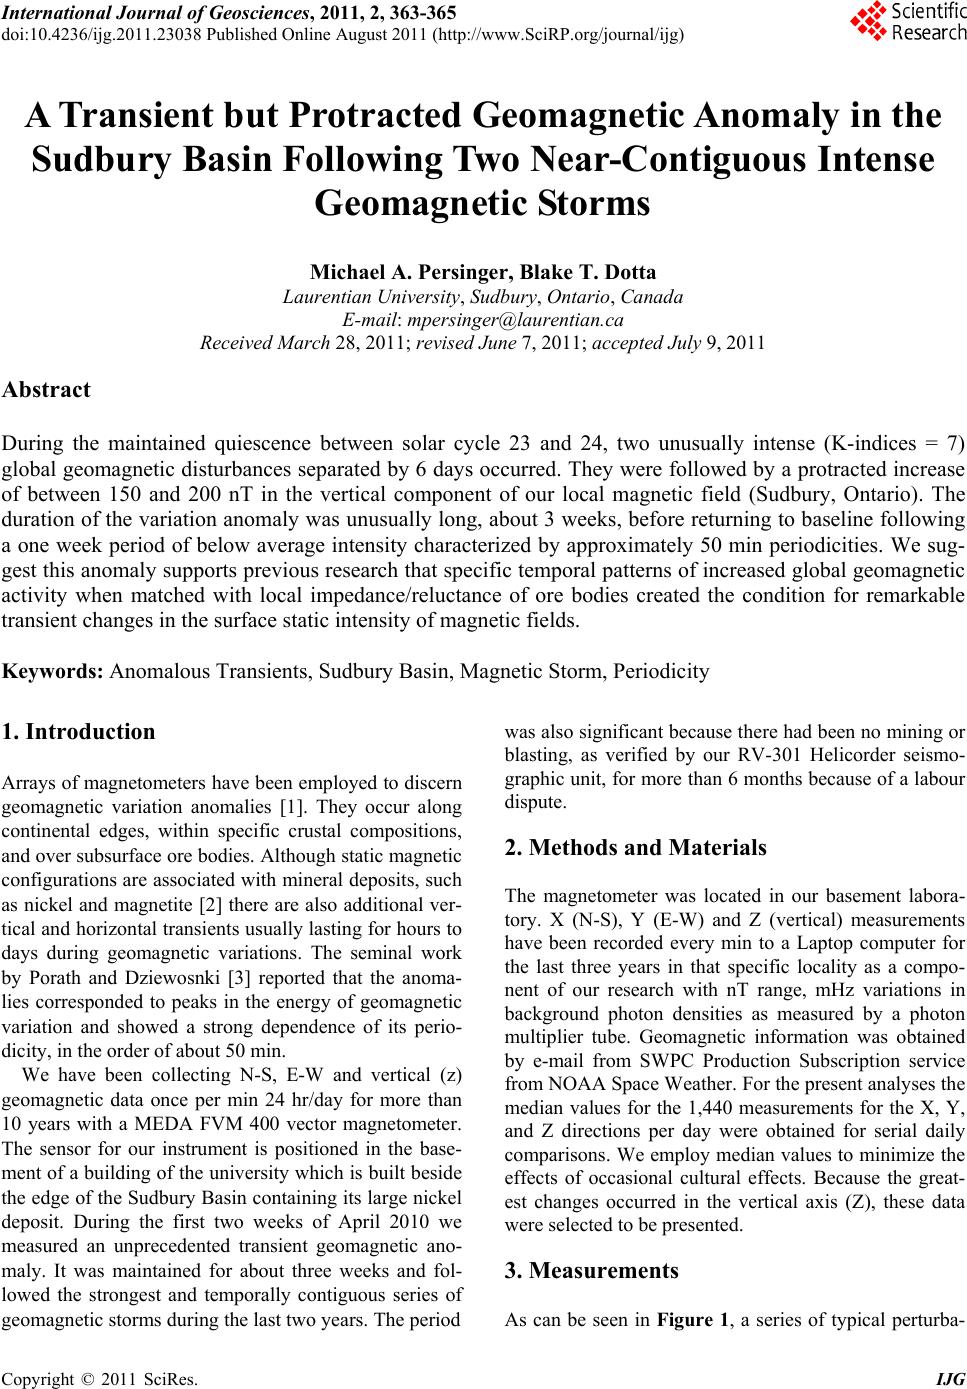 International Journal of Geosciences, 2011, 2, 363-365 doi:10.4236/ijg.2011.23038 Published Online August 2011 (http://www.SciRP.org/journal/ijg) Copyright © 2011 SciRes. IJG A Transient but Protracted Geomagnetic Anomaly in the Sudbury Basin Following Two Near-Contiguous Intense Geomagnetic Storms Michael A. Persinger, Blake T. Dotta Laurentian University, Sudbury, Onta rio, Canada E-mail: [email protected] Received March 28, 2011; revised June 7, 2011; accepted July 9, 2011 Abstract During the maintained quiescence between solar cycle 23 and 24, two unusually intense (K-indices = 7) global geomagnetic disturbances separated by 6 days occurred. They were followed by a protracted increase of between 150 and 200 nT in the vertical component of our local magnetic field (Sudbury, Ontario). The duration of the variation anomaly was unusually long, about 3 weeks, before returning to baseline following a one week period of below average intensity characterized by approximately 50 min periodicities. We sug- gest this anomaly supports previous research that specific temporal patterns of increased global geomagnetic activity when matched with local impedance/reluctance of ore bodies created the condition for remarkable transient changes in the surface static intensity of magnetic fields. Keywords: Anomalous Transients, Sudbury Basin, Magnetic Storm, Periodicity 1. Introduction Arrays of magnetometers have been employed to discern geomagnetic variation anomalies [1]. They occur along continental edges, within specific crustal compositions, and over subsurface ore bodies. Although static magnetic configurations are associated with mineral deposits, such as nickel and magnetite [2] there are also additional ver- tical and horizontal transients usually lasting for hours to days during geomagnetic variations. The seminal work by Porath and Dziewosnki [3] reported that the anoma- lies corresponded to peaks in the energy of geomagnetic variation and showed a strong dependence of its perio- dicity, in the order of about 50 min. We have been collecting N-S, E-W and vertical (z) geomagnetic data once per min 24 hr/day for more than 10 years with a MEDA FVM 400 vector magnetometer. The sensor for our instrument is positioned in the base- ment of a building of the university which is built beside the edge of the Sudbury Basin containing its large nickel deposit. During the first two weeks of April 2010 we measured an unprecedented transient geomagnetic ano- maly. It was maintained for about three weeks and fol- lowed the strongest and temporally contiguous series of geomagnetic storms during the last two years. The period was also significant because there had been no mining or blasting, as verified by our RV-301 Helicorder seismo- graphic unit, for more than 6 months because of a labour dispute. 2. Methods and Materials The magnetometer was located in our basement labora- tory. X (N-S), Y (E-W) and Z (vertical) measurements have been recorded every min to a Laptop computer for the last three years in that specific locality as a compo- nent of our research with nT range, mHz variations in background photon densities as measured by a photon multiplier tube. Geomagnetic information was obtained by e-mail from SWPC Production Subscription service from NOAA Space Weather. For the present analyses the median values for the 1,440 measurements for the X, Y, and Z directions per day were obtained for serial daily comparisons. We employ median values to minimize the effects of occasional cultural effects. Because the great- est changes occurred in the vertical axis (Z), these data were selected to be presented. 3. Measurements As can be seen in Figure 1, a series of typical perturba- 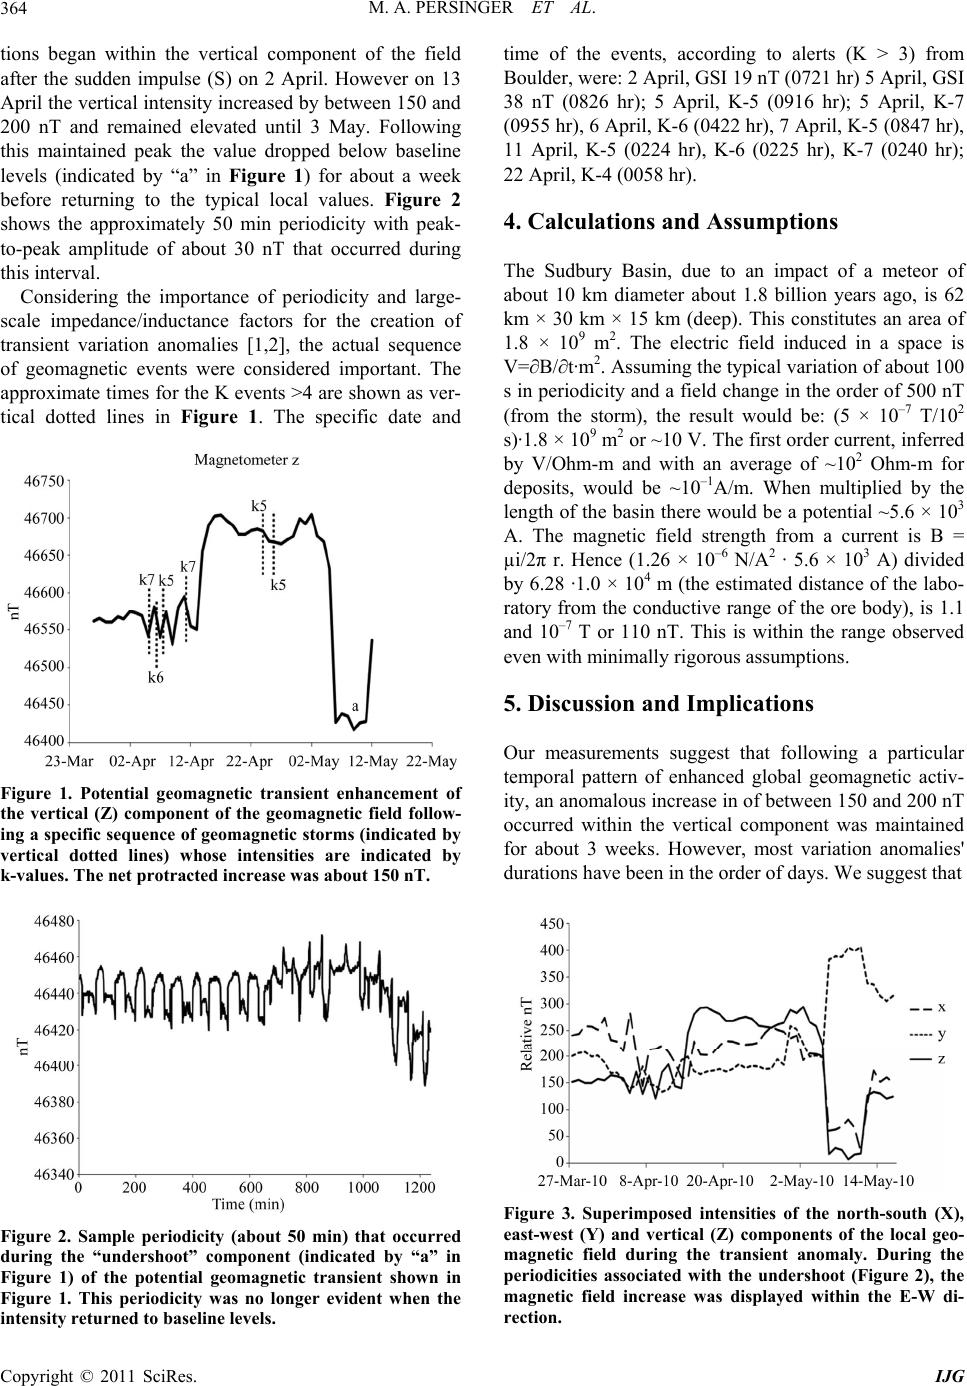 M. A. PERSINGER ET AL. 364 tions began within the vertical component of the field after the sudden impulse (S) on 2 April. However on 13 April the vertical intensity increased by between 150 and 200 nT and remained elevated until 3 May. Following this maintained peak the value dropped below baseline levels (indicated by “a” in Figure 1) for about a week before returning to the typical local values. Figure 2 shows the approximately 50 min periodicity with peak- to-peak amplitude of about 30 nT that occurred during this interval. Considering the importance of periodicity and large- scale impedance/inductance factors for the creation of transient variation anomalies [1,2], the actual sequence of geomagnetic events were considered important. The approximate times for the K events >4 are shown as ver- tical dotted lines in Figure 1. The specific date and Figure 1. Potential geomagnetic transient enhancement of the vertical (Z) component of the geomagnetic field follow- ing a specific sequence of geomagnetic storms (indicated by vertical dotted lines) whose intensities are indicated by k-values. The net protracted increase was about 150 nT. Figure 2. Sample periodicity (about 50 min) that occurred during the “undershoot” component (indicated by “a” in Figure 1) of the potential geomagnetic transient shown in Figure 1. This periodicity was no longer evident when the intensity returned to baseline levels. time of the events, according to alerts (K > 3) from Boulder, were: 2 April, GSI 19 nT (0721 hr) 5 April, GSI 38 nT (0826 hr); 5 April, K-5 (0916 hr); 5 April, K-7 (0955 hr), 6 April, K-6 (0422 hr), 7 April, K-5 (0847 hr), 11 April, K-5 (0224 hr), K-6 (0225 hr), K-7 (0240 hr); 22 April, K-4 (0058 hr). 4. Calculations and Assumptions The Sudbury Basin, due to an impact of a meteor of about 10 km diameter about 1.8 billion years ago, is 62 km × 30 km × 15 km (deep). This constitutes an area of 1.8 × 10⁹ m 2. The electric field induced in a space is V=∂B/∂t·m2. Assuming the typical variation of about 100 s in periodicity and a field change in the order of 500 nT (from the storm), the result would be: (5 × 10⁻⁷ T/102 s)·1.8 × 10⁹ m2 or ~10 V. The first order current, inferred by V/Ohm-m and with an average of ~102 Ohm-m for deposits, would be ~10–1A/m. When multiplied by the length of the basin there would be a potential ~5.6 × 10³ A. The magnetic field strength from a current is B = µi/2π r. Hence (1.26 × 10⁻⁶ N/A2 · 5.6 × 103 A) divided by 6.28 ·1.0 × 104 m (the estimated distance of the labo- ratory from the conductive range of the ore body), is 1.1 and 10–7 T or 110 nT. This is within the range observed even with minimally rigorous assumptions. 5. Discussion and Implications Our measurements suggest that following a particular temporal pattern of enhanced global geomagnetic activ- ity, an anomalous increase in of between 150 and 200 nT occurred within the vertical component was maintained for about 3 weeks. However, most variation anomalies' durations have been in the order of days. We suggest that Figure 3. Superimposed intensities of the north-south (X), east-west (Y) and vertical (Z) components of the local geo- magnetic field during the transient anomaly. During the periodicities associated with the undershoot (Figure 2), the magnetic field increase was displayed within the E-W di- rection. Copyright © 2011 SciRes. IJG 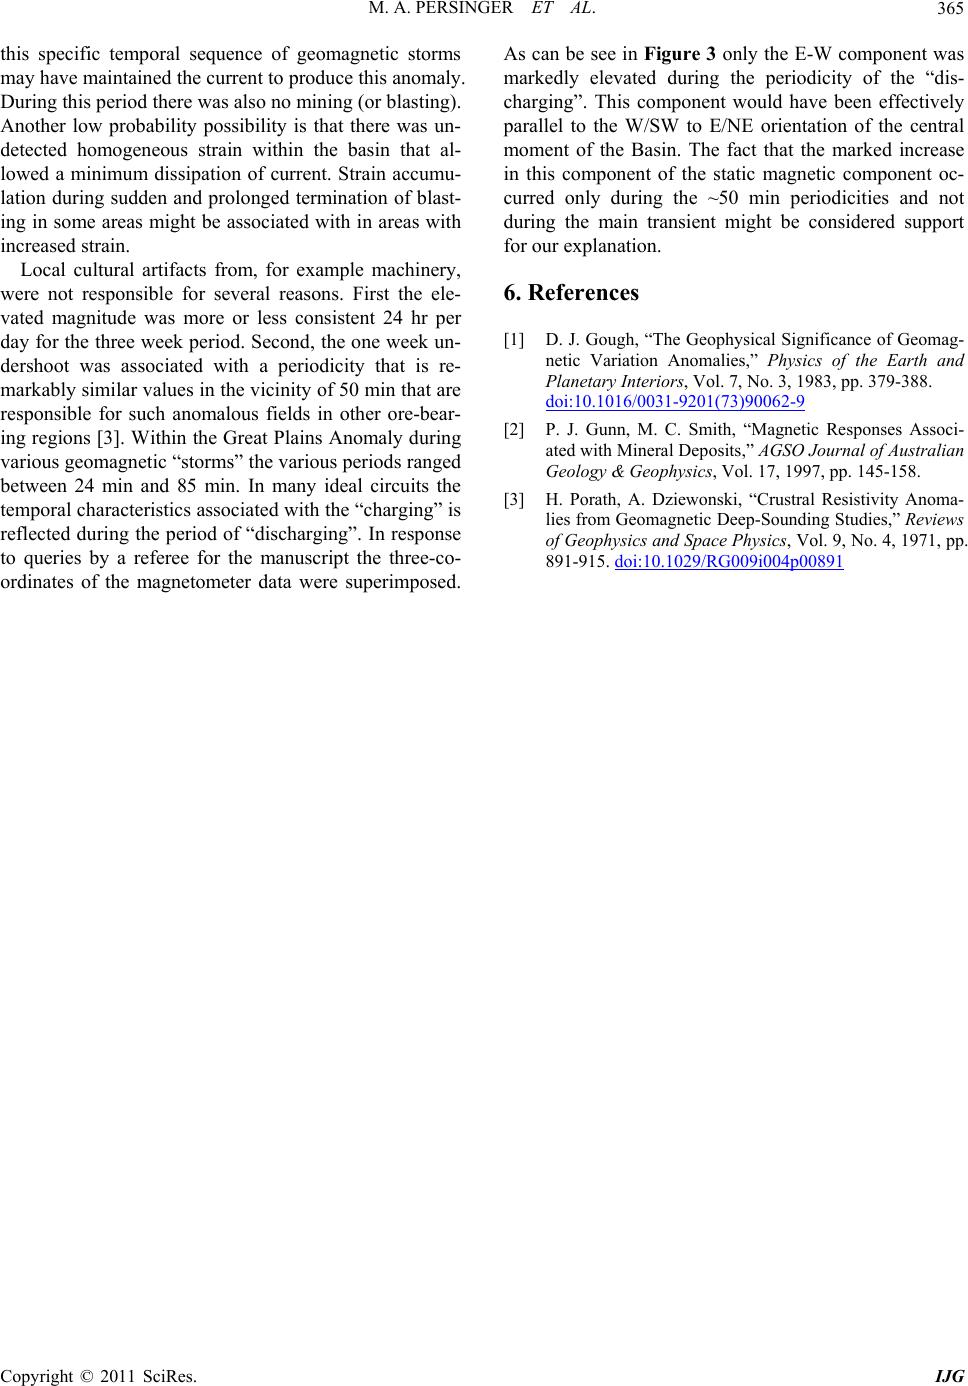 M. A. PERSINGER ET AL. Copyright © 2011 SciRes. IJG 365 this specific temporal sequence of geomagnetic storms may have maintained the current to produce this anomaly. During this period there was also no mining (or blasting). Another low probability possibility is that there was un- detected homogeneous strain within the basin that al- lowed a minimum dissipation of current. Strain accumu- lation during sudden and prolonged termination of blast- ing in some areas might be associated with in areas with increased strain. Local cultural artifacts from, for example machinery, were not responsible for several reasons. First the ele- vated magnitude was more or less consistent 24 hr per day for the three week period. Second, the one week un- dershoot was associated with a periodicity that is re- markably similar values in the vicinity of 50 min that are responsible for such anomalous fields in other ore-bear- ing regions [3]. Within the Great Plains Anomaly during various geomagnetic “storms” the various periods ranged between 24 min and 85 min. In many ideal circuits the temporal characteristics associated with the “charging” is reflected during the period of “discharging”. In response to queries by a referee for the manuscript the three-co- ordinates of the magnetometer data were superimposed. As can be see in Figure 3 only the E-W component was markedly elevated during the periodicity of the “dis- charging”. This component would have been effectively parallel to the W/SW to E/NE orientation of the central moment of the Basin. The fact that the marked increase in this component of the static magnetic component oc- curred only during the ~50 min periodicities and not during the main transient might be considered support for our explanation. 6. References [1] D. J. Gough, “The Geophysical Significance of Geomag- netic Variation Anomalies,” Physics of the Earth and Planetary Interiors, Vol. 7, No. 3, 1983, pp. 379-388. doi:10.1016/0031-9201(73)90062-9 [2] P. J. Gunn, M. C. Smith, “Magnetic Responses Associ- ated with Mineral Deposits,” AGSO Journal of Australian Geology & Geophysics, Vol. 17, 1997, pp. 145-158. [3] H. Porath, A. Dziewonski, “Crustral Resistivity Anoma- lies from Geomagnetic Deep-Sounding Studies,” Reviews of Geophysics and Space Physics, Vol. 9, No. 4, 1971, pp. 891-915. doi:10.1029/RG009i004p00891 |