

Paper Menu >>
Journal Menu >>
 Creative Education 2011. Vol.2, No.3, 305-312 Copyright © 2011 SciRes. DOI:10.4236/ce.2011.23042 Quality Issues in Higher Education: A Multicriteria Framework of Satisfaction Measures George A. Dimas, Aspa Goula, George Pierrakos Technological Education Institute of Athens, Athens, Greece. Email: [email protected] Received May 9th, 2011; revised June 2nd, 2011; accepted June 16th, 2011. Higher education attributes significant interest to student satisfaction because of its potential impact on the qual- ity dimensions of the offered services. This is illustrated from the large number of studies that have shown a moderate to strong relationship between these two concepts. This paper provides a detailed analysis of a student satisfaction survey conducted at the Health Care Management Department of the Technological Education In- stitute of Athens. The analysis was based on a multi-criteria preference disaggregation method (MUSA). Results are focused on the evaluation of student choices, while significant findings of the applied methodology consti- tute the determination of strong and weak points of the educational component’s preferences that form important suggestions for the improvement of the satisfaction level and the quality characteristics of the correspondent services. Keywords: Higher Education, Quality Management, Multi-Criteria Analysis Introduction In recent years many studies in the area of quality in higher education have been carried out indicating thus the significant importance of the relevant concept. Although quality assurance schemes in European Higher Education were first introduced in France (1984), the UK (1985) and the Netherlands (1985) (Westerbeijden et al., 2007) it was first the Sorbonne declara- tion (1998) and then the Bologna declaration (June 1999) that addressed this issue at an international level by promoting the development of a coherent and cohesive European Higher Education Area by 2010. Moreover in the Bergen ministerial meeting (Bergen, 2005) the standards and guidelines for quality assurance in the European Higher Education Area were adopted as proposed by the European Association for Quality Assurance in Higher Education (ENQA). Finally in the Louvain meeting (April 2009) the importance of quality assurance in all aspects of higher education was acknowledged by the European minis- ters. In all the above meetings the need to enhance quality in European Higher Education at institutional and national levels was stressed, driving thus universities around Europe to adopt external evaluation systems and also to apply for an ISO9001: 2000 certificate as a part of their internal quality management system (Hutyra, 2005). In Greece however, such a system was introduced around 2007 as a permanent procedure for improve- ing the quality and quality assurance in higher education insti- tutions. Defining quality in higher education engages many difficult- ties due to its complex character. Harvey and Green (1993) proposed a structural development of quality consisting of five dimensions i.e.: Quality as exceptional (quality is considered in terms of excellence), Quality as perfection or consistency (the processes and specifications are aimed to be perfectly met), Quality as fitness for purpose (meeting customer requirements), Quality as value for money (quality is related to costs), Quality as transformation (the process should produce a fundamental change that includes empowerment to take action and en- hancement of customer satisfaction). Harvey and Knight (1996) suggested that Quality as transformation can incorporate the other dimensions to some extent. Tam (2001), commented that quality is a highly contested concept and has multiple meanings linked to how higher educa- tion is perceived (Harvey & Williams, 2010). Shrikanthan and Dalrymple (2003) presented a correspon- dence between the four stakeholders of quality in Harvey and Green’s dimensions as follows: 1) Providers (funding bodies and community at large). Qua- lity is interpreted as value for money, 2) Users of products (current and prospective students). Quality is interpreted in terms of excellence, 3) Users of outputs (i.e. employers). Qua- lity is interpreted as fitness for purpose, 4) The employees of the sector (academics and administrators). Quality is interpreted as consistency. Van Kemenade et al. (2008) described quality with four con- stituents: object, standard, subject, value and elaborates on four value systems on quality and quality management: control, continuous improvement, commitment and breakthrough. Generally, quality in services is closely linked to customer’s satisfaction. Athiyaman (1997) linked student satisfaction with service quality and concluded that perceived quality depends on satisfaction. Shemwell et al. (1998) argues that in today’s world of intense competition, the key to sustainable competitive ad- vantage lies in delivering high quality service that will result in satisfied customers. Martensen et al. (2000) applied the Euro- pean Customer Satisfaction Index to measure student’s per- ceived quality and satisfaction. Sureshchandar et al. (2002) investigated the link between service quality and customer sa- tisfaction in terms of the same operationalized factors and ob- served that these two are closely related which means that an increase in one is likely to lead to a rise in the other. Elliot and  G. A. DIMAS ET AL. 306 Shin (2002) discussed the positive effect that student’s satisfac- tion plays on student’s motivation, student’s retention and re- cruiting efforts. Bigne et al. (2003) found that overall service quality has a significant relationship with satisfaction while Ham and Hayduk (2003) have confirmed that there is a positive correlation between perception of service quality and student satisfaction. Suhre et al. (2007) explored the impact of degree program satisfaction on academic accomplishment and dropout and observed that student accomplishment depends on degree program satisfaction and differences in academic ability. Lee and Tai (2008) investigated critical factors that affect student’s satisfaction in higher education and their impacts on the ma- nagement of higher education organizations. Kim and Richarme (2009) argue that in firms with high customer satisfaction the improvement of service quality will result in positive financial implications. Tsirintani et al. (2010) have proved an asymmet- ric relationship between quality and satisfaction in health ser- vices using the Kano model. A straightforward result emanating from the literature men- tioned above is that quality in higher education and student satisfaction are closely related concepts. This study attempts to further strengthen the former state- ment by estimating the satisfaction of a student sample that attend the Health Care Management Department of the Tech- nological Educational Institute of Athens and provide insights into the education services behavior of the subject group and the student population that the group may represent. To address this issue a multi-criteria methodology is employed (following a parallel rational to Martensen et al.) connecting quality cha- racteristics of the education services to student satisfaction which implies that global student satisfaction is composed of several criteria and sub-criteria representing quality attributes of the offered services (study program, teaching, staff, equip- ment etc). The proposed multi-criteria model links student sa- tisfaction to its constituent quality components through signifi- cant indices and provides the actions that should be undertaken in order to improve the overall performance in these compo- nents. A study with this purpose is rather important since it gives grounds for quality management improvement in higher education services. Under this context quality in this paper is seen as transfor- mation, adapting Harvey and Green’s way of thinking of qua- lity, which suggests that the process should bring a qualitative change. Our attention in measuring satisfaction is focused to students since they constitute the major stakeholder in education (with- out students there is no education business) which of course does not imply that we neglect the other groups involved in the education chain. Moreover the purpose of conducting such a research was ac- tually deemed necessary for the Department since, further to the reasons stated earlier, it would work complementary to the external evaluation that Health Care Management Department has undergone since 2009 (and is still running) from the Hel- lenic Quality Assurance Agency for Higher Education. Health Care Management Department was founded in 1983, as one of the five Departments that constitute the faculty of Management and Economics of the Technological Educational Institute of Athens, and today provides services to 885 active students with 10 full time academic staff and 35 part time aca- demic staff while its program study comprises 8 full time at- tendance semesters. The rest of the paper is organized as follows: section 2 pro- vides the research methodology which contains the planning of the research and the scientific methodology to estimate satis- faction, section 3 presents the results and section 4 summarizes the conclusions and the deduced suggestions. Methodology This section consists of two parts. The aim of the first part is to design and conduct the research at the Health Care Manage- ment Department while in the second part a multi-criteria method is used to obtain the student’s satisfaction degrees and provide the corresponding analysis and actions. Research Planning The research was conducted at the Health Care Management Department and reflects the satisfaction levels of its students for the spring semester 2010. Particularly the planning of the research was based on the following steps: questionnaire de- velopment and research conduction, preliminary data analysis, elaboration and results. The first step comprises the design and the development of a questionnaire as well as the accomplishment of the research. Student questionnaires become one of the most popular meth- ods worldwide to imprint the quality of education (Hendry & Dean, 2002). Significant component in this step is the determi- nation of the satisfaction criteria in other words the dimensions that constitute the overall satisfaction. Sureshchandar et al. (2002) suggest that customer satisfaction is likely to be multi- dimensional in nature and should be operationalized along five factors i.e. core service (the content of a service), human ele- ments of service, systematization of service delivery and social responsibility. Moreover Martensen et al. (2000) in their adap- tation of the ECSI approach to student satisfaction acknowledge the following latent variables to be used in the student satisfac- tion model: institution image, student expectations, perceived quality of non-human elements, perceived quality of human elements, perceived value, student satisfaction and student loy- alty. Lagrosen et al. (2004) examining the dimensions of qual- ity in higher education identified characteristics like course offered, teaching practices, campus facilities, computer facilities, corporate collaboration, information and responsiveness etc. Consequently student satisfaction can be obtained at various levels of an education establishment and therefore taking into consideration the former views the criteria selected to form the overall satisfaction are introduced in the following table, where each criterion is decomposed in several sub-criteria: Based on Table 1, a questionnaire was designed with 31 questions (answered in the 5-pt Likert scale) capturing all the dimensions that constitute the overall student satisfaction. The completion of the questionnaires was obtained by a sample of students in all the semesters of the program-study during one day of their registration period for the spring semester of 2010, where the completion time varied from 16 to 20 minutes. This procedure was mainly adopted in order to minimize student non-responses. Initially 220 questionnaires (25% of the student population) were equally distributed in a random order to stu- dents of all semesters to ensure the sample’s representative, and  G. A. DIMAS ET AL. 307 Table 1. Criteria for student’s global satisfaction. Criteria Sub-criteria 1. Program Study 1.1. Adequacy, 1.2. Organization, 1.3. Workload, 1.4. Profession -Contiguity, 1.5. Course update, 1.6. Module variety 2. Academic Staff 2.1. Friendly behavior, 2.2. Preparation adequacy, 2.3. Communication 2.4. Education methodology, 2.5. Objectivity, 2.6. Informing 2.7. Availability 3. Tangibles (Equipme n t) 3.1. Building adequacy, 3.2. Other facilities, 3.3. Education material 3.4. Labs adequacy, 3.5. Labs timing, 3.6. Library timing 3.7. Library’s reading room, 3.8. Lending Procedures 3.9. Library’s electronic system 4.Administrative Services 4.1. Correspondence, 4.2. Friendly behavior, 4.3. Clear informing 4.4. Service speed 5. Image-F ame 5.1. Expectations, 5.2. Recognition, 5.3. Representation-Promotion 5.4. Quality, 5.5. Interdisciplinary eventually 212 questionnaires were completed that correspond to 24% of the active student population of the department. The sample and the student population consisted of Greek citizens (there are no race differences) with a sample mean age of 19.5 years and a sample range in age of 18 up to 24 years while the percentage of male-female students in the sample was 30 - 70 respectively (28 - 72 in the population). A preliminary data analysis revealed satisfactory levels of internal consistency and reliability with Cronbach’s alpha coef- ficient to be calculated at 82%. Methodological Framework The analysis of the student’s satisfaction was obtained with the MUSA method (Multi-criteria Satisfaction Analysis) which constitutes a multi-criteria approach for the measurement of customer satisfaction based on linear programming techniques and constrained qualitative regression analysis (Grigoroudis & Siskos, 2002, Grigoroudis & Siskos, 2009). The method as- sumes that customer’s global satisfaction can be explained by a set of criteria representing the service’s distinctive dimensions. Hence, it is used for the assessment of global and partial satis- faction functions and i * Y* X respectively, given customer’s ordinal judgments Y and Xi (for the i-th criterion). The functions and i * Y* X indicate the real value that students assign to each level of the global and partial ordinal satisfaction scale. The assumption of an additive utility model is the main princi- pal of the method, and it is represented by the following ordinal regression analysis equation: ** 1 = n ii i YbX where Y* is the estimation of the global value function , n is the number of criteria, bi is a positive weight of the ith criterion which represents the relative importance of the correspondent criterion, σ+ and σ− are the overestimation and the underestima- tion errors respectively, and the value functions and * Y* i X are monotone functions normalized in the interval [0,100]. In order to reduce the size of the mathematical program, the monotonicity constraints for and * Y* i X should be removed. This is possible with the use of the following transformation equations: *1* for 1,2,,1 mm m zy ym *1* for 1,2,, 1 and 1,2,, kk ik iiiii wbx bxkain *k where y*m is the value of the ym satisfaction level, i x is the value of the k i x satisfaction level and a and ai are the number of global and partial satisfaction levels respectively. Based on the above, the estimation model can be formulating into the following linear programming form: 1 min M j j i F subject to 1 1 11 1 0 for 1,2,, j jy nx ikm jj ik m wz j M 1 1 100 m m z 1 11 100 i n ik ik w ,,, ,,, mikjj zw mijk where M is the size of the student sample, yj and j i x are the global and partial satisfaction judgments of the jth student . Furthermore the MUSA methodology provides not only the satisfaction degrees estimated for the criteria and sub-criteria stated above, but also provides a set of normalized indices and diagrams (Grigoroudis & Siskos, 2002) that may enhance the levels of the satisfaction analysis and link the results with ac- tions that should be taken in order to improve the department’s overall performance. Consequently the indices and diagrams that are obtained from the analysis are as follows: Satisfaction indices: these are average indices in the 0 - 1 interval and they reflect the student’s global or criteria satis- faction. Demanding indices: they are normalized indices in the [−1, 1] interval and reveal the student’s global or criteria de- manding level. Improvement indices: they are normalized indices in the [0, 1] interval and display the improvement margins on a spe- cific criterion. Action diagrams: they are diagrams similar to the ones of the SWOT analysis and are obtained from the combinations  G. A. DIMAS ET AL. 308 criteria. of criteria weights and satisfaction indices. Improvement diagrams: they are diagrams obtained from the combinations of demanding and improvement indices and may be used to rank improvement priorities. Additionally the satisfaction analysis obtained indicates that the Health Care Management Department enjoys a high global satisfaction level of 83.7% (mean value) while the rest 16.3% of the students claim to be unsatisfied from the quality of ser- vices provided by the Department. Results In particular the students appear to be fully satisfied with the Image-Fame of the Department and rather satisfied with the Program Study, Academic Staff and Administrative Services (Figure 2), with the exception of Tangibles (Equipment) which amounts to 64.1%. Initially a statistical analysis is performed to determine the variations obtained among the student’s judgments. Global student’s judgments, represented as frequencies, are given in Figure 1 where it appears that 50.5% of the student sample are “satisfied or rather satisfied” and 14.2% are “not satisfied or rather not satisfied”. In any case we can observe that there is enough space for improvement margins in the first four criteria since they are well below the mean satisfaction value (83.7) while the fifth criterion (Image-Fame) obtains a high satisfaction level which is mainly attributable to its dimensions that also enjoy high satisfaction levels and is related with the lower unemploy- ment rate that is observed for its graduates and generally the graduates of Technological Institutes in comparison with the graduates of other higher education institutes (Koilias et al., 2011). Furthermore, the student’s judgments in the main criteria of the research are displayed in Table 2 from where we can ob- serve that the criterion Image-Fame of the department shows the highest percentage 55.2% in the “satisfied or rather satis- fied” category and the lowest percentage 7.6% in the “not satis- fied or rather not satisfied” category. Inversion of the percent- ages appears to obtain the criterion Equipment (Tangibles) with the 37.7% “satisfied or rather satisfied” answers and almost 20% “not satisfied or rather not satisfied”. Should also be noted that a high percentage of students remain indifferent in all the Correspondent results are obtained for the rest criteria indexes where for the weights (Table 3) the students consider by Figure 1. Overall satisfaction frequencies. Table 2. Criteria satisfaction frequencies (%). Scale Criteria Satisfied Rather Satisfied Neither satisfy Nor dissatisfied Rather Dissatisfied Dissatisfied Program study 7.1 40.1 43.4 6.6 2.8 Academ ic staff 9.0 42.9 38.2 6.1 3.8 Equipment 4.7 33.0 42.5 15.1 4.7 Admin. Services 10.4 38.2 42.9 7.5 0.9 Image-Fame 11.3 43.9 37.3 7.1 0.5 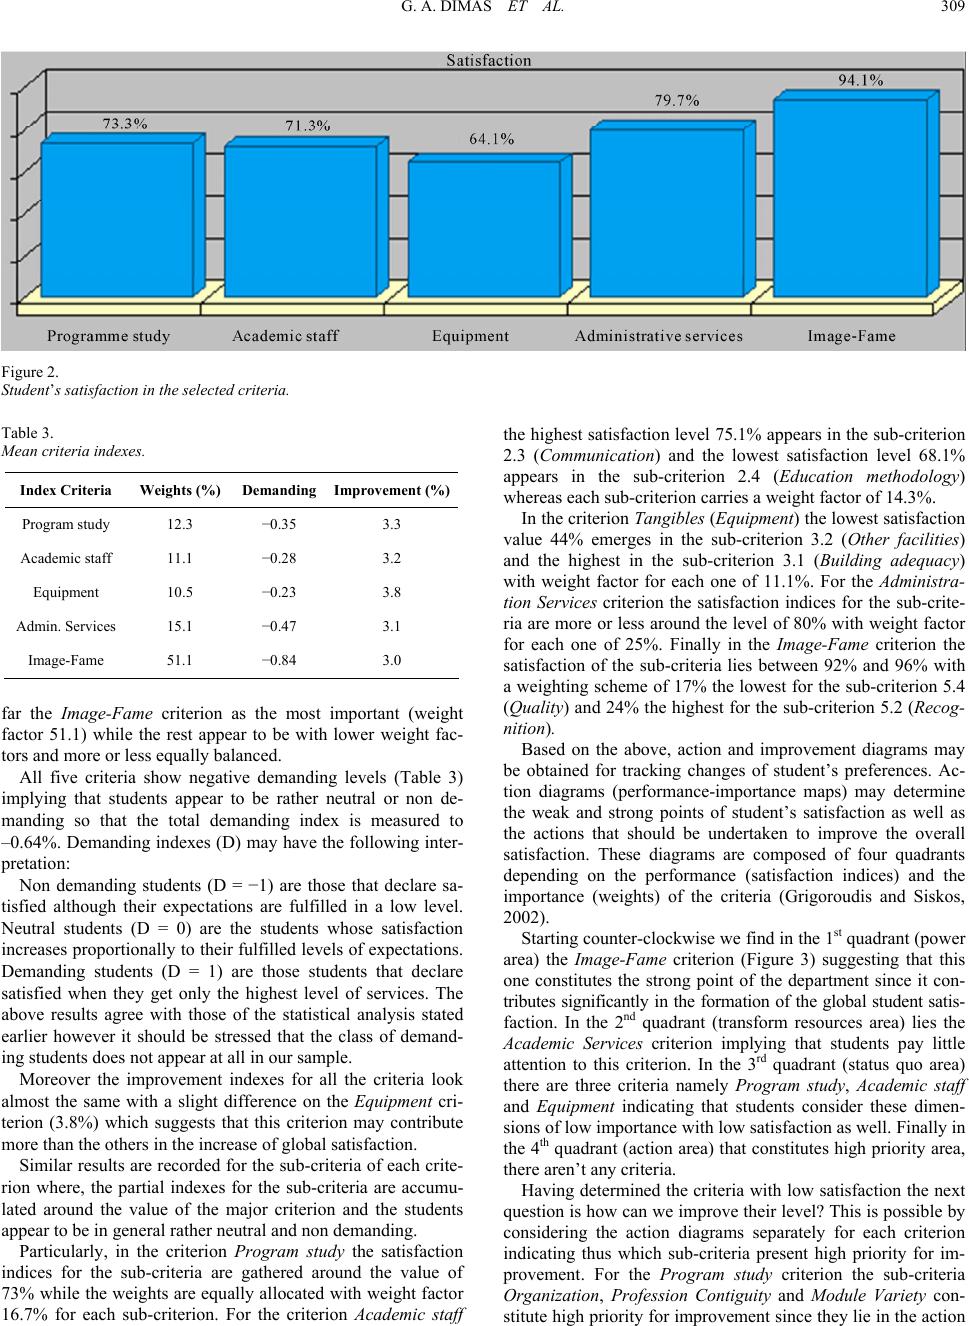 G. A. DIMAS ET AL. 309 Figure 2. Student’s satisfaction in the selected criteria. Table 3. Mean criteria indexes. Index Criteria Weights (%) Demanding Improvem ent (%) Program study 12.3 −0.35 3.3 Academic staff 11.1 −0.28 3.2 Equipment 10.5 −0.23 3.8 Admin. Services 15.1 −0.47 3.1 Image-Fame 51.1 −0.84 3.0 far the Image-Fame criterion as the most important (weight factor 51.1) while the rest appear to be with lower weight fac- tors and more or less equally balanced. All five criteria show negative demanding levels (Table 3) implying that students appear to be rather neutral or non de- manding so that the total demanding index is measured to –0.64%. Demanding indexes (D) may have the following inter- pretation: Non demanding students (D = −1) are those that declare sa- tisfied although their expectations are fulfilled in a low level. Neutral students (D = 0) are the students whose satisfaction increases proportionally to their fulfilled levels of expectations. Demanding students (D = 1) are those students that declare satisfied when they get only the highest level of services. The above results agree with those of the statistical analysis stated earlier however it should be stressed that the class of demand- ing students does not appear at all in our sample. Moreover the improvement indexes for all the criteria look almost the same with a slight difference on the Equipment cri- terion (3.8%) which suggests that this criterion may contribute more than the others in the increase of global satisfaction. Similar results are recorded for the sub-criteria of each crite- rion where, the partial indexes for the sub-criteria are accumu- lated around the value of the major criterion and the students appear to be in general rather neutral and non demanding. Particularly, in the criterion Program study the satisfaction indices for the sub-criteria are gathered around the value of 73% while the weights are equally allocated with weight factor 16.7% for each sub-criterion. For the criterion Academic staff the highest satisfaction level 75.1% appears in the sub-criterion 2.3 (Communication) and the lowest satisfaction level 68.1% appears in the sub-criterion 2.4 (Education methodology) whereas each sub-criterion carries a weight factor of 14.3%. In the criterion Tangibles (Equipment) the lowest satisfaction value 44% emerges in the sub-criterion 3.2 (Other facilities) and the highest in the sub-criterion 3.1 (Building adequacy) with weight factor for each one of 11.1%. For the Administra- tion Services criterion the satisfaction indices for the sub-crite- ria are more or less around the level of 80% with weight factor for each one of 25%. Finally in the Image-Fame criterion the satisfaction of the sub-criteria lies between 92% and 96% with a weighting scheme of 17% the lowest for the sub-criterion 5.4 (Quality) and 24% the highest for the sub-criterion 5.2 (Recog- nition). Based on the above, action and improvement diagrams may be obtained for tracking changes of student’s preferences. Ac- tion diagrams (performance-importance maps) may determine the weak and strong points of student’s satisfaction as well as the actions that should be undertaken to improve the overall satisfaction. These diagrams are composed of four quadrants depending on the performance (satisfaction indices) and the importance (weights) of the criteria (Grigoroudis and Siskos, 2002). Starting counter-clockwise we find in the 1st quadrant (power area) the Image-Fame criterion (Figure 3) suggesting that this one constitutes the strong point of the department since it con- tributes significantly in the formation of the global student satis- faction. In the 2nd quadrant (transform resources area) lies the Academic Services criterion implying that students pay little attention to this criterion. In the 3rd quadrant (status quo area) there are three criteria namely Program study, Academic staff and Equipment indicating that students consider these dimen- sions of low importance with low satisfaction as well. Finally in the 4th quadrant (action area) that constitutes high priority area, there aren’t any criteria. Having determined the criteria with low satisfaction the next question is how can we improve their level? This is possible by considering the action diagrams separately for each criterion indicating thus which sub-criteria present high priority for im- provement. For the Program study criterion the sub-criteria Organization, Profession Contiguity and Module Variety con- stitute high priority for improvement since they lie in the action 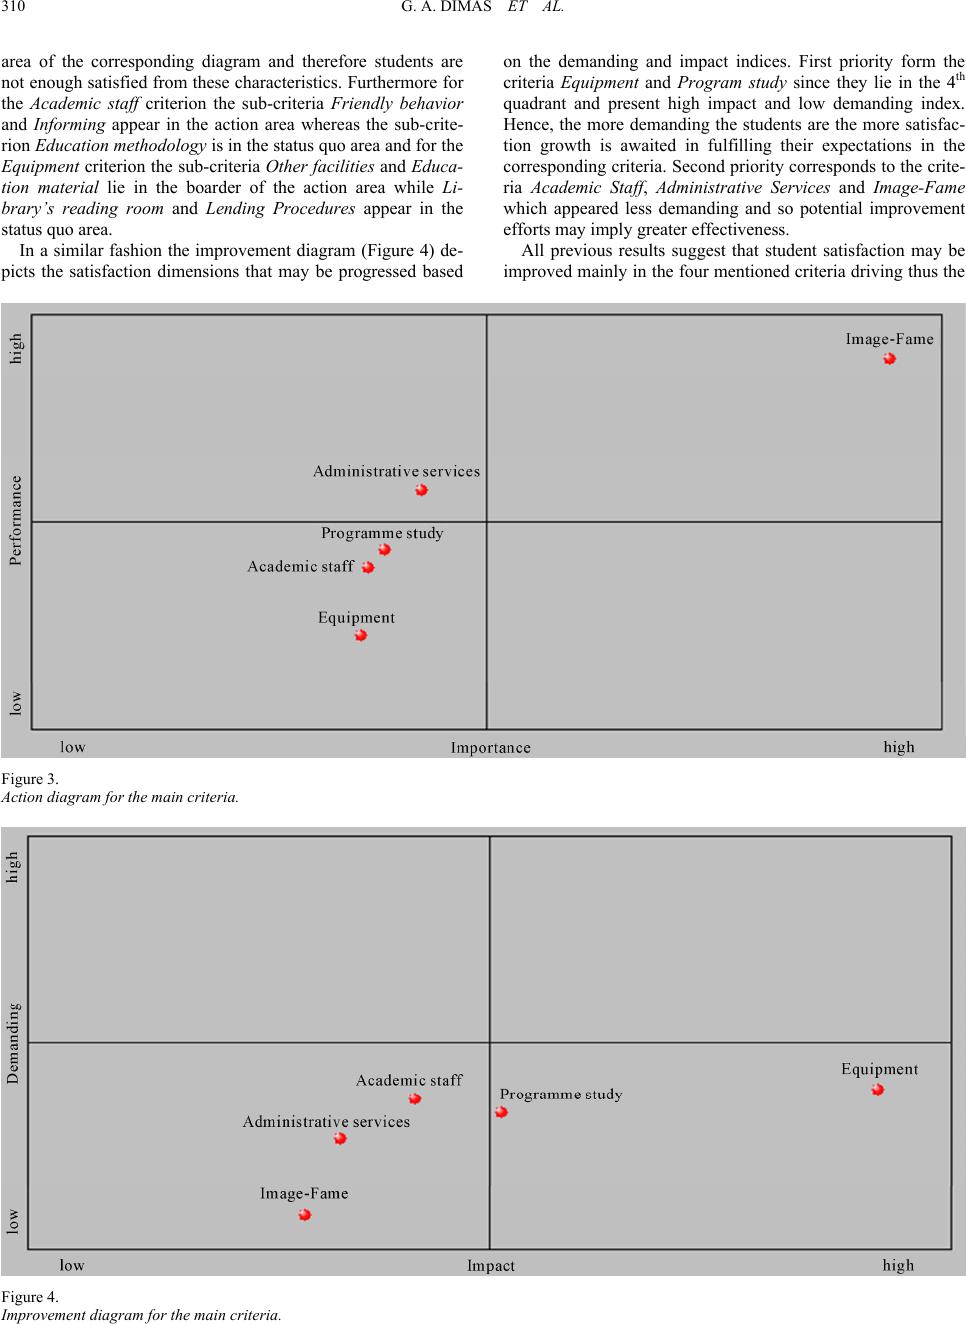 G. A. DIMAS ET AL. 310 area of the corresponding diagram and therefore students are not enough satisfied from these characteristics. Furthermore for the Academic staff criterion the sub-criteria Friendly behavior and Informing appear in the action area whereas the sub-crite- rion Education methodology is in the status quo area and for the Equipment criterion the sub-criteria Other facilities and Educa- tion material lie in the boarder of the action area while Li- brary’s reading room and Lending Procedures appear in the status quo area. In a similar fashion the improvement diagram (Figure 4) de- picts the satisfaction dimensions that may be progressed based on the demanding and impact indices. First priority form the criteria Equipment and Program study since they lie in the 4th quadrant and present high impact and low demanding index. Hence, the more demanding the students are the more satisfac- tion growth is awaited in fulfilling their expectations in the corresponding criteria. Second priority corresponds to the crite- ria Academic Staff, Administrative Services and Image-Fame which appeared less demanding and so potential improvement efforts may imply greater effectiveness. All previous results suggest that student satisfaction may be improved mainly in the four mentioned criteria driving thus the Figure 3. Action diagram for the main criteria. Figure 4. mprovement diagram fo r the main criteria. I 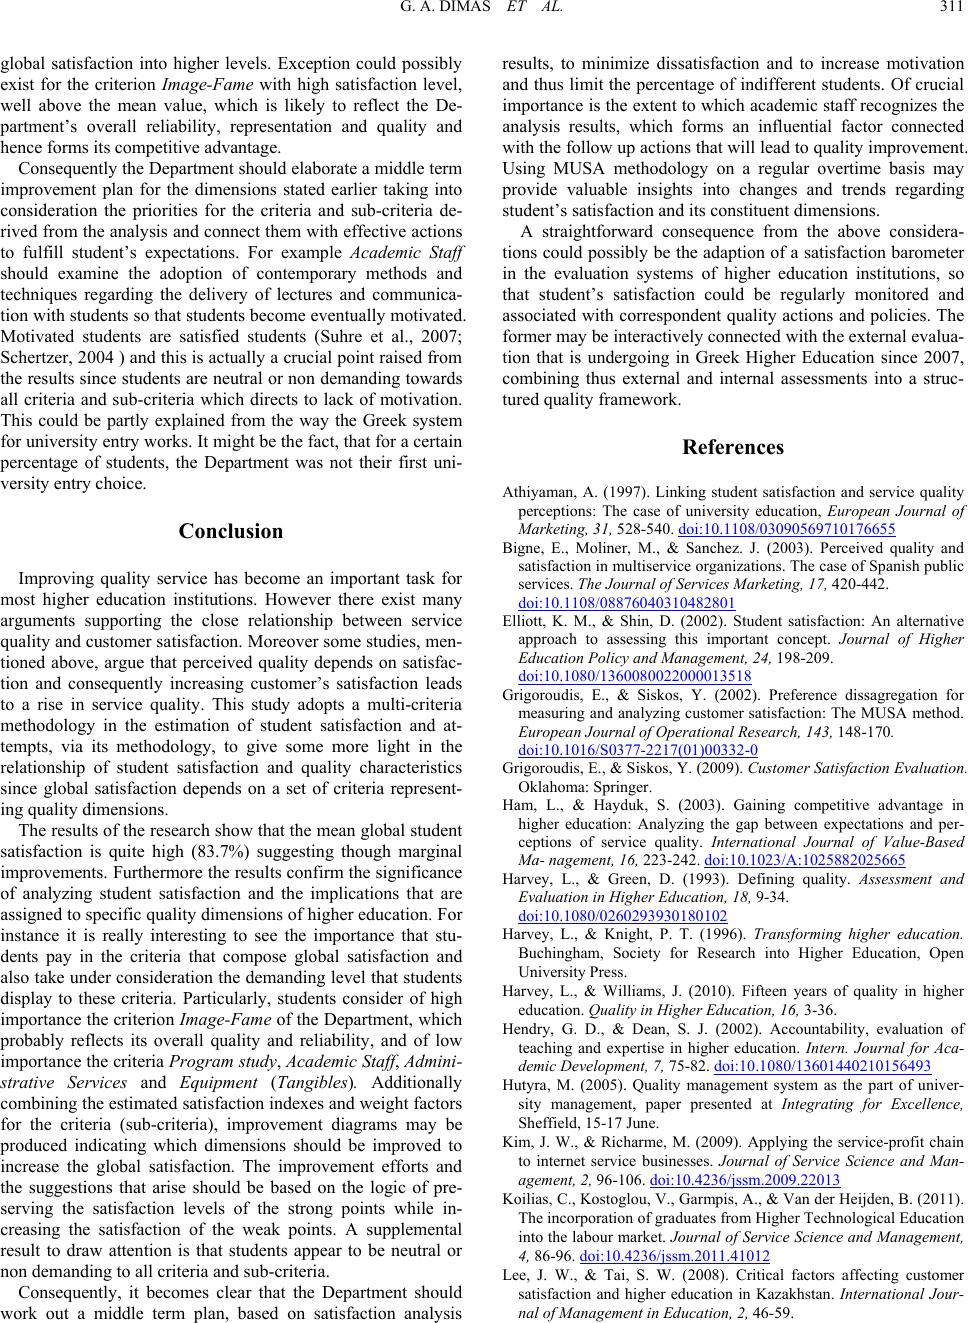 G. A. DIMAS ET AL. 311 global satisfaction into higher levels. Exception could possibly exist for the criterion Image-Fame with high satisfaction level, well above the mean value, which is likely to reflect the De- partment’s overall reliability, representation and quality and hence forms its competitive advantage. Consequently the Department should elaborate a middle term improvement plan for the dimensions stated earlier taking into consideration the priorities for the criteria and sub-criteria de- rived from the analysis and connect them with effective actions to fulfill student’s expectations. For example Academic Staff should examine the adoption of contemporary methods and techniques regarding the delivery of lectures and communica- tion with students so that students become eventually motivated. Motivated students are satisfied students (Suhre et al., 2007; Schertzer, 2004 ) and this is actually a crucial point raised from the results since students are neutral or non demanding towards all criteria and sub-criteria which directs to lack of motivation. This could be partly explained from the way the Greek system for university entry works. It might be the fact, that for a certain percentage of students, the Department was not their first uni- versity entry choice. Conclusion Improving quality service has become an important task for most higher education institutions. However there exist many arguments supporting the close relationship between service quality and customer satisfaction. Moreover some studies, men- tioned above, argue that perceived quality depends on satisfac- tion and consequently increasing customer’s satisfaction leads to a rise in service quality. This study adopts a multi-criteria methodology in the estimation of student satisfaction and at- tempts, via its methodology, to give some more light in the relationship of student satisfaction and quality characteristics since global satisfaction depends on a set of criteria represent- ing quality dimensions. The results of the research show that the mean global student satisfaction is quite high (83.7%) suggesting though marginal improvements. Furthermore the results confirm the significance of analyzing student satisfaction and the implications that are assigned to specific quality dimensions of higher education. For instance it is really interesting to see the importance that stu- dents pay in the criteria that compose global satisfaction and also take under consideration the demanding level that students display to these criteria. Particularly, students consider of high importance the criterion Image-Fame of the Department, which probably reflects its overall quality and reliability, and of low importance the criteria Program study, Academic Staff, Admini- strative Services and Equipment (Tangibles). Additionally combining the estimated satisfaction indexes and weight factors for the criteria (sub-criteria), improvement diagrams may be produced indicating which dimensions should be improved to increase the global satisfaction. The improvement efforts and the suggestions that arise should be based on the logic of pre- serving the satisfaction levels of the strong points while in- creasing the satisfaction of the weak points. A supplemental result to draw attention is that students appear to be neutral or non demanding to all criteria and sub-criteria. Consequently, it becomes clear that the Department should work out a middle term plan, based on satisfaction analysis results, to minimize dissatisfaction and to increase motivation and thus limit the percentage of indifferent students. Of crucial importance is the extent to which academic staff recognizes the analysis results, which forms an influential factor connected with the follow up actions that will lead to quality improvement. Using MUSA methodology on a regular overtime basis may provide valuable insights into changes and trends regarding student’s satisfaction and its constituent dimensions. A straightforward consequence from the above considera- tions could possibly be the adaption of a satisfaction barometer in the evaluation systems of higher education institutions, so that student’s satisfaction could be regularly monitored and associated with correspondent quality actions and policies. The former may be interactively connected with the external evalua- tion that is undergoing in Greek Higher Education since 2007, combining thus external and internal assessments into a struc- tured quality framework. References Athiyaman, A. (1997). Linking student satisfaction and service quality perceptions: The case of university education, European Journal of Marketing, 31, 528-540. doi:10.1108/03090569710176655 Bigne, E., Moliner, M., & Sanchez. J. (2003). Perceived quality and satisfaction in multiservice organizations. The case of Spanish public services. The Journal of Services Marketin g , 17, 420-442. doi:10.1108/08876040310482801 Elliott, K. M., & Shin, D. (2002). Student satisfaction: An alternative approach to assessing this important concept. Journal of Higher Education Policy and Manage m en t, 24, 198-209. doi:10.1080/1360080022000013518 Grigoroudis, E., & Siskos, Y. (2002). Preference dissagregation for measuring and analyzing customer satisfaction: The MUSA method. European Journal of Opera tio nal Research, 143, 148-170. doi:10.1016/S0377-2217(01)00332-0 Grigoroudis, E., & Siskos, Y. (2009). Customer Satisfaction Evaluation. Oklahoma: Springer. Ham, L., & Hayduk, S. (2003). Gaining competitive advantage in higher education: Analyzing the gap between expectations and per- ceptions of service quality. International Journal of Value-Based Ma- nagement, 16, 223-242. doi:10.1023/A:1025882025665 Harvey, L., & Green, D. (1993). Defining quality. Assessment and Evaluation in Higher E d uc at io n, 18, 9-34. doi:10.1080/0260293930180102 Harvey, L., & Knight, P. T. (1996). Transforming higher education. Buchingham, Society for Research into Higher Education, Open University Press. Harvey, L., & Williams, J. (2010). Fifteen years of quality in higher education. Quality in Higher Education, 16, 3-36. Hendry, G. D., & Dean, S. J. (2002). Accountability, evaluation of teaching and expertise in higher education. Intern. Journal for Aca- demic Development, 7, 75-82. doi:10.1080/13601440210156493 Hutyra, M. (2005). Quality management system as the part of univer- sity management, paper presented at Integrating for Excellence, Sheffield, 15-17 June. Kim, J. W., & Richarme, M. (2009). Applying the service-profit chain to internet service businesses. Journal of Service Science and Man- agement, 2, 96-106. doi:10.4236/jssm.2009.22013 Koilias, C., Kostoglou, V., Garmpis, A., & Van der Heijden, B. (2011). The incorporation of graduates from Higher Technological Education into the labour market. Journal of Service Science and Management, 4, 86-96. doi:10.4236/jssm.2011.41012 Lee, J. W., & Tai, S. W. (2008). Critical factors affecting customer satisfaction and higher education in Kazakhstan. International Jour- nal of Management in Education, 2, 46-59. 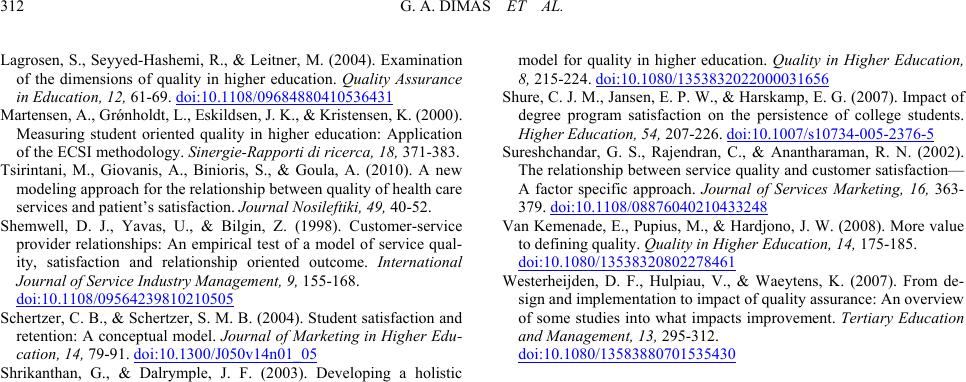 G. A. DIMAS ET AL. 312 Lagrosen, S., Seyyed-Hashemi, R., & Leitner, M. (2004). Examination of the dimensions of quality in higher education. Quality Assurance in Education, 12, 61-69. doi:10.1108/09684880410536431 Martensen, A., Grǿnholdt, L., Eskildsen, J. K., & Kristensen, K. (2000). Measuring student oriented quality in higher education: Application of the ECSI methodology. Sinergie-Rapporti di ricerca, 18, 371-383. Tsirintani, M., Giovanis, A., Binioris, S., & Goula, A. (2010). A new modeling approach for the relationship between quality of health care services and patient’s satisfaction. Journal Nosileftiki, 49, 40-52. Shemwell, D. J., Yavas, U., & Bilgin, Z. (1998). Customer-service provider relationships: An empirical test of a model of service qual- ity, satisfaction and relationship oriented outcome. International Journal of Service Indu stry Management, 9, 155-168. doi:10.1108/09564239810210505 Schertzer, C. B., & Schertzer, S. M. B. (2004). Student satisfaction and retention: A conceptual model. Journal of Marketing in Higher Edu- cation, 14, 79-91. doi:10.1300/J050v14n01_05 Shrikanthan, G., & Dalrymple, J. F. (2003). Developing a holistic model for quality in higher education. Quality in Higher Education, 8, 215-224. doi:10.1080/1353832022000031656 Shure, C. J. M., Jansen, E. P. W., & Harskamp, E. G. (2007). Impact of degree program satisfaction on the persistence of college students. Higher Education, 54, 207-226. doi:10.1007/s10734-005-2376-5 Sureshchandar, G. S., Rajendran, C., & Anantharaman, R. N. (2002). The relationship between service quality and customer satisfaction— A factor specific approach. Journal of Services Marketing, 16, 363- 379. doi:10.1108/08876040210433248 Van Kemenade, E., Pupius, M., & Hardjono, J. W. (2008). More value to defining quality. Quality in Higher Education, 14, 175-185. doi:10.1080/13538320802278461 Westerheijden, D. F., Hulpiau, V., & Waeytens, K. (2007). From de- sign and implementation to impact of quality assurance: An overview of some studies into what impacts improvement. Tertiary Education and Management, 13, 295-312. doi:10.1080/13583880701535430 |