

Paper Menu >>
Journal Menu >>
 Vol.2, No.3, 202-207 (201 1) doi:10.4236/jbpc.2011.23024 C opyright © 2011 SciRes. Openly accessible at http://www.scirp.org/journal/JBPC/ Journal of Biop hysical Chemistry A predictive kinetic model for inhibitory effect of nitrite on myeloperoxidase catalytic activity towards oxidation of chloride Yahya R. Tahboub1,2*, Mohammad M. Fares1 1Department of Applied Chemistry, Faculty of Science & Arts, Jordan University of Science and Technology, Irbid, Jordan; 2Department of Applied Chemistry, Faculty of Applied Sciences, Taibah University, Almadinah Almonawwarah, Saudi Arabia; *Corresponding Author: [email protected] Received 13 April 2011; revised 19 May 2011; accepted 2 June 2011. ABSTRACT Myeloperoxidase (MPO) is a neutrophil enzyme that employs hydrogen peroxide (H2O2) to cata- lyze the oxidation of chloride (Cl–) to hy- pochlorous acid (HOCl). Accepted mechanism is based on rapid reaction of native MPO with H2O2 to produce Compound I (MPO-I) which oxidizes Cl– through a 2e– transition generating MPO and HOCl. MPO-I also reacts with H2O2 to generate Compound II (MPO-II) which is inac- tive in 2e oxidation of Cl–. Nitrite (2 NO ) inhibits the 2e oxidation of Cl– by reaction with MPO-I through 1e transition generating MPO-II and nitrite radical. H2O2 consumption during stead y- state catalysis w as monitored amperometrically by a carbon fiber based H2O2-biosensor a t 25˚C. Results demonstrated that in absence of 2 NO reactions were monophasic and rapid (complete H2O2 consumption occurs in <10 s). As con- centration of 2 increases, reactions change to biphasic (rapid step followed by a slow step) and both steps have been inhibited by 2 NO NO . A predictive kinetic model describing the inhibit- tory effect of 2 was developed and applied to experimental results. The model is based on the assumption that MPO-I cannot be detected during steady-state catalysis. Calculated rate constants are in agreement w ith those obtained from pre-steady state kinetic methods. NO Keywords: MPO-Hydrogen Peroxide-Chloride System; Nitrite Inhibitor; 4 3 k 1. INTRODUCTION Myeloperoxidase (MPO) is a human peroxidase en- zyme and a lysosomal protein stored in azurophilic granules of the neutrophil. Its deficiency can severely cause quantitative or functional genetic disorder [1]. The major role of MPO is to aid in microbial killing. It oxidizes tyrosine to tyrosyl radical using hydrogen peroxide as oxidizing agent [2]. Furthermore, the MPO catalyzed production of HOCl from hydrogen peroxide (H2O2) and chloride ion (Cl), together with tyrosyl radical, are aimed at killing bacteria and other pathogens. The MPO-hydrogen peroxide-chloride system has been considered an important pathophysiologic factor in kidney disease [3], to enhance lipid oxidation in LDL in presence of SCN catalyst [4], to lead to oxidative dam- age of apolipoprotein A-I [5], to oxidizes free α-amino acids to aldehydes [6], leading to advanced glycation products present in human lesion material [7]. Vast range of inflammatory diseases was found to be correlated with products of MPO nitration of tyrosine residues. Myeloperoxidase can oxidize nitrite ions to an intermediate capable of nitrating tyrosine and tyrosyl residues in proteins [8-10]. The simplified mechanism that governs the catalytic activity of MPO can be represented by the classic per- oxidases catalytic cycle as follows: Chloride oxidation starts by rapid reaction of ground state MPO with H2O2 to form Compound I (MPO-I). Compound I is capable of oxidizing chloride (Cl) through a 2e transition generating the ground state MPO and hypochlorous acid (HOCl). During turnover, some MPO-I is converted to Compound (II) (MPO-II) by reaction with 1e donors such as nitrite (2 NO ) or (H2O2). As could be seen in equations 1 to 4 [11,12,17]. k , 4 2 k k , and 2 3 k k Ratios; Theoretical Kinetic Model 1 22 2 MPOH OMPO-IHO k (1)  Y. R. Tahboub et al. / Journal of Biophysical Chemistry 2 (2011) 202-207 Copyright © 2011 SciRes. Openly accessible at http://www.scirp.org/journal/JBPC/ 203203 2 2 MPO-I ClHMPOHOCl k (2) 3 2 MPO-I NOMPO-II NO k (3) 4 22 22 MPO-IH OMPO-IIH O k (4) MPO-II is believed to be inactive in chloride oxida- tion. The decay of MPO-II to ground state is considered as the rate-limiting step during steady-state catalysis [11,12]. Pre-steady-state and steady-state studies based on stopped-flow mixing and optical detection were em- ployed for studies of MPO-hydrogen peroxide-chloride system in presence and absence of nitrite [13,14]. In such studies, larger than physiological plasma concen- trations of MPO and/or 2 were employed to moni- tor measurable changes in absorbance at selected wave- lengths. Steady-state methods with amperometric moni- toring have advantages over optical methods. In such methods, the oxidation or reduction of a targeted reac- tant or product is directly monitored at the surface of a selective electrochemical biosensor. However, lack of biosensors with enough sensitivity, selectivity and short response time limited their role to initial rate measure- ments [13-17]. NO Recently, combination H2O2-biosensors with adequate sensitivity (2 pA/nM) and a relatively short response time (<2 s) were developed [18-20]. In a previous study [20], we employed a carbon fiber based H2O2-biosensor to study the effect of 2 NO on catalytic activity of MPO towards oxidation of chloride under respective physiological concentrations. Our re- sults confirmed the inhibitory nature of 2 NO . In this study, we utilized experimental data to develop a kinetic model capable of explaining the monophasic and bi- phasic phenomena. Additionally, 4 3 k k, 4 2 k k, and 2 3 k k ratios were estimated and the dependence of k1 on [Cl–] and [] was determined. 2 NO 2. EXPERIMENTAL 2.1. Reagents Chemicals used for preparation of buffer, stock and standard solutions were of analytical grade reagents and purchased from Sigma Chemical Co. (St. Louis, MO, USA). Phosphate buffer, 100 mM and pH 7.00, was prepared by mixing appropriate volumes of 0.10 M NaH2PO4 and 0.10 M Na2HPO4 to achieve pH 7.00. A 3.00 mM H2O2 solution was freshly prepared from stock solutions prepared by sequential dilutions from 30% H2O2 solution. Standard solutions of chlorides and 2 NO were prepared by sequential dilutions from their respec- tive sodium salts. All solutions were bubbled with high purity N2 gas before use. MPO was purified from human leukocytes [21-23]. A 30 μM MPO solution was freshly prepared by diluting measured amounts with buffer. 2.2. Electrochemical Measurements The Amperometric system consisted from an Apollo 4000 free radical analyzer, ISO-HPO-100 H2O2-biosen- sor and a thermostated measurement chamber (WPI, Sarasota, FL, USA). All experiments were performed at room temperature. For each experiment, 3.00 mL of 100 mM phosphate buffer solution containing 30 μM EDTA were placed in the measurement chamber. For effect of nitrite meas- urements, a 100 mM Cl– and varied concentrations of 2 NO (0 - 100) μM were pre-incubated with buffer solu- tion in the chamber. For effect of chloride measurements, a 100 μM 2 NO and varied concentrations of Cl– (0 - 100) mM were pre-incubated with buffer solution in the chamber. The electrode was immersed and magnetic stirrer was turned on at fixed moderate speed. Continu- ous amperometric monitoring started after addition of 30 μL H2O2 (10 μM). Reactions started with addition of 5.0 μL MPO solution (50 nM) and allowed to proceed until complete decay of initial current signal. H2O2 concentra- tions (μM) versus time (s) plots were obtained by setting the initial current signal to 10 μM H2O2 [19-20]. 3. RESULTS AND DIS CUS SION Due to its much higher concentration (100 - 140 mM) relative to other halides, chloride is assumed to be the physiological substrate for MPO. Time course H2O2- decay plots for MPO-catalyzed oxidation of Cl–, at a selected normal plasma level (100 mM), in presence of increasing 2 NO concentrations were studied by con- tinuous amperometric monitoring of H2O2 consumption (Figure 1) [20]. A monophasic plot prevails in absence of 2 NO (Figure 1(a)) which is demonstrated by a rapid consumption of H2O2. As 2 concentration increases, plots became biphasic and the rapid step is followed by a slower second step which is observed as an exponential decay of H2O2 signal (Figures 1(b)-(d)). The second step dominates at larger concentration (Figure 1(d)). NO 2 NO Further prevailing of second phase was observed, when Cl– was decreased in presence of 100 μM 2 NO (Figure 2). Both steps are observed in Figure 2(e) which is actually Figure 1(d). As Cl– concentration con- tinues to decrease, the second step is further extended and first step is disappeared. (Figures 2 (a)-(c)). Exten- sion of second step is accompanied by increase in reac- tion time. 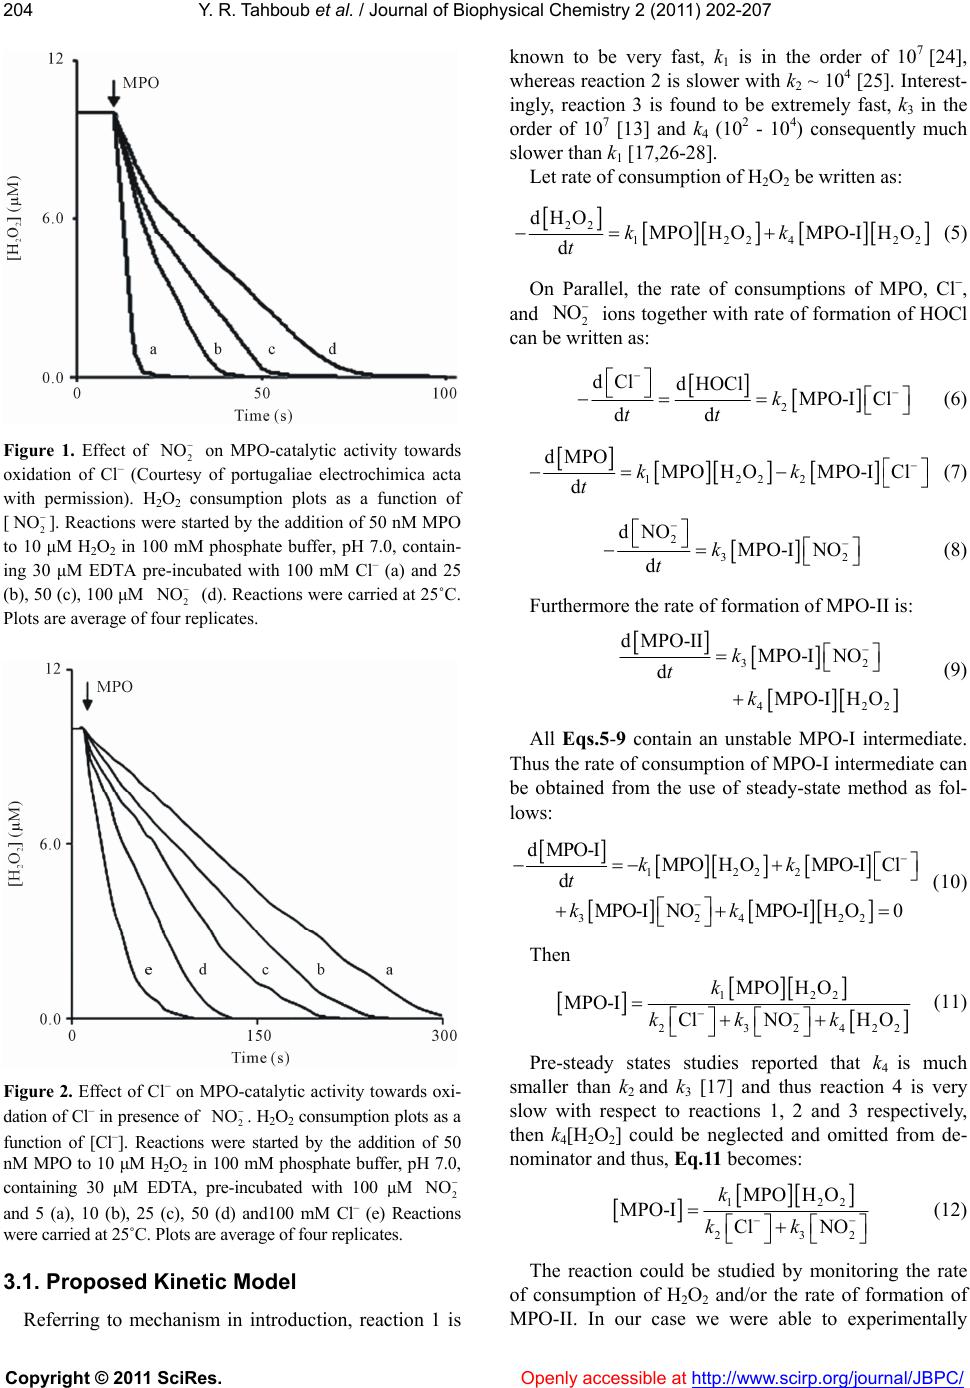 Y. R. Tahboub et al. / Journal of Biophysical Chemistry 2 (2011) 202-207 Copyright © 2011 SciRes. Openly accessible at http://www.scirp.org/journal/JBPC/ 204 Figure 1. Effect of on MPO-catalytic activity towards oxidation of Cl– (Courtesy of portugaliae electrochimica acta with permission). H2O2 consumption plots as a function of []. Reactions were started by the addition of 50 nM MPO to 10 μM H2O2 in 100 mM phosphate buffer, pH 7.0, contain- ing 30 μM EDTA pre-incubated with 100 mM Cl– (a) and 25 (b), 50 (c), 100 μM (d). Reactions were carried at 25˚C. Plots are average of four replicates. 2 NO 2 NO 2 NO Figure 2. Effect of Cl– on MPO-catalytic activity towards oxi- dation of Cl– in presence of . H2O2 consumption plots as a function of [Cl–]. Reactions were started by the addition of 50 nM MPO to 10 μM H2O2 in 100 mM phosphate buffer, pH 7.0, containing 30 μM EDTA, pre-incubated with 100 μM 2 NO 2 NO and 5 (a), 10 (b), 25 (c), 50 (d) and100 mM Cl– (e) Reactions were carried at 25˚C. Plots are average of four replicates. 3.1. Proposed Kinetic Model Referring to mechanism in introduction, reaction 1 is known to be very fast, k1 is in the order of 107 [24], whereas reaction 2 is slower with k2 ~ 104 [25]. Interest- ingly, reaction 3 is found to be extremely fast, k3 in the order of 107 [13] and k4 (102 - 104) consequently much slower than k1 [17,26-28]. Let rate of consumption of H2O2 be written as: 22 1224 2 dHO MPOH OMPO-IHO dkk t 2 (5) On Parallel, the rate of consumptions of MPO, Cl, and 2 NO ions together with rate of formation of HOCl can be written as: 2 dCl d HOClMPO-I Cl dd k tt (6) 1222 dMPO MPOH OMPO-ICl dkk t (7) 2 3 dNO MPO-INO dk t 2 (8) Furthermore the rate of formation of MPO-II is: 32 42 d MPO-IIMPO-I NO d MPO-IHO k t k 2 (9) All Eqs.5-9 contain an unstable MPO-I intermediate. Thus the rate of consumption of MPO-I intermediate can be obtained from the use of steady-state method as fol- lows: 1222 32422 dMPO-I MPOHOMPO-ICl d MPO-INOMPO-IHO0 kk t kk (10) Then 122 23242 MPOH O MPO-I ClNOH O k kk k 2 (11) Pre-steady states studies reported that k4 is much smaller than k2 and k3 [17] and thus reaction 4 is very slow with respect to reactions 1, 2 and 3 respectively, then k4[H2O2] could be neglected and omitted from de- nominator and thus, Eq.11 becomes: 12 23 MPOH O MPO-I Cl NO k kk 2 2 (12) The reaction could be studied by monitoring the rate of consumption of H2O2 and/or the rate of formation of MPO-II. In our case we were able to experimentally  Y. R. Tahboub et al. / Journal of Biophysical Chemistry 2 (2011) 202-207 Copyright © 2011 SciRes. Openly accessible at http://www.scirp.org/journal/JBPC/ 205205 monitor the rate of consumption of H2O2. Thus, substitu- tion of Eq.12 in Eq.5 yields the net rate of consumption of H2O2 through the entire reaction: 2 2241 22 122 23 First part Second part dHOMPO HO MPOH O dCl NO kk k tkk 2 (13) Eq.13 illustrates the rate change of consumption of H2O2 through time scale. At the very early time of reac- tion (first 10 s) fast drop of H2O2 signal was observed (first phase), indicating domination of first part which is attributed to no significant formation of MPO-II (en- zyme is swinging between MPO-1 and ground state MPO). Afterwards, and with presence of increasing concentrations of 2, part of MPO-I is reduced to MPO-II causing the enzyme to work under partial activ- ity (second phase) indicating domination of second part of Eq.13. NO Consequently, at the early time of the reaction, the rate of consumption of H2O2 depends only on the first part which is a second order reaction that depends en- tirely on initial concentrations of MPO and H2O2 and conclusively, the rate constant (k1) could be estimated from slope of curve. 22 12 dHO MPOH O dk t 2 (14) After the passage of few seconds (10 s), second phase is dominated and H2O2 consumption will follow the second part of Eq.13 which is observed as exponential decay of H2O2 signal (Figures 1(b)-(d)). The second part of Eq.13 introduces new variables such as [Cl–], [2] together with [MPO], [H2O2] and rate constant values k1, k2, k3 and k4 , that affect the rate of consump- tion of H2O2. Collectively, Eq.13 expresses a two-step sequential decay of H2O2 signal. NO By applying extreme values for 2 concentration in Eq.13 assuming that [2 NO NO ] = ∞, then [MPO] ap- proaches [MPO-II] and the rate of consumption of H2O2 will be zero indicating complete inhibition of reaction 2. Additionally if [2] = 0 then k3[2] = 0, and Eq.13 could still be used even in the absence of 2 NONO NO ions. Biphasic plots were observed for [Cl–] < 20 mM (data not shown). This confirms the solidarity and consistency of Eq.13 to present the rate of consumption of H2O2 in the presence of MPO, Cl and presence or absence of . 2 Furthermore Eq.13 is a separable differential equa- tion, which can re-write as: NO 2 22 22 22 dHO HO HO dAB t (15) where A and B are constants, and 1[MPO]Ak 41 23 [MPO] [Cl ][NO ] kk Bkk 2 . This differential equation can be solved by having different 22 dHO dt and [H2O2] values at increasing time and then by using ordinary differential computer program namely Mathematica, A and B values could be determined. The negative B value explains the decrease in the overall rate of consumption of H2O2 at prolonged time. This finding strengthen the discussion of the solidarity of Eq.13 to present the situa- tion, because it simply states that the second part of Eq.13 is the parameter responsible for the altering H2O2 consumption from a rapid step to a slower step. Finally, calculated B values were used to estimate the ratio of rate constants 2 3 k k, 4 3 k k and 4 2 k k values. Rate constant ratios are important, because they show the competi- tiveness of Cl– and 2 NO towards reaction with MPO-I, and further explain the slowness of reaction 4 relative to reactions 2 and 3. Ta bl e 1 and Figure 3 show the change of k1 values, deduced from Eq.14 with respect to changes in Cl concentrations. Furthermore, Ta bl e 2 and Figure 4 show the change of k1 value, deduced from Eq.14 with respect to changes in 2 NO concentrations. After the passage of 10 s, H2O2 consumption pattern changes entirely, where the second part of Eq .1 3 became the major factor. This factor introduces new parameters that affect the rate of consumption of H2O2 such as Cl, 2 NO and reaction 4. Mathematical salvation of Eq.15 at variant consump- tion rates of H2O2 versus H2O2 concentrations under variant chloride and nitrite concentrations (i.e. Tables 1 and 2) yielded A and B constant values, and conse- quently the determined B constant values were employed to estimate 4 3 k k, 4 2 k k and 2 3 k k ratios (Table 3). Rate constant ratios tell explicitly which reaction is faster or slower in the mechanism, and hence several conclusive remarks could be concluded from Table 3. Firstly, is that k3 is much larger than k2, which empha- sizes that the nitrite inhibition reaction 3 producing MPO-II, is faster than the catalyzing reaction 2 producing HOCl, (i.e. 3 2 k k= 1.15 × 10³), and that confirms the inhibition nature of 2 NO in the mechanism. Secondly, the previously assumed that 34 has been mathematically justified and it was also proven that k4 is very much smaller than k3 or k2. Finally, reaction 4 kk 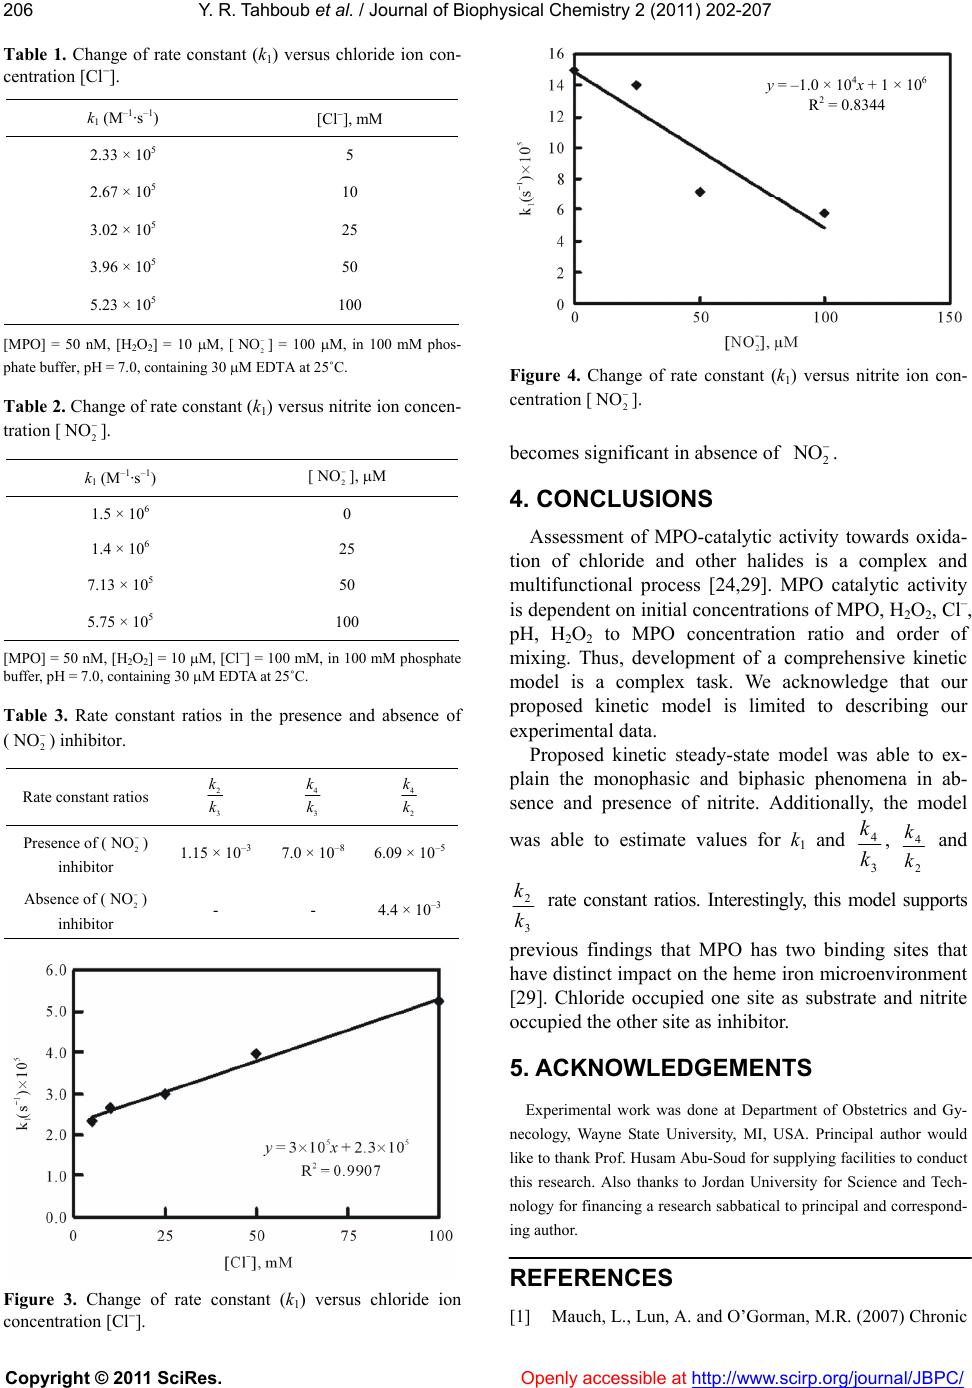 Y. R. Tahboub et al. / Journal of Biophysical Chemistry 2 (2011) 202-207 Copyright © 2011 SciRes. Openly accessible at http://www.scirp.org/journal/JBPC/ 206 Table 1. Change of rate constant (k1) versus chloride ion con- centration [Cl]. k1 (M–1·s–1) [Cl], mM 2.33 × 10⁵ 5 2.67 × 10⁵ 10 3.02 × 10⁵ 25 3.96 × 10⁵ 50 5.23 × 10⁵ 100 [MPO] = 50 nM, [H2O2] = 10 M, [] = 100 M, in 100 mM phos- phate buffer, pH = 7.0, containing 30 M EDTA at 25˚C. 2 NO Table 2. Change of rate constant (k1) versus nitrite ion concen- tration []. 2 NO k1 (M–1·s–1) [], M 2 NO 1.5 × 10⁶ 0 1.4 × 10⁶ 25 7.13 × 10⁵ 50 5.75 × 10⁵ 100 [MPO] = 50 nM, [H2O2] = 10 M, [Cl] = 100 mM, in 100 mM phosphate buffer, pH = 7.0, containing 30 M EDTA at 25˚C. Table 3. Rate constant ratios in the presence and absence of () inhibitor. 2 NO Rate constant ratios 2 3 k k 4 3 k k 4 2 k k Presence of () inhibitor 2 NO 1.15 × 10⁻³ 7.0 × 10⁻⁸ 6.09 × 10⁻⁵ Absence of () inhibitor 2 NO - - 4.4 × 10⁻³ Figure 3. Change of rate constant (k1) versus chloride ion concentration [Cl]. y = –1.0 × 10 4 x + 1 × 10 6 R 2 = 0.8344 Figure 4. Change of rate constant (k1) versus nitrite ion con- centration [2 NO ]. becomes significant in absence of . CONCLUSIONS alytic activity towards oxida- tio steady-state model was able to ex- pl 1 2 NO. 4 Assessment of MPO-cat n of chloride and other halides is a complex and multifunctional process [24,29]. MPO catalytic activity is dependent on initial concentrations of MPO, H2O2, Cl–, pH, H2O2 to MPO concentration ratio and order of mixing. Thus, development of a comprehensive kinetic model is a complex task. We acknowledge that our proposed kinetic model is limited to describing our experimental data. Proposed kinetic ain the monophasic and biphasic phenomena in ab- sence and presence of nitrite. Additionally, the model was able to estimate values for k and 3 4 k, k2 4 k k and 3 2 k k rate constant ratios. Interestingly, this model supports previous findings that MPO has two binding sites that 5. ACKNOWLEDGEMENTS Obstetrics and Gy- ne . and O’Gorman, M.R. (2007) Chronic have distinct impact on the heme iron microenvironment [29]. Chloride occupied one site as substrate and nitrite occupied the other site as inhibitor. Experimental work was done at Department of cology, Wayne State University, MI, USA. Principal author would like to thank Prof. Husam Abu-Soud for supplying facilities to conduct this research. Also thanks to Jordan University for Science and Tech- nology for financing a research sabbatical to principal and correspond- ing author. REFERENCES [1] Mauch, L., Lun, A 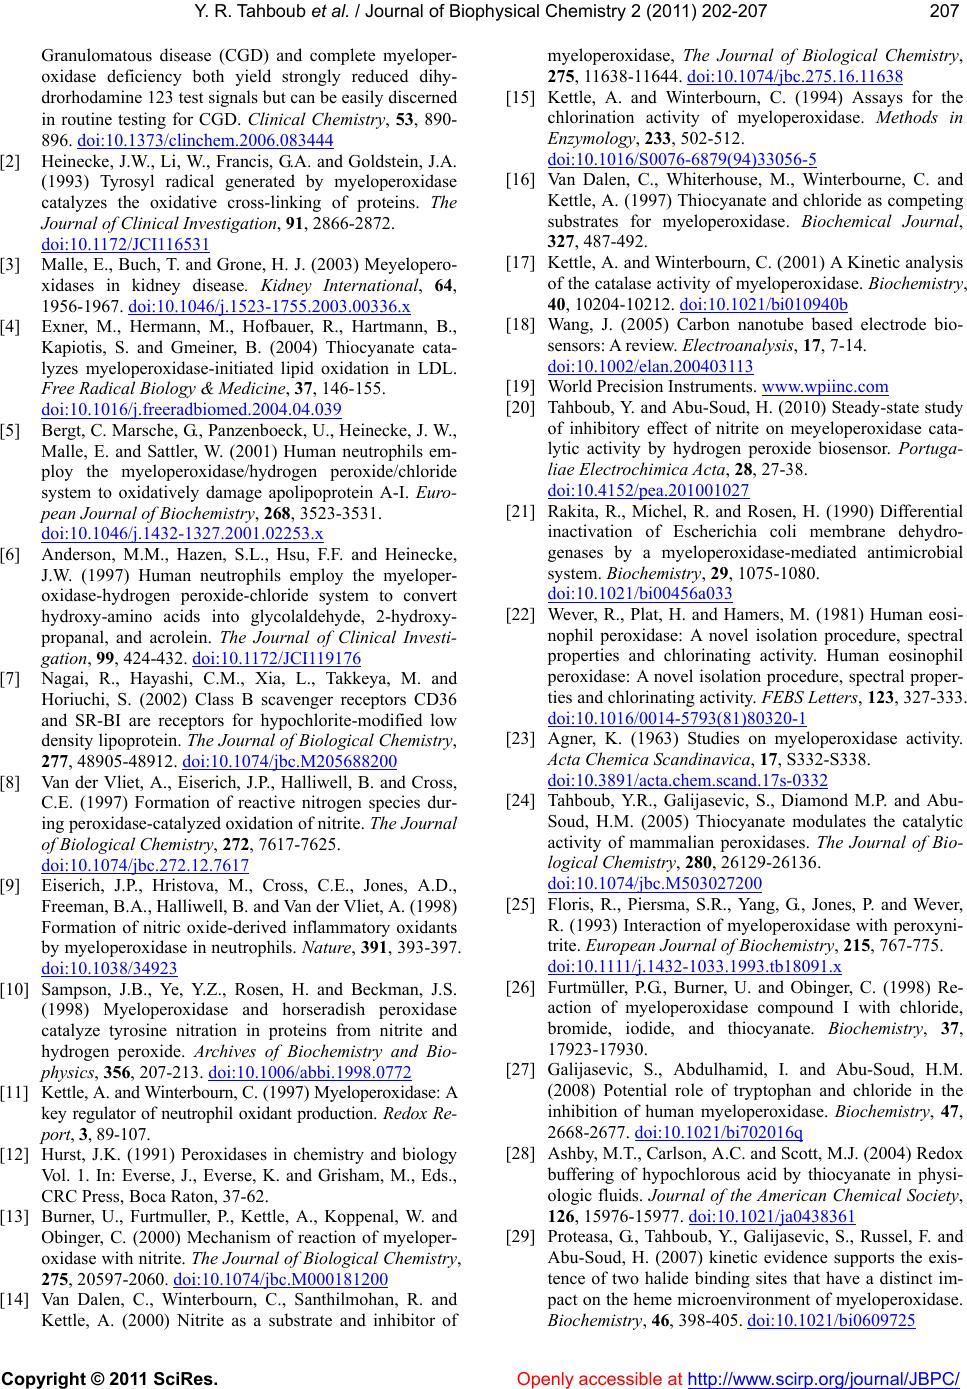 Y. R. Tahboub et al. / Journal of Biophysical Chemistry 2 (2011) 202-207 Copyright © 2011 SciRes. Openly accessible at http://www.scirp.org/journal/JBPC/ 207207 Granulomatous disease (CGD) and complete myeloper- oxidase deficiency both yield strongly reduced dihy- drorhodamine 123 test signals but can be easily discerned in routine testing for CGD. Clinical Chemistry, 53, 890- 896. doi:10.1373/clinchem.2006.083444 [2] Heinecke, J.W., Li, W., Francis, G.A. and Goldstein, J.A. (1993) Tyrosyl radical generated by myeloperoxidase catalyzes the oxidative cross-linking of proteins. The Journal of Clinical Investigation, 91, 2866-2872. doi:10.1172/JCI116531 [3] Malle, E., Buch, T. and Grone, H. J. (2003) Meyelopero- xidases in kidney disease. Kidney International, 64, 1956-1967. doi:10.1046/j.1523-1755.2003.00336.x [4] Exner, M., Hermann, M., Hofbauer, R., Hartmann, B., Kapiotis, S. and Gmeiner, B. (2004) Thiocyanate cata- lyzes myeloperoxidase-initiated lipid oxidation in LDL. Free Radical Biology & Medicine, 37, 146-155. doi:10.1016/j.freeradbiomed.2004.04.039 [5] Bergt, C. Marsche, G., Panzenboeck, U., Heinecke, J. W., Malle, E. and Sattler, W. (2001) Human neutrophils em- ploy the myeloperoxidase/hydrogen peroxide/chloride system to oxidatively damage apolipoprotein A-I. Euro- pean Journal of Biochemistry, 268, 3523-3531. doi:10.1046/j.1432-1327.2001.02253.x [6] Anderson, M.M., Hazen, S.L., Hsu, F.F. and Heinecke, J.W. (1997) Human neutrophils employ the myeloper- oxidase-hydrogen peroxide-chloride system to convert hydroxy-amino acids into glycolaldehyde, 2-hydroxy- propanal, and acrolein. The Journal of Clinical Investi- gation, 99, 424-432. doi:10.1172/JCI119176 [7] Nagai, R., Hayashi, C.M., Xia, L., Takkeya, M. and Horiuchi, S. (2002) Class B scavenger receptors CD36 and SR-BI are receptors for hypochlorite-modified low density lipoprotein. The Journal of Biological Chemistry, 277, 48905-48912. doi:10.1074/jbc.M205688200 [8] Van der Vliet, A., Eiserich, J.P., Halliwell, B. and Cross, C.E. (1997) Formation of reactive nitrogen species dur- ing peroxidase-catalyzed oxidation of nitrite. The Journal of Biological Chemistry, 272, 7617-7625. doi:10.1074/jbc.272.12.7617 [9] Eiserich, J.P., Hristova, M., Cross, C.E., Jones, A.D., Freeman, B.A., Halliwell, B. and Van der Vliet, A. (1998) Formation of nitric oxide-derived inflammatory oxidants by myeloperoxidase in neutrophils. Nature, 391, 393-397. doi:10.1038/34923 [10] Sampson, J.B., Ye, Y.Z., Rosen, H. and Beckman, J.S. (1998) Myeloperoxidase and horseradish peroxidase catalyze tyrosine nitration in proteins from nitrite and hydrogen peroxide. Archives of Biochemistry and Bio- physics, 356, 207-213. doi:10.1006/abbi.1998.0772 [11] Kettle, A. and Winterbourn, C. (1997) Myeloperoxidase: A key regulator of neutrophil oxidant production. Redox Re- port, 3, 89-107. [12] Hurst, J.K. (1991) Peroxidases in chemistry and biology e, A., Koppenal, W. and Vol. 1. In: Everse, J., Everse, K. and Grisham, M., Eds., CRC Press, Boca Raton, 37-62. [13] Burner, U., Furtmuller, P., Kettl Obinger, C. (2000) Mechanism of reaction of myeloper- oxidase with nitrite. The Journal of Biological Chemistry, 275, 20597-2060. doi:10.1074/jbc.M000181200 [14] Van Dalen, C., Winterbourn, C., Santhilmohan, R. and Kettle, A. (2000) Nitrite as a substrate and inhibitor of myeloperoxidase, The Journal of Biological Chemistry, 275, 11638-11644. doi:10.1074/jbc.275.16.11638 [15] Kettle, A. and Winterbourn, C. (1994) Assays for the 3056-5 chlorination activity of myeloperoxidase. Methods in Enzymology, 233, 502-512. doi:10.1016/S0076-6879(94)3 e, C. and interbourn, C. (2001) A Kinetic analysis [16] Van Dalen, C., Whiterhouse, M., Winterbourn Kettle, A. (1997) Thiocyanate and chloride as competing substrates for myeloperoxidase. Biochemical Journal, 327, 487-492. [17] Kettle, A. and W of the catalase activity of myeloperoxidase. Biochemistry, 40, 10204-10212. doi:10.1021/bi010940b [18] Wang, J. (2005) Carbon nanotube based electrode bio- sensors: A review. Electroanalysis, 17, 7-14. doi:10.1002/elan.200403113 [19] World Precision Instruments. www.wpiinc.com e study [20] Tahboub, Y. and Abu-Soud, H. (2010) Steady-stat of inhibitory effect of nitrite on meyeloperoxidase cata- lytic activity by hydrogen peroxide biosensor. Portuga- liae Electrochimica Acta, 28, 27-38. doi:10.4152/pea.201001027 [21] Rakita, R., Michel, R. and Rosen, H. (1990) Differential inactivation of Escherichia coli membrane dehydro- genases by a myeloperoxidase-mediated antimicrobial system. Biochemistry, 29, 1075-1080. doi:10.1021/bi00456a033 [22] Wever, R., Plat, H. and Hamers, M. (1981) Human eosi- nophil peroxidase: A novel isolation procedure, spectral properties and chlorinating activity. Human eosinophil peroxidase: A novel isolation procedure, spectral proper- ties and chlorinating activity. FEBS Letters, 123, 327-333. doi:10.1016/0014-5793(81)80320-1 [23] Agner, K. (1963) Studies on myeloperoxidase activity. Acta Chemica Scandinavica, 17, S332-S338. doi:10.3891/acta.chem.scand.17s-0332 [24] Tahboub, Y.R., Galijasevic, S., Diamond M.P. and Abu- Soud, H.M. (2005) Thiocyanate modulates the catalytic activity of mammalian peroxidases. The Journal of Bio- logical Chemistry, 280, 26129-26136. doi:10.1074/jbc.M503027200 [25] Floris, R., Piersma, S.R., Yang, G., Jones, P. and Wever, R. (1993) Interaction of myeloperoxidase with peroxyni- trite. European Journal of Biochemistry, 215, 767-775. d oi :1 0. 1111/ j. 14 32 -1033.1993.tb18091.x [26] Furtmüller, P.G., Burner, U. and Obinger, C. (1998) Re- , Abdulhamid, I. and Abu-Soud, H.M. action of myeloperoxidase compound I with chloride, bromide, iodide, and thiocyanate. Biochemistry, 37, 17923-17930. [27] Galijasevic, S. (2008) Potential role of tryptophan and chloride in the inhibition of human myeloperoxidase. Biochemistry, 47, 2668-2677. doi:10.1021/bi702016q [28] Ashby, M.T., Carlson, A.C. and Scott, M.J. (2004) Redox buffering of hypochlorous acid by thiocyanate in physi- ologic fluids. Journal of the American Chemical Society, 126, 15976-15977. doi:10.1021/ja0438361 [29] Proteasa, G., Tahboub, Y., Galijasevic, S., Russel, F. and Abu-Soud, H. (2007) kinetic evidence supports the exis- tence of two halide binding sites that have a distinct im- pact on the heme microenvironment of myeloperoxidase. Biochemistry, 46, 398-405. doi:10.1021/bi0609725 |