Paper Menu >>
Journal Menu >>
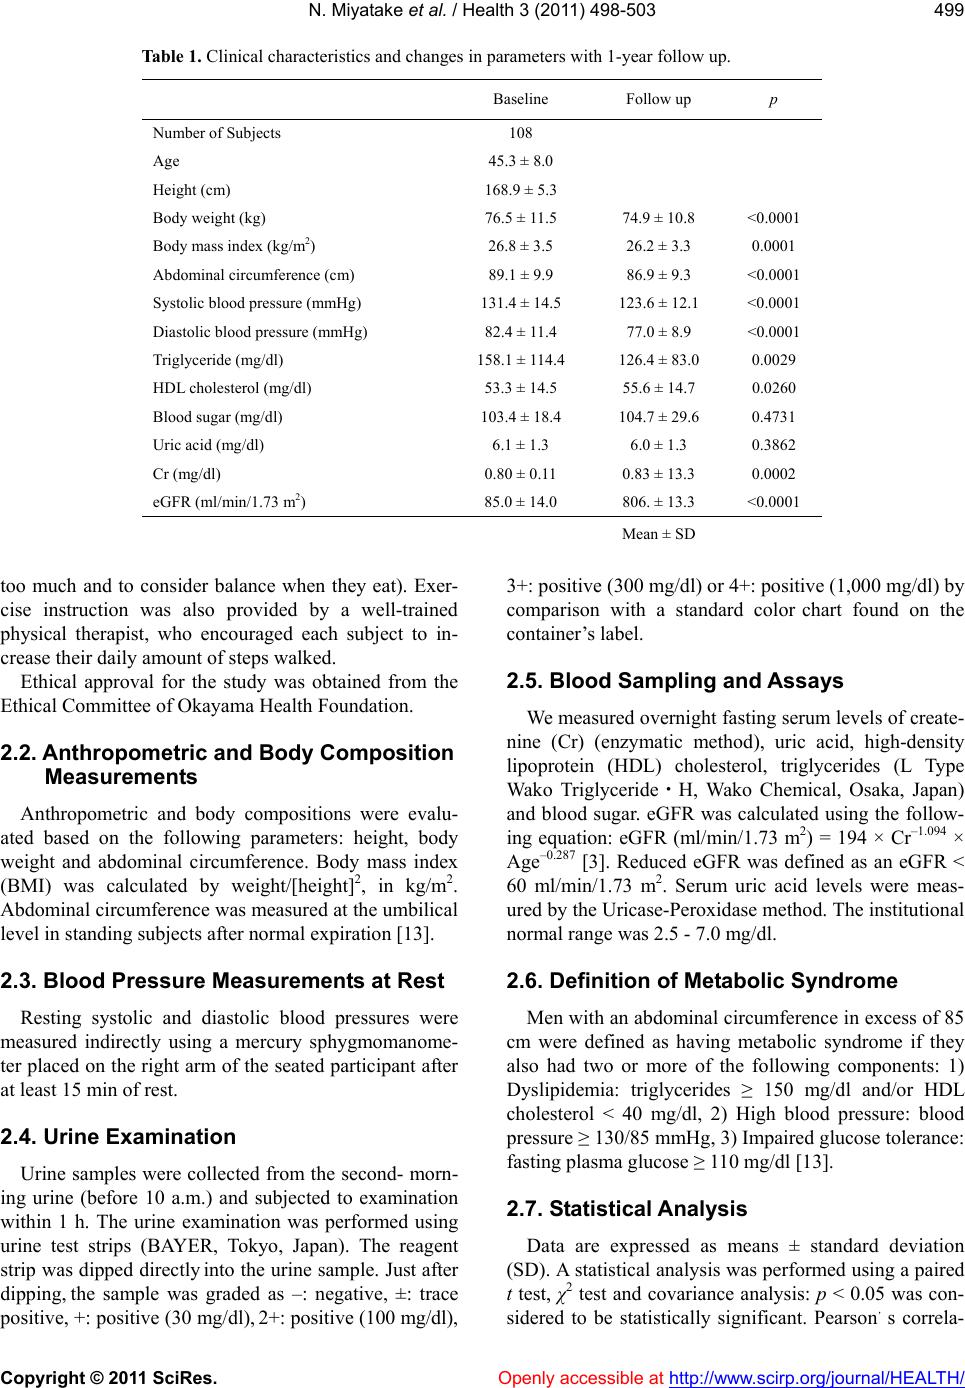
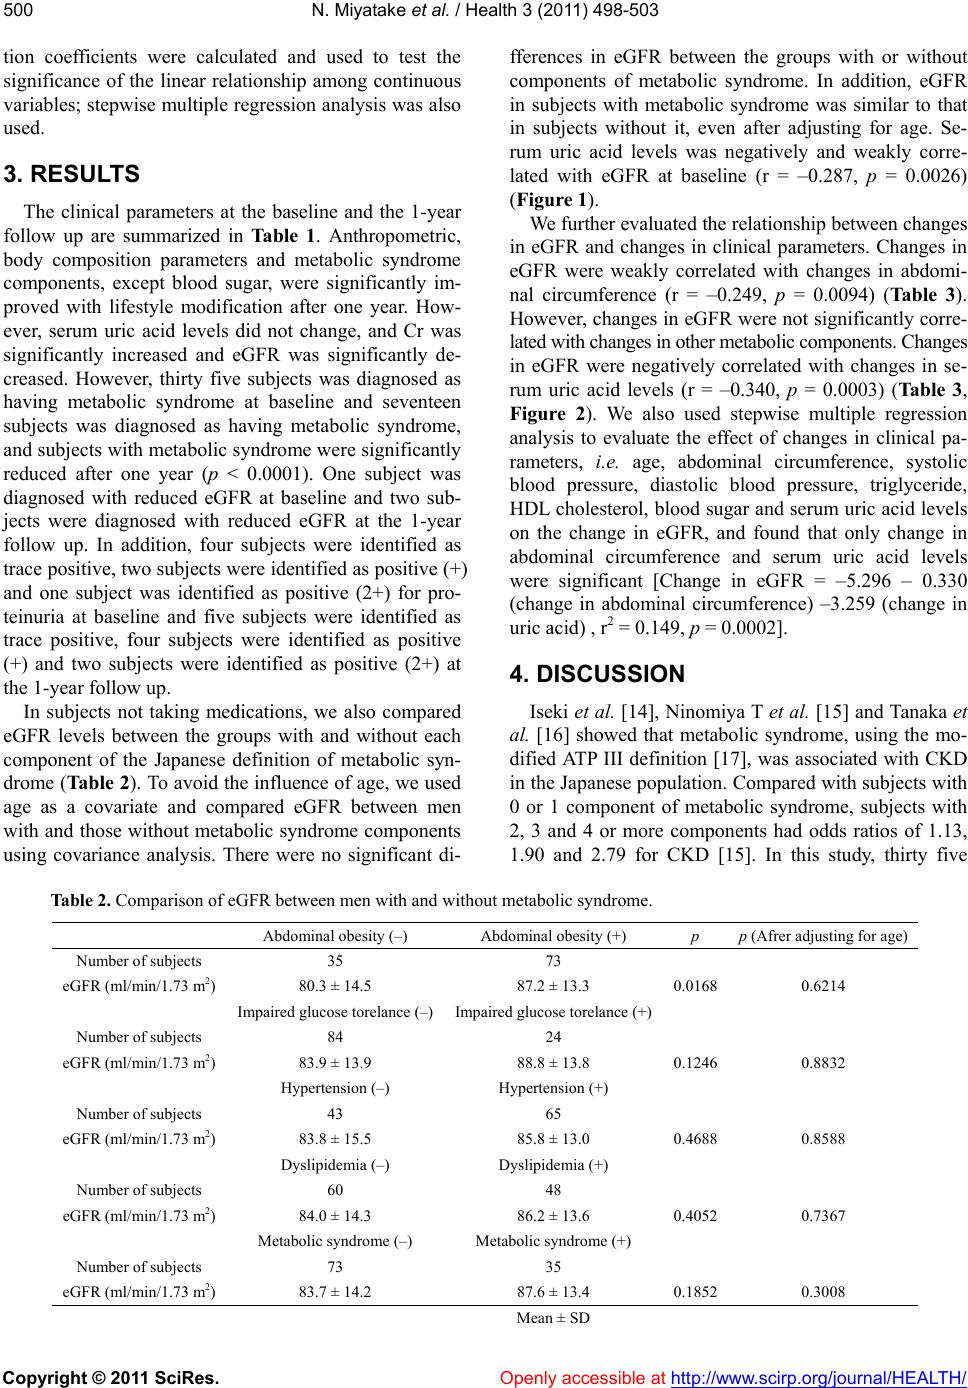
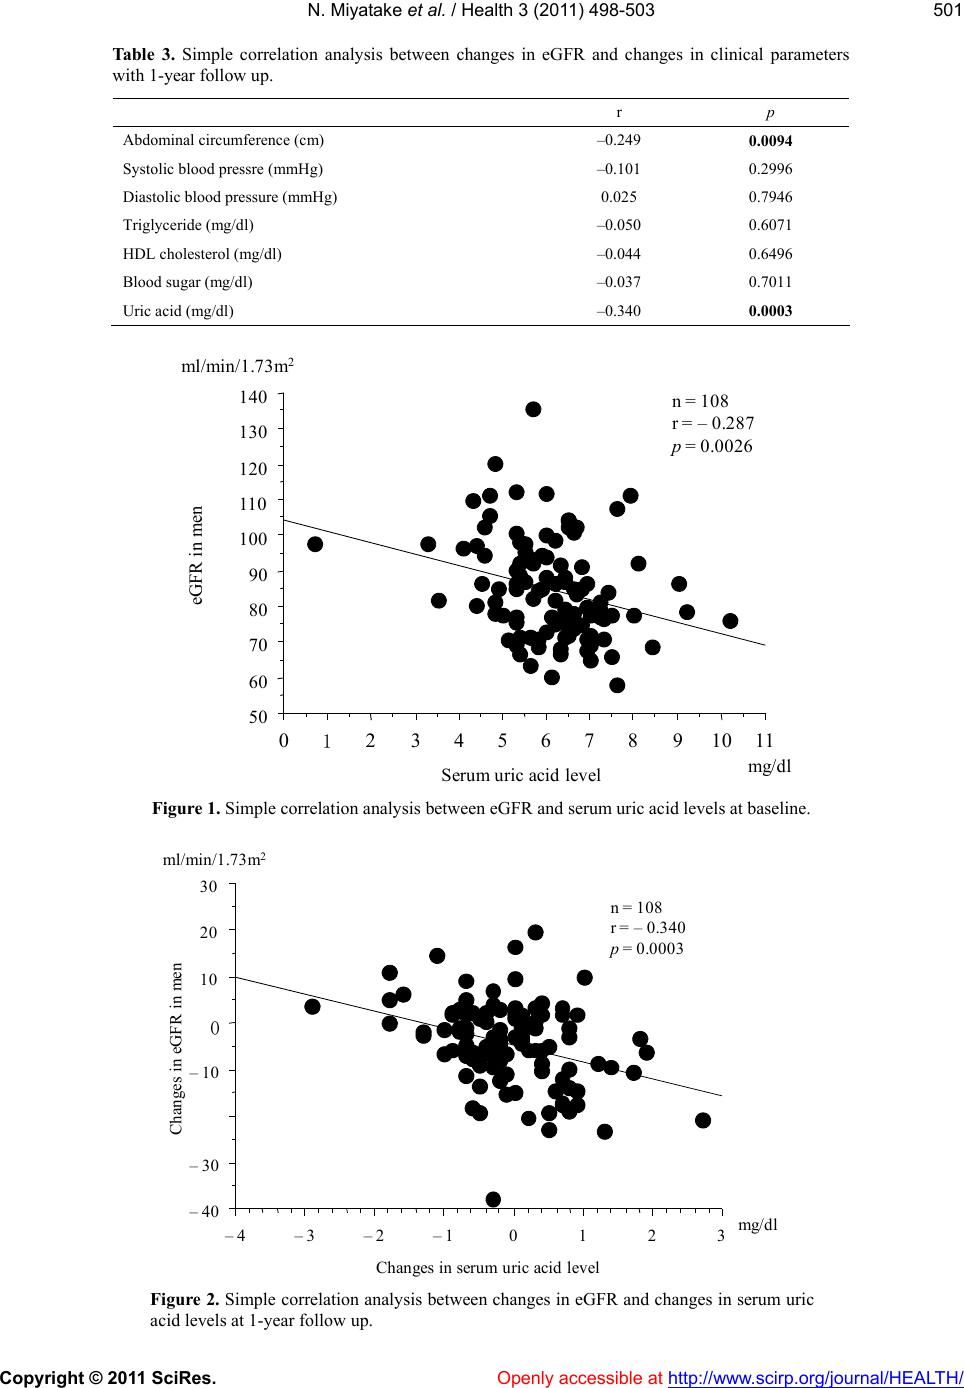
![]() Vol.3, No.8, 498-503 (2011) doi:10.4236/health.2011.38082 Copyright © 2011 SciRes. Openly accessible at http://www.scirp.org/journal/HEALTH/ Health Decreasing serum uric acid levels might be associated with improving estimated glomerular filtration rate (eGFR) in Japanese men No buyuki Miyatake1*, Kenichi Shikata2,3, Hirofumi Makino3, Takeyuki Numata4 1Department of Hygiene, Faculty of Medicine, Kagawa University, Kagawa, Japan; *Corresponding Autor: [email protected] 2Center for Innovative Medicine, Okayama University Hospital, Okayama, Japan; 3Department of Medicine and Clinical Science, Okayama University Graduate School of Medicine, Dentistry and Pharmaceutical Sciences, Okayama, Japan; 4Okayama Southern Institute of Health, Okayama Health Foundation, Okayama, Japan. Received 8 June 2011; revised 20 July; accepted 31 July 2011. ABSTRACT The link between changes in a subject’s serum uric acid levels and his estimated glomerular filtration rate (eGFR) was evaluated in Japanese men. We used data for 108 Japanese men (45.3 ± 8.0 years) with a 1-year follow up. eGFR was defined by a new equation developed for Japan. eGFR was weakly correlated with serum uric acid levels (r = –0.287, p = 0.0026) at baseline. Subjects were given advice for dietary and life- style improvement. At the 1-year follow up, al- most metabolic syndrome components were significantly improved. However, blood sugar and uric acid did not change and eGFR was significantly decreased. The changes in eGFR were weakly correlated with abdominal circum- ference (r = –0.249, p = 0.0094) and uric acid (r = –0.340, p = 0.0003). A decrease in serum uric acid levels may be associated with improving eGFR in Japanese men. Keywords: Abdominal Circumference; Uric Acid; Estimated Glomerular Filtration Rate (eGFR); Metabolic Syndrome; Lifestyle Modification 1. INTRODUCTION Chronic kidney disease (CKD) has become a public health challenge and is a common disorder [1]. For ex- ample, about 20% of adults have CKD, which is defined as kidney damage or a glomerular filtration rate (GFR) <60 ml/min/1.73 m2 for at least three months regardless of cause [2]. We have also previously reported in a cross-sectional study that the estimated glomerular fil- tration rate (eGFR) [3] in men with abdominal obesity and in women with hypertension was significantly lower than that in subjects without these components of meta- bolic syndrome [4]. In addition, we also showed that decreasing abdominal circumference in men and de- creasing systolic blood pressure in women were associ- ated with improving eGFR with lifestyle modification [5, 6]. In turn, there some reports according to the link be- tween serum uric acid levels and CKD in foreign coun- tries [7-12]. However, whether decreases in serum uric acid levels are beneficial for improving eGFR, and what affects this has on eGFR remain to be investigated in a longitudinal study in Japanese men. In this study, we evaluate the link between changes in eGFR and changes in serum uric acid levels in Japanese men with a 1-year follow up. 2. SUBJECTS AND METHODS 2.1. Subjects We used data for 108 Japanese men, aged 45.3 ± 8.0 years, who met the following criteria: 1) received a health check-up including special health guidance and a follow-up check-up 1-year later, 2) received anthropo- metric measurements, fasting blood examination includ- ing serum uric acid levels and blood pressure measure- ments as part of the annual health check-up, 3) received no medications for diabetes, hypertension, and/or dysli- pidemia, and 4) provided written informed consent (Ta- ble 1). At the first health check-up, all subjects were given instructions by well-trained medical staff on how to change their lifestyle as special health guidance. Nutri- tional instruction was provided with a well-trained nutri- tionist, who planned a diet for each subject based on their data and provided simple instructions (i.e. not to eat ![]() N. Miyatake et al. / Health 3 (2011) 498-503 Copyright © 2011 SciRes. Openly accessible at http://www.scirp.org/journal/HEALTH/ 499 Table 1. Clinical characteristics and changes in parameters with 1-year follow up. Baseline Follow up p Number of Subjects 108 Age 45.3 ± 8.0 Height (cm) 168.9 ± 5.3 Body weight (kg) 76.5 ± 11.5 74.9 ± 10.8 <0.0001 Body mass index (kg/m2) 26.8 ± 3.5 26.2 ± 3.3 0.0001 Abdominal circumference (cm) 89.1 ± 9.9 86.9 ± 9.3 <0.0001 Systolic blood pressure (mmHg) 131.4 ± 14.5 123.6 ± 12.1 <0.0001 Diastolic blood pressure (mmHg) 82.4 ± 11.4 77.0 ± 8.9 <0.0001 Triglyceride (mg/dl) 158.1 ± 114.4 126.4 ± 83.0 0.0029 HDL cholesterol (mg/dl) 53.3 ± 14.5 55.6 ± 14.7 0.0260 Blood sugar (mg/dl) 103.4 ± 18.4 104.7 ± 29.6 0.4731 Uric acid (mg/dl) 6.1 ± 1.3 6.0 ± 1.3 0.3862 Cr (mg/dl) 0.80 ± 0.11 0.83 ± 13.3 0.0002 eGFR (ml/min/1.73 m2) 85.0 ± 14.0 806. ± 13.3 <0.0001 Mean ± SD too much and to consider balance when they eat). Exer- cise instruction was also provided by a well-trained physical therapist, who encouraged each subject to in- crease their daily amount of steps walked. Ethical approval for the study was obtained from the Ethical Committee of Okayama Health Foundation. 2.2. Anthropometric and Body Composition Measurements Anthropometric and body compositions were evalu- ated based on the following parameters: height, body weight and abdominal circumference. Body mass index (BMI) was calculated by weight/[height]2, in kg/m2. Abdominal circumference was measured at the umbilical level in standing subjects after normal expiration [13]. 2.3. Blood Pressure Measurements at Rest Resting systolic and diastolic blood pressures were measured indirectly using a mercury sphygmomanome- ter placed on the right arm of the seated participant after at least 15 min of rest. 2.4. Urine Examination Urine samples were collected from the second- morn- ing urine (before 10 a.m.) and subjected to examination within 1 h. The urine examination was performed using urine test strips (BAYER, Tokyo, Japan). The reagent strip was dipped directly into the urine sample. Just after dipping, the sample was graded as –: negative, ±: trace positive, +: positive (30 mg/dl), 2+: positive (100 mg/dl), 3+: positive (300 mg/dl) or 4+: positive (1,000 mg/dl) by comparison with a standard color chart found on the container’s label. 2.5. Blood Sampling and Assays We measured overnight fasting serum levels of create- nine (Cr) (enzymatic method), uric acid, high-density lipoprotein (HDL) cholesterol, triglycerides (L Type Wako Triglyceride・H, Wako Chemical, Osaka, Japan) and blood sugar. eGFR was calculated using the follow- ing equation: eGFR (ml/min/1.73 m2) = 194 × Cr–1.094 × Age–0.287 [3]. Reduced eGFR was defined as an eGFR < 60 ml/min/1.73 m2. Serum uric acid levels were meas- ured by the Uricase-Peroxidase method. The institutional normal range was 2.5 - 7.0 mg/dl. 2.6. Definition of Metabolic Syndrome Men with an abdominal circumference in excess of 85 cm were defined as having metabolic syndrome if they also had two or more of the following components: 1) Dyslipidemia: triglycerides ≥ 150 mg/dl and/or HDL cholesterol < 40 mg/dl, 2) High blood pressure: blood pressure ≥ 130/85 mmHg, 3) Impaired glucose tolerance: fasting plasma glucose ≥ 110 mg/dl [13]. 2.7. Statistical Analysis Data are expressed as means ± standard deviation (SD). A statistical analysis was performed using a paired t test, χ2 test and covariance analysis: p < 0.05 was con- sidered to be statistically significant. Pearson,s correla- ![]() N. Miyatake et al. / Health 3 (2011) 498-503 Copyright © 2011 SciRes. Openly accessible at http://www.scirp.org/journal/HEALTH/ 500 tion coefficients were calculated and used to test the significance of the linear relationship among continuous variables; stepwise multiple regression analysis was also used. 3. RESULTS The clinical parameters at the baseline and the 1-year follow up are summarized in Tab le 1 . Anthropometric, body composition parameters and metabolic syndrome components, except blood sugar, were significantly im- proved with lifestyle modification after one year. How- ever, serum uric acid levels did not change, and Cr was significantly increased and eGFR was significantly de- creased. However, thirty five subjects was diagnosed as having metabolic syndrome at baseline and seventeen subjects was diagnosed as having metabolic syndrome, and subjects with metabolic syndrome were significantly reduced after one year (p < 0.0001). One subject was diagnosed with reduced eGFR at baseline and two sub- jects were diagnosed with reduced eGFR at the 1-year follow up. In addition, four subjects were identified as trace positive, two subjects were identified as positive (+) and one subject was identified as positive (2+) for pro- teinuria at baseline and five subjects were identified as trace positive, four subjects were identified as positive (+) and two subjects were identified as positive (2+) at the 1-year follow up. In subjects not taking medications, we also compared eGFR levels between the groups with and without each component of the Japanese definition of metabolic syn- drome (Tabl e 2). To avoid the influence of age, we used age as a covariate and compared eGFR between men with and those without metabolic syndrome components using covariance analysis. There were no significant di- fferences in eGFR between the groups with or without components of metabolic syndrome. In addition, eGFR in subjects with metabolic syndrome was similar to that in subjects without it, even after adjusting for age. Se- rum uric acid levels was negatively and weakly corre- lated with eGFR at baseline (r = –0.287, p = 0.0026) (Figure 1). We further evaluated the relationship between changes in eGFR and changes in clinical parameters. Changes in eGFR were weakly correlated with changes in abdomi- nal circumference (r = –0.249, p = 0.0094) (Table 3). However, changes in eGFR were not significantly corre- lated with changes in other metabolic components. Changes in eGFR were negatively correlated with changes in se- rum uric acid levels (r = –0.340, p = 0.0003) (Ta b l e 3 , Figure 2). We also used stepwise multiple regression analysis to evaluate the effect of changes in clinical pa- rameters, i.e. age, abdominal circumference, systolic blood pressure, diastolic blood pressure, triglyceride, HDL cholesterol, blood sugar and serum uric acid levels on the change in eGFR, and found that only change in abdominal circumference and serum uric acid levels were significant [Change in eGFR = –5.296 – 0.330 (change in abdominal circumference) –3.259 (change in uric acid) , r2 = 0.149, p = 0.0002]. 4. DISCUSSION Iseki et al. [14], Ninomiya T et al. [15] and Tanaka et al. [16] showed that metabolic syndrome, using the mo- dified ATP III definition [17], was associated with CKD in the Japanese population. Compared with subjects with 0 or 1 component of metabolic syndrome, subjects with 2, 3 and 4 or more components had odds ratios of 1.13, 1.90 and 2.79 for CKD [15]. In this study, thirty five Table 2. Comparison of eGFR between men with and without metabolic syndrome. Abdominal obesity (–) Abdominal obesity (+) p p (Afrer adjusting for age) Number of subjects 35 73 eGFR (ml/min/1.73 m2) 80.3 ± 14.5 87.2 ± 13.3 0.01680.6214 Impaired glucose torelance (–)Impaired glucose torelance (+) Number of subjects 84 24 eGFR (ml/min/1.73 m2) 83.9 ± 13.9 88.8 ± 13.8 0.12460.8832 Hypertension (–) Hypertension (+) Number of subjects 43 65 eGFR (ml/min/1.73 m2) 83.8 ± 15.5 85.8 ± 13.0 0.46880.8588 Dyslipidemia (–) Dyslipidemia (+) Number of subjects 60 48 eGFR (ml/min/1.73 m2) 84.0 ± 14.3 86.2 ± 13.6 0.40520.7367 Metabolic syndrome (–) Metabolic syndrome (+) Number of subjects 73 35 eGFR (ml/min/1.73 m2) 83.7 ± 14.2 87.6 ± 13.4 0.18520.3008 Mean ± SD ![]() N. Miyatake et al. / Health 3 (2011) 498-503 Copyright © 2011 SciRes. Openly accessible at http://www.scirp.org/journal/HEALTH/ 501 Table 3. Simple correlation analysis between changes in eGFR and changes in clinical parameters with 1-year follow up. r p Abdominal circumference (cm) –0.249 0.0094 Systolic blood pressre (mmHg) –0.101 0.2996 Diastolic blood pressure (mmHg) 0.025 0.7946 Triglyceride (mg/dl) –0.050 0.6071 HDL cholesterol (mg/dl) –0.044 0.6496 Blood sugar (mg/dl) –0.037 0.7011 Uric acid (mg/dl) –0.340 0.0003 ml/min/ 1 .73 m2 eGFRin men Serum uric acid levelmg/dl n = 108 r = –0.287 p = 0.0026 50 60 70 80 90 100 110 120 130 140 0123 4 5 6 7 8910 11 Figure 1. Simple correlation analysis between eGFR and serum uric acid levels at baseline. –40 –30 –10 0 10 20 30 –4 –3 –2 –10 1 2 3 Changes in serum uric acid level ml/min /1.73m2 Changes in eGFRin men mg/dl n = 108 r = –0.340 p = 0.0003 Figure 2. Simple correlation analysis between changes in eGFR and changes in serum uric acid levels at 1-year follow up. ![]() N. Miyatake et al. / Health 3 (2011) 498-503 Copyright © 2011 SciRes. http://www.scirp.org/journal/HEALTH/ 502 subjects was diagnosed as having metabolic syndrome, using the Japanese criteria, at baseline and seventeen subjects were diagnosed as having metabolic syndrome at the 1-year follow up. We have previously reported that the prevalence of metabolic syndrome was 30.7% in Japanese men [18]. In this study, with lifestyle modifica- tion after the initial health check-up, metabolic compo- nents were significantly improved in men without medi- cations at the one year follow-up. Although eGFR and serum uric acid levels were not improved after one year, changes in eGFR were negatively correlated with changes in serum uric acid levels. Taken together, reducing serum uric acid levels such as medications may be useful for improving eGFR in Japanese men. Openly accessible at Higher serum uric acid levels contribute to the devel- opment of renal injury and end-stage renal disease [7-12]. Satirapoj B et al. reported in a cross-sectional study that high serum uric acid level was independently associated with increased prevalence of CKD in 5546 Southeast Asian population [7]. The age-adjusted odds ration for CKD, with subjects with no hyperuricemia and no meta- bolic syndrome, was 5.85 for subjects with both hyperu- ricemia and metabolic syndrome [8]. Yen CJ et al. also showed that serum uric acid levels were associated with eGFR and decline in renal function in elderly Taiwanese subjects by longitudinal analysis [9]. In Japanese, hype- ruricemia, hypercholesterolemia and diabetes are risk factors for CKD in peripheral arterial disease [19]. In the present study, there was weak relationship between eGFR and serum uric acid levels at baseline. In addition, we revealed that, changes in serum uric acid levels were correlated with changes in eGFR in men without medi- cations. Changes in other metabolic components, except abdominal circumference, were not linked to changes in eGFR. Therefore, the clinical impact of serum uric acid levels on eGFR was noted in Japanese men. Potential limitations remain in our study. First, the small sample size in our study makes it difficult to infer causality between eGFR and serum uric acid levels. In addition, eGFR and serum uric acid levels were not in- creased with lifestyle modification after one year. Sec- ond, we also could not reveal the mechanism of the lin- kage between eGFR and serum uric acid levels. Third, most of the enrolled subjects were not diagnosed as CKD at baseline. Therefore, the results in this study may not apply for patients with CKD. Further prospective studies using medications are needed in Japanese sub- jects. 5. ACKNOWLEDGEMENTS This research was supported in part by Health and Labor Sciences Research Grants from the Ministry of Health, Labor and Welfare, Japan. REFERENCES [1] National Kidney Foundation (2002) K/DOQI clinical practice guidelines for chronic kidney disease: Evalua- tion, classification, and stratification. Kidney disease outcome quality initiative. American Journal of Kidney Diseases, 39, S1-S266. [2] Imai, E., Horio, M., Iseki, K., et al. (2007) Prevalence of chronic kidney disease (CKD) in the Japanese general population predicted by the MDRD equation modified by a Japanese coefficient. Clinical and Experimental Ne- phrology, 11, 156-163. doi:10.1007/s10157-007-0463-x [3] Matsuo, S., Imai, E., Horio, M., et al. (2009) Revised equations for estimated GFR from serum creatinine in Japan. American Journal of Kidney Diseases, 53, 982- 992. doi:10.1053/j.ajkd.2008.12.034 [4] Miyatake, N., Shikata, K., Makino, H. and Numata, T. (2010) Relationship between estimated glomerular filtra- tion rate (eGFR) and metabolic syndrome in the Japanese population. Acta Medica Okayama, 64, 203-208. [5] Miyatake, N., Shikata, K., Makino, H. and Numata, T. (2011) Decreasing abdominal circumference is associated with improving estimated glomerular filtration rate (e- GFR) with lifestyle modification in Japanese men: A pi- lot study. Acta Medica Okayama, in press. [6] Miyatake, N., Shikata, K., Makino, H. and Numata, T. (2010) Decreasing systolic blood pressure is associated with improving estimated glomerular filtration rate (eGFR) with lifestyle modification in healthy Japanese women. Acta Medica Okayama, 64, 253-258. [7] Satirapoj, B., Supasyndh, O., Chaiprasert, A., et al. (2010) Relationship between serum uric acid levels with chronic kidney disease in a Southeaset Asian population. Ne- phrology (Carlton), 15, 253-258. doi:10.1111/j.1440-1797.2009.01179.x [8] See, L.C., Kuo, C.F., Chang, F.H., et al. (2011) Hyperu- ricemia and metabolic syndrome: Associations with chronic kidney disease. Clinical Rheumatology, 30, 323- 330. doi:10.1007/s10067-010-1461-z [9] Yen, C.J., Chiang, C.K., Ho, L.C., et al. (2009) Hyperu- ricemia associated with rapid renal function decline in elderly Taiwanese subjects. Journal of the Formosan Medical Association, 108, 921-928. doi:10.1016/S0929-6646(10)60004-6 [10] Cain, L., Shankar, A., Ducatman, A.M. and Steenland, K. (2010) The relationship between serum uric acid and chronic kidney disease among Appalachian adults. Ne- phrology Dialysis Transplantation, 25, 3593-3599. doi:10.1093/ndt/gfq262 [11] Madero, M., Sarnak, M.J., Wang, X., et al. (2009) Uric acid and long-term outcomes in CKD. American Journal of Kidney Diseases, 53, 796-803. doi:10.1053/j.ajkd.2008.12.021 [12] Sturm, G., Kollerits, B., Neyer, U., et al. (2008) MMKD study group: Uric acid as a risk factor for progression of non-diabetic chronic kidney disease? The mild to moder- ate kidney disease (MMKD) study. Experimental Geron- tology, 43, 347-352. doi:10.1016/j.exger.2008.01.006 [13] Anonym (2005) Definition and the diagnostic standard ![]() N. Miyatake et al. / Health 3 (2011) 498-503 Copyright © 2011 SciRes. Openly accessible at http://www.scirp.org/journal/HEALTH/ 503 for metabolic syndrome—Committee to evaluate diag- nostic standards for metabolic syndrome (in Japanese). Nippon Naika Gakkai Zasshi, 94, 794-809. [14] Iseki, K., Kohagura, K., Sakime, A., et al. (2007) Changes in the demographics and prevalence of chronic kidney disease in Okinawa, Japan (1993 to 2003). Hy- pertension Research, 30, 55-62. doi:10.1291/hypres.30.55 [15] Ninomiya, T., Kiyohara, Y., Kubo, M., et al. (2006) Me- tabolic syndrome and CKD in a general Japanese popula- tion: The Hisayama Study. American Journal of Kidney Diseases, 48, 383-391. doi:10.1053/j.ajkd.2006.06.003 [16] Tanaka, H., Shiohira, Y., Uezu, Y., et al. (2006) Meta- bolic syndrome and chronic kidney disease in Okinawa, Japan. Kidney International, 69, 369-374. doi:10.1038/sj.ki.5000050 [17] Anonym (2001) Executive summary of the third report of the National Cholesterol Education Program (NCEP) expert panel on detection, evaluation and treatment of high blood cholesterol in adults (adult treatment panel Ⅲ). Journal of the American Medical Association, 285, 2486-2497. [18] Miyatake, N., Kawasaki, Y., Nishikawa, H., Takenami, S. and Numata, T. (2006) Prevalence of metabolic syn- drome in Okayama prefecture, Japan. Internal Medicine, 45, 107-108. doi:10.2169/internalmedicine.45.1509 [19] Endo, M., Kumakura, H., Kanai, H., et al. (2010) Preva- lence and risk factors for renal artery stenosis and chron- ic kidney disease in Japanese patients with peripheral ar- terial disease. Hypertension Research, 33, 911-915. doi:10.1038/hr.2010.93 |