

Paper Menu >>
Journal Menu >>
 Vol.3, No.8, 487-489 (2011) doi:10.4236/health.2011.38080 Copyright © 2011 SciRes. Openly accessible at http://www.scirp.org/journal/HEALTH/ Health Diets of obese and non-obese children Atsuko Satoh1*, Seiko Fujita2, Kazuko Menzawa3, Sangun Lee4, Masao Miyamoto1, Hidatada Sasaki5 1Akita University of Nursing and Welfare, Odate, Japan; *Corresponding Author: [email protected] 2Hiroaki Kensei Hospital, Hirosaki, Japan; 3Faculty of Education, Hirosaki University, Hirosaki, Japan; 4Department of P hysical Therapy, Aomori University of Health and Welfare, Aomori, Japan; 5Sendai Tomisawa Hospital, Sendai , Ja pan. Received 23 March 2011; revised 8 May 2011; accepted 20 July 2011. ABSTRACT Aim: To compare diets betw een obese and non- obese in children. Methods: Thirty-four obese and ten non-obese school children were re- cruited and their habitual factors of obesity were asked. Intakes of food in the obesity and non-obesity groups were checked using a model nutriti onal balance cha rt (M NBC). Resul ts: Average intake ratio of food relative to ideal food intake was significantly higher in the non-obesity group than the obesity group. The relationship between obesity and exercise was significant but not significant for intake ratio of food, times watching TV and playing games. Conclusion: Food intake is not a primary factor of obesity but exercise is a key factor for obe- sity in school children. Since the effect of diet intervention in obese children was slight, exer- cise habit would be a more import ant strategy to reduce obesity than diet in school children. Keywords: Food Intake; Exercise; Sedentary Times; Children; Obesity 1. INTRODUCTION In the last 20 years, the prevalence of obesity in- creased two-fold (from 5% to 10%) in school children in Japan [1]. Childhood obesity is an urgent issue to sub- side increasing metabolic syndrome in adulthood be- cause obesity in children tends to persist into adulthood. Interventions to prevent childhood obesity resulted in not consistent or limited effects of dietary habits and physical activity [2]. Physical activity in children above the government-recommended intensity was not associ- ated with a change in obesity [3]. Cro ss-sectional studies showed that children’s weights were associated with food consumption [4] and sedentary activities [5]. How- ever, it has not been reported which is the key factor to contribute obesity. In the present report, we studied diets between obese and non-obese children and compared diets with physical activity, time watching TV and play- ing games. 2. METHODS The subjects were recruited from primary school chil- dren and a junior high school in Odate City, Akita pre- fecture, Japan, where the authors had school health as- signments as nurses. A child was considered to be obese when the body weight exceeded 120% of the standard body weight, which is defined as the mean body weight corresponding to the he ight for that age and sex obtained from national statistics for Japanese school children in 2009 [1]. The criteria for inclusion as non-obese children are body weight less than 120% of the standard body weight. The subjects of the present study had no endo- crine, metabolic or kidney disease. Among 43 obese children, 9 children refused to participate in the study, leaving 34 children female/male, 20/14, average age 11.9 ± 1.5 years, and ranging from 8 - 14 years. Fifteen children were randomly chosen for the non-obese group. Five children in the non-obese group refused to partici- pate in the study leaving 10 children (female/male, 5/5, average 11.7 ± 2.3 years, ranging from 7 to 14 years) in the non-obese group. Among the 10 non-obese children, 5 were in primary school and 5 were in junior high school. It took one year of serial participation by the subjects, from August 2003 to July 2004. All the participants, including their parents, completed a questionnaire about physical characteristics, health assessment, life styles, such as exercise habits and time watching television an d playing games, family composi- tion, and eating habits. Exercise habits were defined as participating in sporting clubs such as football, basket- ball, baseball and so on associated with the school or outside school and practiced exercise at least twice a week. Food intakes were asked using the model nutri- 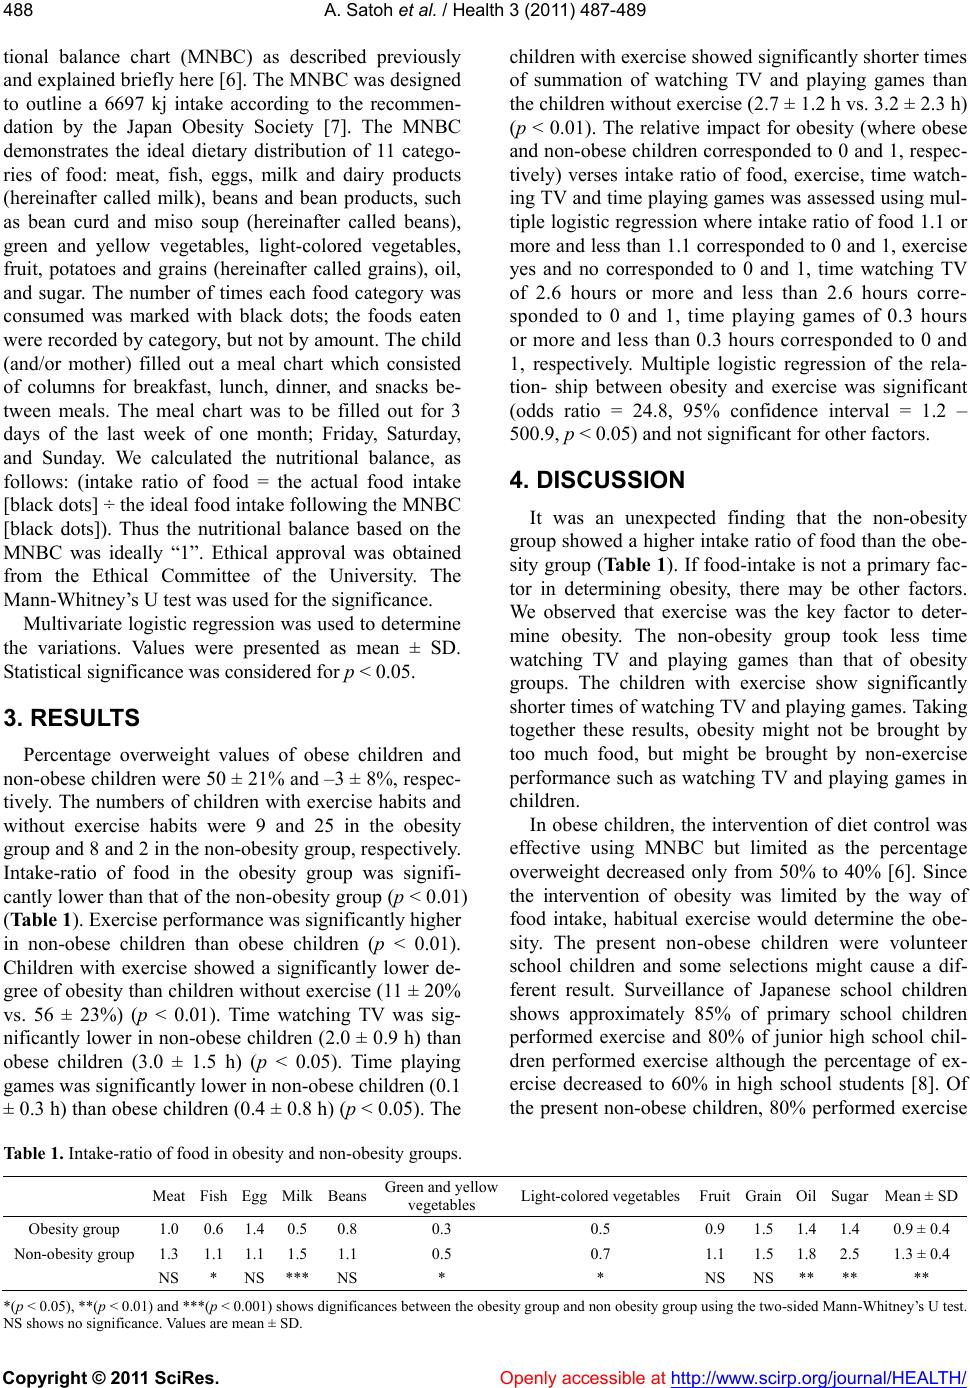 A. Satoh et al. / Health 3 (2011) 487-489 Copyright © 2011 SciRes. Openly accessible at http://www.scirp.org/journal/HEALTH/ 488 tional balance chart (MNBC) as described previously and explained briefly here [6]. The MNBC was designed to outline a 6697 kj intake according to the recommen- dation by the Japan Obesity Society [7]. The MNBC demonstrates the ideal dietary distribution of 11 catego- ries of food: meat, fish, eggs, milk and dairy products (hereinafter called milk), beans and bean products, such as bean curd and miso soup (hereinafter called beans), green and yellow vegetables, light-colored vegetables, fruit, potatoes and grains (hereinafter called grains), oil, and sugar. The number of times each food category was consumed was marked with black dots; the foods eaten were recorded by category, but not by amount. The child (and/or mother) filled out a meal chart which consisted of columns for breakfast, lunch, dinner, and snacks be- tween meals. The meal chart was to be filled out for 3 days of the last week of one month; Friday, Saturday, and Sunday. We calculated the nutritional balance, as follows: (intake ratio of food = the actual food intake [black dots] ÷ the ideal food intake following the MNBC [black dots]). Thus the nutritional balance based on the MNBC was ideally “1”. Ethical approval was obtained from the Ethical Committee of the University. The Mann-Whitney’s U test was used for the significance. Multivariate logistic regression was used to determine the variations. Values were presented as mean ± SD. Statistical significance was considered for p < 0.05. 3. RESULTS Percentage overweight values of obese children and non-obese ch ildren were 50 ± 21% an d –3 ± 8%, respec- tively. The numbers of children with exercise habits and without exercise habits were 9 and 25 in the obesity group and 8 and 2 in the non-obesity group, resp ectively. Intake-ratio of food in the obesity group was signifi- cantly lower than that of the non-o besity group (p < 0.01) (Table 1). Exercise performance was significantly higher in non-obese children than obese children (p < 0.01). Children with exercise showed a significantly lower de- gree of obesity than children withou t exercise (11 ± 20% vs. 56 ± 23%) (p < 0.01). Time watching TV was sig- nificantly lower in non-obese children (2.0 ± 0.9 h) than obese children (3.0 ± 1.5 h) (p < 0.05). Time playing games was significantly lower in non-obese children (0.1 ± 0.3 h) than obese children (0.4 ± 0.8 h) (p < 0.05). The children with exercise showed significantly shorter times of summation of watching TV and playing games than the children without exercise (2.7 ± 1.2 h vs. 3.2 ± 2.3 h) (p < 0.01). The relative impact for obesity (where obese and non-obese ch ildren corresponded to 0 and 1, respec- tively) verses intake ratio of food, exercise, time watch- ing TV and time playing games was assessed using mul- tiple logistic regression wh ere intake ratio of food 1.1 or more and less than 1.1 corresponded to 0 and 1, exercise yes and no corresponded to 0 and 1, time watching TV of 2.6 hours or more and less than 2.6 hours corre- sponded to 0 and 1, time playing games of 0.3 hours or more and less than 0.3 hours corresponded to 0 and 1, respectively. Multiple logistic regression of the rela- tion- ship between obesity and exercise was significant (odds ratio = 24.8, 95% confidence interval = 1.2 – 500.9, p < 0.05) and not significant for other factors. 4. DISCUSSION It was an unexpected finding that the non-obesity group showed a higher intake ratio of food than the obe- sity group (Table 1). If food-intake is not a primary fac- tor in determining obesity, there may be other factors. We observed that exercise was the key factor to deter- mine obesity. The non-obesity group took less time watching TV and playing games than that of obesity groups. The children with exercise show significantly shorter times of watching TV and playing games. Taking together these results, obesity might not be brought by too much food, but might be brought by non-exercise performance such as watching TV and playing games in children. In obese children, the intervention of diet control was effective using MNBC but limited as the percentage overweight decreased only from 50% to 40% [6]. Since the intervention of obesity was limited by the way of food intake, habitual exercise would determine the obe- sity. The present non-obese children were volunteer school children and some selections might cause a dif- ferent result. Surveillance of Japanese school children shows approximately 85% of primary school children performed exercise and 80% of junior high school chil- dren performed exercise although the percentage of ex- ercise decreased to 60% in high school students [8]. Of the present non-obese children, 80% performed exercise Table 1. Intake-ratio of food in obesity and non-obesity groups. Meat Fish Egg Milk Beans Green and yellow vegetables Light-colored veget a b l e sFruitGrain Oil Sugar Mean ± SD Obesity group 1.0 0.6 1.4 0.5 0.8 0.3 0.5 0.91.5 1.4 1.4 0.9 ± 0.4 Non-obesity group 1.3 1.1 1.1 1.5 1.1 0.5 0.7 1.11.5 1.8 2.5 1.3 ± 0.4 NS * NS *** NS * * NSNS ** ** ** *(p < 0.05), **(p < 0.01) and ***(p < 0.001) shows dignificances between the obesity group and non obesity group using the two-sided Mann-Whitney’s U test. NS shows no significance. Values are mean ± SD.  A. Satoh et al. / Health 3 (2011) 487-489 Copyright © 2011 SciRes. Openly accessible at http://www.scirp.org/journal/HEALTH/ 489 which seems to be an average percentage for exercise. The present study suggests that in school children, if they exercised, obesity would not be a problem irrespec- tive of the amount of food they took. The present MNBC was proved to be useful for self-care dependent older patients with diabetes mellitus [9]. The subjects were responsible for reporting their own food intake by cate- gory but not by the amount of food, which precludes any quantitative estimate of their actual food intake [6]. In adults and older patients with diabetes mellitus, since exercise performance is limited due to social and physi- cal reasons, diet control might be more important in re- ducing obesity as well as for controlling diabetes melli- tus. REFERENCES [1] The Ministry of Education, Culture, Sport, Science and Technology (2009) The nationwide statistics of physical development for Japanese children (in Japanese). Print- ing Department of the Ministry of Finance, Tokyo. [2] Flodmark, C.E., Marcus, C. and Britton, M. (2006) In- terventions to prevent obesity in children and adolescents, a systematic literature review. International Journal of Obesity, 30, 579-589. doi:10.1038/sj.ijo.0803290 [3] Metcalf, B.S., Voss, L.D., Hosking, J., Jeffery, A.,N. and Wilkin, T.J. (2008) Physical activity at the government- -recommended level and obesity-related health outcomes: A longitudinal study (early bird 37). Archives of Disease in Childhood, 93, 772-777. doi:10.1136/adc.2007.135012 [4] Guillaume, M., Laoidus, L. and Lambert, A. (1998) Obe- sity and nutrition in children. The belgian luxembourg child study IV. The European Journal Clinical Nutrition, 52, 323-328. doi:10.1038/sj.ejcn.1600532 [5] Wardle, J., Guthrie, C., Sanderson, S., Birch, L. and Plo- min, R. (2001) Food and activity preferences in children of lean and obese parents. International Journal of Obe- sity, 25, 971-977. doi:10.1038/sj.ijo.0801661 [6] Satoh, A., Menzawa, K., Lee, S., Hatakeyama, A. and Sasaki, H. (2007) Dietary guidance for obese children and their families using a model nutritional balance chart. Japan Journal of Nursing Science, 4, 95-102. [7] Japan Obesity Society (2001) Obesity manual for guid- ance of obese patients (in Japanese). Ishiyaku Publishers, Tokyo. [8] Japan School Health Association (2009) Surveillance of health status of Japanese school children (in Japanese). Japan School Health Associationfoundation, Tokyo. [9] Satoh, A., Sakurada, T., Hatakeyama, A., Fukuoka, Y., Hatakeyama, R. and Sasaki, H. (2008) Dietary guidance for older patients with diabetes mellitus and primary ca- regivers using a model nutritional balance chart. Japan Journal of Nursing Science, 5, 83-89. doi:10.1111/j.1742-7924.2008.00105.x |