

Paper Menu >>
Journal Menu >>
 Vol.2, No.3, 213-219 (2011) doi:10.4236/as.2011.23030 Copyright © 2011 SciRes. Openly accessible at http://www.scirp.org/journal/AS/ Agricultural Scienc es Effects of different levels of compost application on amounts and distribution of organic nitrogen forms in soil particle size fractions subjected mainly to double cropping Thu Ha Nguyen, Haruo Shindo* Faculty of Agriculture, Yamaguchi University, Yamaguchi, Japan; *Corresponding Author: [email protected] Received 24 May 2011; revised 24 June 2011; accepted 25 July 2011. ABSTRACT Effects of different levels of compost applica- tion on the amount s and percentage distributio n of organic N forms in whole soils and particle size fractions were investigated. Soil samples were collected from three plots: a) F, only chemical fertilizers; b) F + LC, chemical fertiliz- ers plus low level of compost; (c) F + HC, chemi- cal fertilizers plus high level of compost. Each soil sample was divided into five fractions: coarse sand-sized aggregate (CSA), medium sand-sized aggregate (MSA), fine sand-sized aggregate (FSA), silt-sized aggregate (SIA) and clay-sized aggregate (CLA) fractions. The sand fractions were subdivided into decayed plants (DP) and mineral particles (MP). The amounts of total N and different organic N forms in the whole soils as well as size fractions generally increased with increasing the amount of com- post. In the whole soils, percentage distribution of non-hydrolysable-N and amino sugar-N in- creased by compost application while the dis- tribution values of the hydrolysable ammonium- N and uniden tified-N decreased. The application did not affect the distribution degree of amino acid-N. In the size fractions, the distribution values of most organic N forms increased in the CSA-DP, MSA-DP and FSA-DP fractions by compost ap plicat ion. In the CLA fractions, the a - mounts and percentage distribution of organic N forms were the highest, although the applica- tion caused decreases in their distribution val- ues. These findings indicate that the CLA frac- tion merit close attention as an important res- ervoir of various organic N. Keywords: Compost Application; Upland and Paddy Fields; Soil Organic N Forms; Size Fractions 1. INTRODUCTION In the surface layer of most soils, over 90% of N occurs in organic forms [1]. The forms of soil organic N can be divided into two broad categories: 1) organic residues and 2) soil organic matter or humus [2]. All these materials play key roles in terms of maintaining or improving soil fertility and plant nutrition through the direct and indirect effects on microbial activity and nutrient availability. Application of organic fertilizer has received great attention from agriculturists and environmentalists be- cause of directly and indirectly effects on crop growth and yield as well as soil properties. Organic amendments may affect the amounts and percentage distribution of organic N forms in whole soils and their particle size fractions. Results of 15N studies clearly demonstrated that from 20% to 40% of the fertilizer N (inorganic N) added to agricultural soils was incorporated into organic forms during the first growing season [2]. Hassink [3] suggested that N associated with particle size fraction of less than 20 µm were better protected against decom- position. A number of authors have studied the influence of different types of organic fertilizer on the amounts and properties of N in the particle size fractions. For example, Schulten and Leinweber [4] reported that the amounts of N compounds increased with decreasing particle size and that the fine- and medium-clay and the fine- and medium-silt fractions of farmyard manure soil were enriched in amino-N and amide-N. Leinweber and Reuter [5] pointed out that N concentration was generally highest in the clay fraction, followed by the silt and sand fractions. The N content of the soil particles from 250 to 2000 μm was reported to be greater with increased management intensity [6]. According to Xu et  T. H. Nguyen et al. / Agricultural Science 2 (2 011) 213-219 Copyright © 2011 SciRes. Openly accessible at http://www.scirp.org/journal/AS/ 214 al. [7], in the plot received mineral fertilizer plus organic manure, most of the N remaining was transferred into amino sugar-N in every size fractions studied and amino acid-N in the size fraction of larger than 2 µm. Tanaka and Shindo [8] found that long-term compost application increased the amount of N to a larger degree in the silt- sized aggregate fraction than in the other size fractions. On the other hand, several authors have observed the effects of different levels of organic amendments on soil properties and fertilities. For example, soil organic matter content, total N content and soil microbial population increased with increasing the rate of compost application [9-11]. Angers and N’Dayegamiye [12] presented evi- dences that bi-annual application of 40 and 80 Mg·ha-1 increased N contents of whole soil and all particle size fractions studied. However, the effects of amendments on the contents and distribution of forms of organic N in particle size fractions of soils and the relationship be- tween the amounts of amendment and organic N forms have received little attention. The objective of present study was to assess the influences of different levels of compost application on the amounts and distribution of several organic N forms in whole soils and their particle size fractions of mainly double cropped fields (paddy rice and barley). This is the first report on the relation- ships among the organic N groups, soil particle size fractions of double cropped fields and levels of compost applied. 2. MATERIALS AND METHODS 2.1. Field Experiment The field experiments with different types of man- agement were established in 1975 at Yamaguchi Prefec- ture Agricultural Experimental Station, Yamaguchi, Ja- pan. The soil at this site was classified as Gray Lowland soil (FAO-UNESCO: Eutric Fluvisol). For the field ex- periments, we selected three plots (200 m2 each): a) F plot, only chemical fertilizers containing N, P and K were applied; b) F + LC plot, chemical fertilizers plus a low level of compost (5 Mg·ha–1) were applied; c) F + HC plot, chemical fertilizers plus a high level of com- post (15 Mg·ha–1) were applied. The same plots were used as paddy fields for rice in summer and as upland fields for barley in winter until June 2001. The applica- tion rate of N, P2O5 and K2O for each crop was 100 kg·ha–1. After harvest (June and November), rice straw- cow dung compost was applied as described above. However, since June 2001, these plots were used only as paddy fields and the amounts of chemical fertilizers and compost applied were reduced by half. In October 2008, to obtain an average soil sample in each plot, soils were taken from the plow layer (0 - 15 cm) of five sites across each of the three plots and mixed well. The soils were air-dried, gently crushed, and then passed through a 2- mm mesh sieve. These sieved samples were used for analytical determinations and physical fractionation. 2.2. Particle Size Fractions The size fractionation of soil samples was conducted by physical fractionation described in Tanaka and Shindo [8], except that the particle size fraction of 20 - 53 μm was recovered by sieving. Firstly, the samples were divided into five particle size fractions, namely coarse sand-sized aggregate (212 - 2000 μm, CSA), me- dium sand-sized aggregate (53 - 212 μm, MSA), fine sand-sized aggregate (20 - 53 μm, FSA), silt-sized ag- gregate (2 - 20 μm, SIA) and clay-sized aggregate (<2 μm, CLA) fractions. Three sand-sized fractions were separated by sieving and then silt-sized and clay-sized fractions were separated by sedimentation. Secondly, the CSA, MSA and FSA fractions were subdivided into “mineral particles” (MP) and “decayed plants” (DP) by a density fractionation (decantation) in water. All the fractions including DP and MP were freeze- ried and weighed. d 2.3. Organic N Forms Organic N composition was analysed according to the method described in Yonebayashi and Hattori [13], who partly modified the N fractionation method proposed by Bremner [14]. It was considered that the improved method is suitable for establishing the origin of soil or- ganic N fractions, especially in case of tropical soils. Soil sample containing about 10 mg N was hydrolysed with 20 mL of 6 mol·L–1 HCl and octyl alcohol for 24 hours at 150˚C. The hydrolysate obtained was made up to a volume of 100 mL after filtering under suction and neutralizing (pH from 6.4 to 6.6) by NaOH. A scheme for the fractional determination of soil organic N is shown in Figure 1. The amount of hydrolysable ammonium-N (HAN) (a) was estimated by distilling the hydrolysate with MgO. Figure 1. Scheme for the fractional determination of soil or- ganic N.  T. H. Nguyen et al. / Agricultural Science 2 (2 011) 213-219 Copyright © 2011 SciRes. http://www.scirp.org/journal/AS/ 215215 The sum amount (b) of the HAN and amino sugar-N (ASN) was determined by distilling the hydrolysate with phosphate-borate (PB) buffer. The amount of the ASN was calculated by subtraction of (a) from (b). In the determination of amino acid-N (AAN) (c), the hydrolysate was heated at 100˚C in the presence of 0.5 mol·L –1 NaOH and ninhydrin powder and then distilled with PB buffer. Openly accessible at Total hydrolysable-N (d) and total N (e) were deter- mined by Kjeldahl procedure recommended by Bremner and Mulvaney [15]. The unidentified-N (HUN) and non- hydrolysable-N (NHN) contents were calculated as fol- lowing formulations: HUN = (d) – (c) – (b). NHN = (e) – (d). Amounts of different organic N forms were analysed in duplicate at least and the average values obtained were given. 3. RESULTS AND DIS CUSSION 3.1. Distribution of Mass Weight in Particle Size Fractions In the physical fractionation of soil samples, the re- coveries of mass weight ranged from 99.5% to 101% in all plots. The percentage distribution of mass weight in the particle size fractions was corrected to a total of 100% (Table 1). In all the plots, the distribution of mass weight in the particle size fractions was generally in the order of CLA < FSA < SIA < MSA < CSA. As expected, in the CSA, MSA and FSA fractions of all plots, the dis- tribution values of MP were much larger than those of DP. The particle size fractions obtained were designated as aggregate fractions because percentage distribution of mass weight in particle size fractions differed before and after H2O2 treatment of soils [16]. 3.2. Total N The amounts and percentage distribution of total N in the particle size fractions are presented in Figures 2 and 3. In all size fractions, the amount of total N (mg·kg–1 soil) was higher in the F + LC and particularly F + HC plot than in the F plot (Figure 2). These results were in line with findings obtained by some authors that N con- centration in the particle size fractions increased with increasing levels of organic amendments application [8,11,17,18]. Xu et al. [7] described that organic amendments ap- plication did not change the order of N content of parti- cle size fractions studied. The same results were ob- tained in this study. In the F+HC plot, the amount of total N was in order of CSA-MP, MSA-MP < FSA-MP < Figure 2. Amounts of total N in particle size fractions. See Ta b l e 1 for F, F + LC and F + HC. See Figure 1 for CSA, MSA, FSA, SIA, CLA, MP and DP. Figure 3. Percentage distribution of total N in particle size fractions. See Table 1 for F, F + LC and F + HC. See Figure 1 for CSA, MSA, FSA, SIA, CLA, MP and DP. Table 1. Percentage distribution (%) of mass weight in particle size fractions. CSAd MSAe FSAf MPi DPj Sum MP DP Sum MP DP Sum SIAg CLAh Total Plot (%) Fa 30.9 0.77 31.7 20.0 0.95 21.0 16.3 1.14 17.4 18.7 11.2 100 F+LCb 30.1 1.28 31.4 20.4 1.56 22.0 16.1 2.05 18.2 18.8 9.60 100 F+HCc 32.6 1.73 34.3 20.4 2.40 22.8 14.2 3.24 17.4 17.0 8.49 100 a. only chemical fertilizers were applied; b. chemical fertilizers plus low level of compost (5 Mg·ha–1) were applied; c. chemical fertilizers plus high level of compost (15 Mg·ha–1) were applied; d. coarse sand-sized aggregate fraction; e. medium sand-sized aggregate fraction; f. fine sand-sized aggregate fraction; g. silt-sized aggregate fraction; h. clay-sized aggregate fraction; i. mineral particles; j. decayed plants.  T. H. Nguyen et al. / Agricultural Science 2 (2 011) 213-219 Copyright © 2011 SciRes. Openly accessible at http://www.scirp.org/journal/AS/ 216 CSA-DP < FSA-DP < MSA-DP < SIA < CLA fractions. Similar orders were found in the F and F + LC plots. In all the plots, the percentage distribution of N was greater in the SIA and CLA fractions, ranging from 23.3% to 46.0%, than in the other fractions, ranging from 1.96% to 14.9% (Figure 3). As pointed out by Ta- naka and Shindo [8], in the CLA fraction, distribution value of total N was in the order of F + HC < F + LC < F plots. Furthermore, in all the plots, the distribution of N was the highest in the CLA fractions. These findings were in agreement with results reported by Leinweber and Reuter [5] and Xu et al. [7] that clay-sized fraction contained highest N. 3.3. Organic N Forms in Whole Soils In the reviews on soil organic N, Kelley and Steven- son [2] and Schulten and Schnitzer [19] summarized that the HAN originated from indigenous fixed NH4 + plus some fractions from the breakdown of hydroxyl amino acids and other amino acids, amino sugars, amides and the deamination of purines and pyrimidines. Amino ac- ids occur in soils in the form of proteins and peptides closely associated with and protected by humic materials and inorganic soil constituents such as clay minerals and hydrous oxides of Fe and Al [19]. Amino sugars appear as structural components of a broad group of substances called macropolysacharides. Some amino sugars exist as chitin and others are polysaccharides that are not chitin [1]. One-fourth to one-half of the HUN in soils has been reported to occur as the non-α-amino acid-N such as arginine, tryptophan, lysine and proline [20]. Kelley and Stevenson [2] described that part of the NHN might oc- cur as structural components of humic substances and in the form of N-phenyl amino acids resulting from the bonding between amino groups and aromatic rings. The amounts and percentage distribution of organic N forms in the whole soils are given in Figures 4 and 5. The amount of the HAN was higher in the F + LC, espe- cially F + HC plots than in the F plot. However, the dis- tribution value of the HAN was in the order of F + HC < F + LC < F plot. Similar results were found for the HUN. The amounts of the AAN in the F + LC and F + HC plots were 1.3 and 1.8 times higher than those in the F plot, respectively and the distribution value was not in- fluenced by compost application. The amounts and dis- tribution degrees of the ASN and NHN substantially in- creased at high level of compost application. The in- crease of the NHN may be because N derived from chemical fertilizers, compost and plant residues were transferred into resistant organic forms as suggested by Olson and Swallow [21] and Kelley and Stevenson [22]. These findings were similar to the results reported by Xu et al. [7], except that the amount of the HAN decreased by organic amendments application. Figure 4. Amounts of organic N forms in whole soils. See Table 1 for F, F + LC and F + HC. See Figure 1 for HAN, AAN, ASN, HUN and NHN. Figure 5. Percentage distribution of organic N forms in whole soils. See Table 1 for F, F + LC and F + HC. See Figure 1 for HAN, AAN, ASN, HUN and NHN. 3.4. Organic N Forms in Particle Size Fractions. The amounts (mg·kg–1 soil) and percentage distribu- tion of organic N forms in the particle size fractions are presented in Tabl e s 2 and 3. It is noteworthy that in all three plots, the CLA and SIA fractions enriched most organic N forms. Their amounts and distribution values were the highest in the CLA fraction, generally followed by the SIA fraction. As expected, the content and distri- bution degree of organic N forms in the CSA-DP, MSA- DP and FSA-DP fractions were higher than those in the CSA-MP, MSA-MP and FSA-MP fractions. These re- sults were in accordance with data published by several authors that finer fractions contain larger amounts of N than coarser fractions [1,3,5]. The amounts of the HAN, AAN, ASN and HUN in the particle size factions generally increased with increasing levels of compost application. Such a relationship was not found for the NHN. The effects of compost applica- tion on percentage distribution of organic N forms are ummarized as follows (Table 3): 1) The distribution s 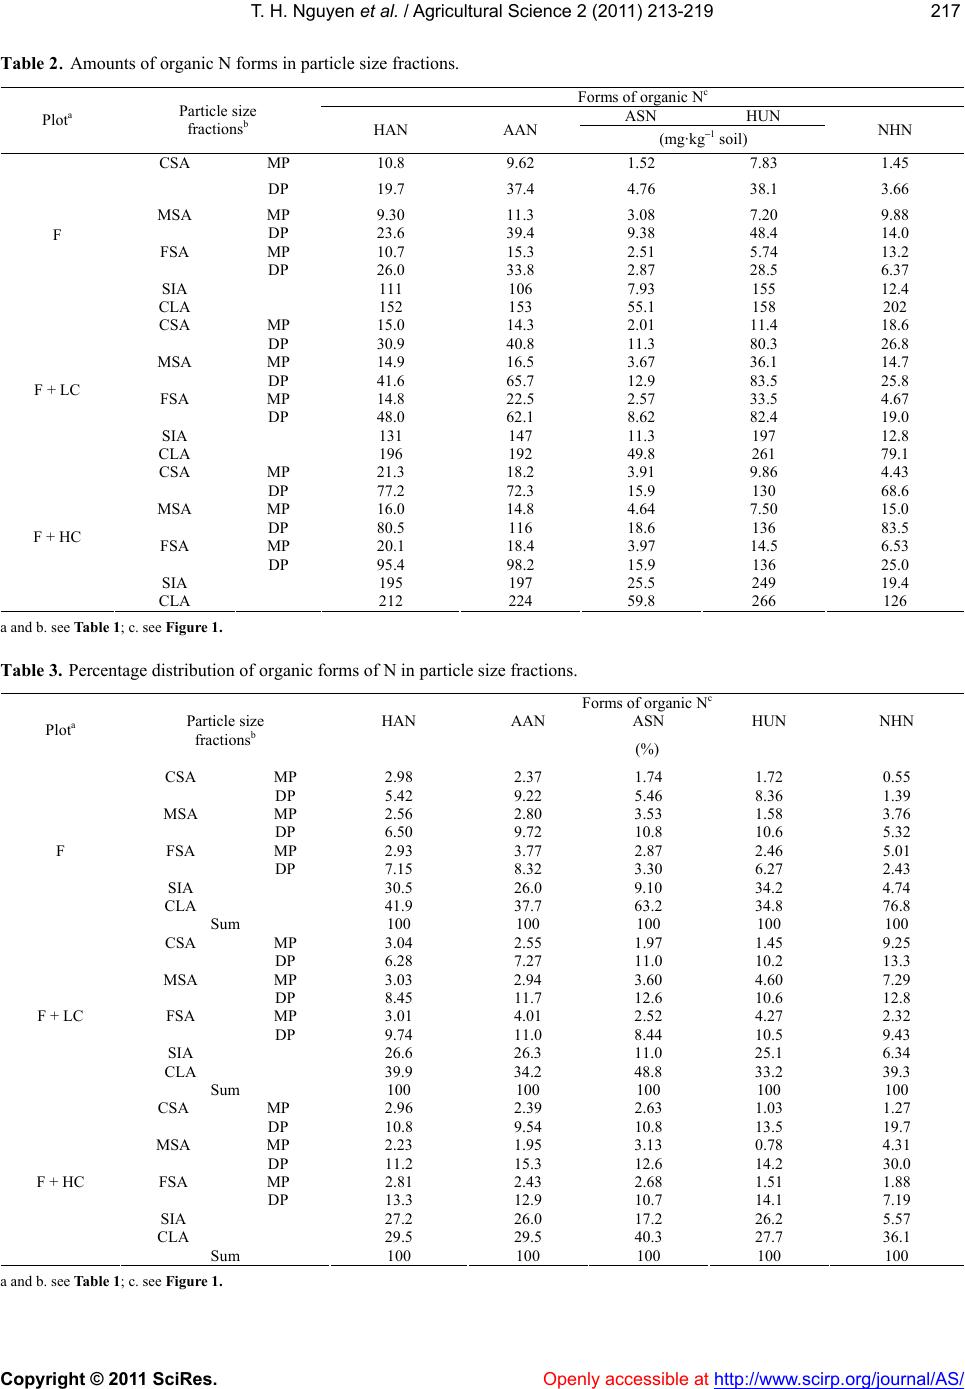 T. H. Nguyen et al. / Agricultural Science 2 (2 011) 213-219 Copyright © 2011 SciRes. Openly accessible at http://www.scirp.org/journal/AS/ 217217 Table 2. Amounts of organic N forms in particle size fractions. Forms of organic Nc ASN HUN Plota Particle size fractionsb HAN AAN (mg·kg–1 soil) NHN CSA MP 10.8 9.62 1.52 7.83 1.45 DP 19.7 37.4 4.76 38.1 3.66 MSA MP 9.30 11.3 3.08 7.20 9.88 DP 23.6 39.4 9.38 48.4 14.0 FSA MP 10.7 15.3 2.51 5.74 13.2 DP 26.0 33.8 2.87 28.5 6.37 SIA 111 106 7.93 155 12.4 F CLA 152 153 55.1 158 202 CSA MP 15.0 14.3 2.01 11.4 18.6 DP 30.9 40.8 11.3 80.3 26.8 MSA MP 14.9 16.5 3.67 36.1 14.7 DP 41.6 65.7 12.9 83.5 25.8 FSA MP 14.8 22.5 2.57 33.5 4.67 DP 48.0 62.1 8.62 82.4 19.0 SIA 131 147 11.3 197 12.8 F + LC CLA 196 192 49.8 261 79.1 CSA MP 21.3 18.2 3.91 9.86 4.43 DP 77.2 72.3 15.9 130 68.6 MSA MP 16.0 14.8 4.64 7.50 15.0 DP 80.5 116 18.6 136 83.5 FSA MP 20.1 18.4 3.97 14.5 6.53 DP 95.4 98.2 15.9 136 25.0 SIA 195 197 25.5 249 19.4 F + HC CLA 212 224 59.8 266 126 a and b. see Table 1; c. see Figure 1. Table 3. Percentage distribution of organic forms of N in particle size fractions. Forms of organic Nc HAN AAN ASN HUN NHN Plota Particle size fractionsb (%) CSA MP 2.98 2.37 1.74 1.72 0.55 DP 5.42 9.22 5.46 8.36 1.39 MSA MP 2.56 2.80 3.53 1.58 3.76 DP 6.50 9.72 10.8 10.6 5.32 FSA MP 2.93 3.77 2.87 2.46 5.01 DP 7.15 8.32 3.30 6.27 2.43 SIA 30.5 26.0 9.10 34.2 4.74 CLA 41.9 37.7 63.2 34.8 76.8 F Sum 100 100 100 100 100 CSA MP 3.04 2.55 1.97 1.45 9.25 DP 6.28 7.27 11.0 10.2 13.3 MSA MP 3.03 2.94 3.60 4.60 7.29 DP 8.45 11.7 12.6 10.6 12.8 FSA MP 3.01 4.01 2.52 4.27 2.32 DP 9.74 11.0 8.44 10.5 9.43 SIA 26.6 26.3 11.0 25.1 6.34 CLA 39.9 34.2 48.8 33.2 39.3 F + LC Sum 100 100 100 100 100 CSA MP 2.96 2.39 2.63 1.03 1.27 DP 10.8 9.54 10.8 13.5 19.7 MSA MP 2.23 1.95 3.13 0.78 4.31 DP 11.2 15.3 12.6 14.2 30.0 FSA MP 2.81 2.43 2.68 1.51 1.88 DP 13.3 12.9 10.7 14.1 7.19 SIA 27.2 26.0 17.2 26.2 5.57 CLA 29.5 29.5 40.3 27.7 36.1 F + HC Sum 100 100 100 100 100 a and b. see Table 1; c. see Figure 1. 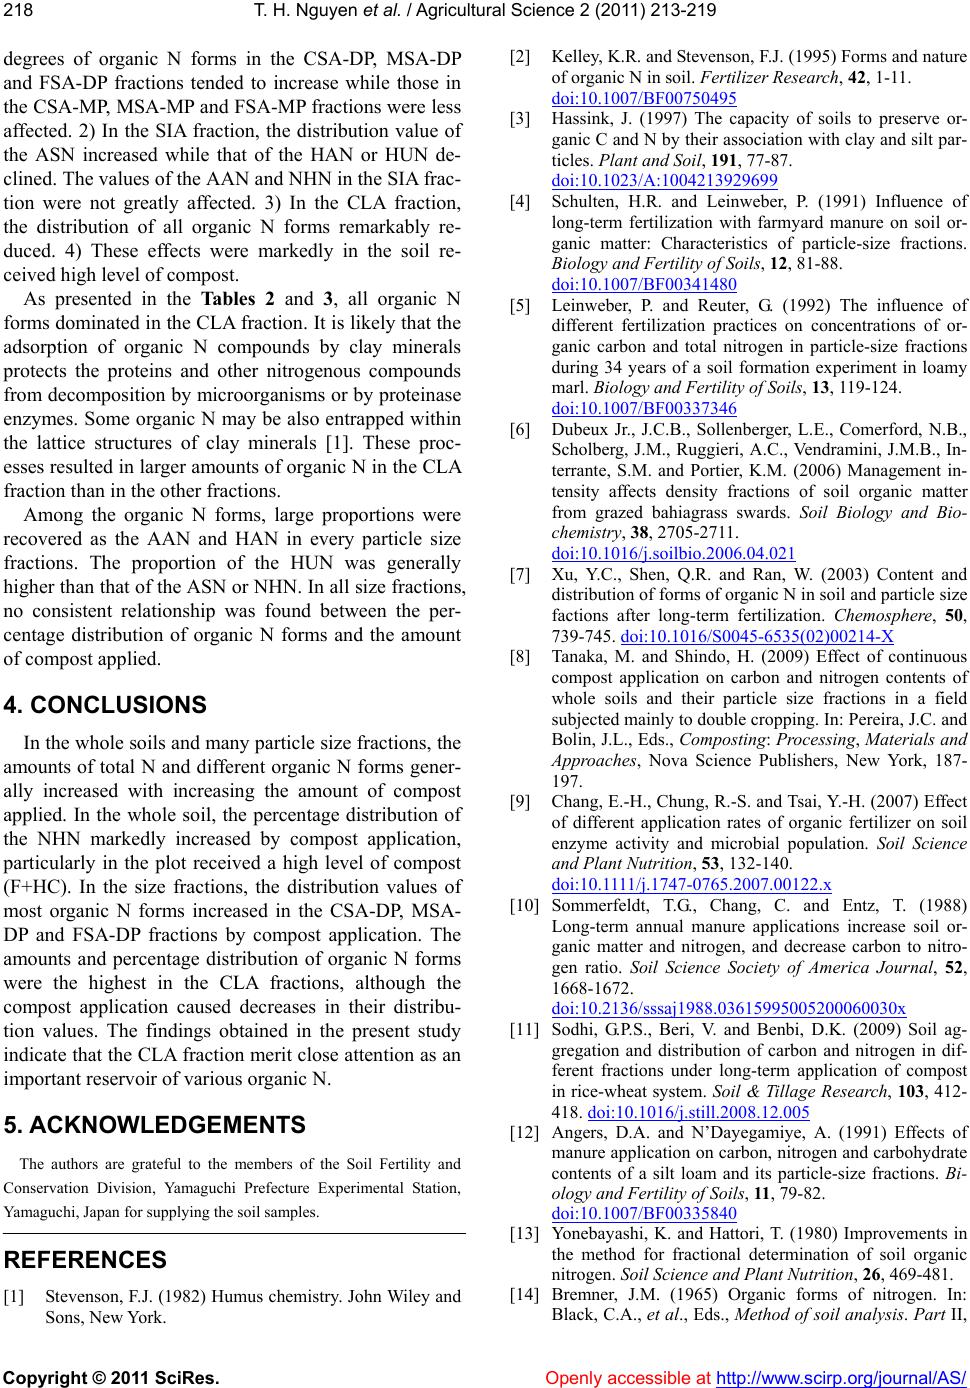 T. H. Nguyen et al. / Agricultural Science 2 (2 011) 213-219 Copyright © 2011 SciRes. Openly accessible at http://www.scirp.org/journal/AS/ 218 degrees of organic N forms in the CSA-DP, MSA-DP and FSA-DP fractions tended to increase while those in the CSA-MP, MSA-MP and FSA-MP fractions were less affected. 2) In the SIA fraction, the distribution value of the ASN increased while that of the HAN or HUN de- clined. The values of the AAN and NHN in the SIA frac- tion were not greatly affected. 3) In the CLA fraction, the distribution of all organic N forms remarkably re- duced. 4) These effects were markedly in the soil re- ceived high level of compost. As presented in the Tables 2 and 3, all organic N forms dominated in the CLA fraction. It is likely that the adsorption of organic N compounds by clay minerals protects the proteins and other nitrogenous compounds from decomposition by microorganisms or by proteinase enzymes. Some organic N may be also entrapped within the lattice structures of clay minerals [1]. These proc- esses resulted in larger amounts of organic N in the CLA fraction than in the other fractions. Among the organic N forms, large proportions were recovered as the AAN and HAN in every particle size fractions. The proportion of the HUN was generally higher than that of the ASN or NHN. In all size fractions, no consistent relationship was found between the per- centage distribution of organic N forms and the amount of compost applied. 4. CONCLUSIONS In the whole soils and many particle size fractions, the amounts of total N and different organic N forms gener- ally increased with increasing the amount of compost applied. In the whole soil, the percentage distribution of the NHN markedly increased by compost application, particularly in the plot received a high level of compost (F+HC). In the size fractions, the distribution values of most organic N forms increased in the CSA-DP, MSA- DP and FSA-DP fractions by compost application. The amounts and percentage distribution of organic N forms were the highest in the CLA fractions, although the compost application caused decreases in their distribu- tion values. The findings obtained in the present study indicate that the CLA fraction merit close attention as an important reservoir of various organic N. 5. ACKNOWLEDGEMENTS The authors are grateful to the members of the Soil Fertility and Conservation Division, Yamaguchi Prefecture Experimental Station, Yamaguchi, Japan for supplying the soil samples. REFERENCES [1] Stevenson, F.J. (1982) Humus chemistry. John Wiley and Sons, New York. [2] Kelley, K.R. and Stevenson, F.J. (1995) Forms and nature of organic N in soil. Fertilizer Research, 42, 1-11. doi:10.1007/BF00750495 [3] Hassink, J. (1997) The capacity of soils to preserve or- ganic C and N by their association with clay and silt par- ticles. Plant and Soil, 191, 77-87. doi:10.1023/A:1004213929699 [4] Schulten, H.R. and Leinweber, P. (1991) Influence of long-term fertilization with farmyard manure on soil or- ganic matter: Characteristics of particle-size fractions. Biology and Fertility of Soils, 12, 81-88. doi:10.1007/BF00341480 [5] Leinweber, P. and Reuter, G. (1992) The influence of different fertilization practices on concentrations of or- ganic carbon and total nitrogen in particle-size fractions during 34 years of a soil formation experiment in loamy marl. Biology and Fertility of Soils, 13, 119-124. doi:10.1007/BF00337346 [6] Dubeux Jr., J.C.B., Sollenberger, L.E., Comerford, N.B., Scholberg, J.M., Ruggieri, A.C., Vendramini, J.M.B., In- terrante, S.M. and Portier, K.M. (2006) Management in- tensity affects density fractions of soil organic matter from grazed bahiagrass swards. Soil Biology and Bio- chemistry, 38, 2705-2711. doi:10.1016/j.soilbio.2006.04.021 [7] Xu, Y.C., Shen, Q.R. and Ran, W. (2003) Content and distribution of forms of organic N in soil and particle size factions after long-term fertilization. Chemosphere, 50, 739-745. doi:10.1016/S0045-6535(02)00214-X [8] Tanaka, M. and Shindo, H. (2009) Effect of continuous compost application on carbon and nitrogen contents of whole soils and their particle size fractions in a field subjected mainly to double cropping. In: Pereira, J.C. and Bolin, J.L., Eds., Composting: Processing, Materials and Approaches, Nova Science Publishers, New York, 187- 197. [9] Chang, E.-H., Chung, R.-S. and Tsai, Y.-H. (2007) Effect of different application rates of organic fertilizer on soil enzyme activity and microbial population. Soil Science and Plant Nutrition, 53, 132-140. doi:10.1111/j.1747-0765.2007.00122.x [10] Sommerfeldt, T.G., Chang, C. and Entz, T. (1988) Long-term annual manure applications increase soil or- ganic matter and nitrogen, and decrease carbon to nitro- gen ratio. Soil Science Society of America Journal, 52, 1668-1672. doi:10.2136/sssaj1988.03615995005200060030x [11] Sodhi, G.P.S., Beri, V. and Benbi, D.K. (2009) Soil ag- gregation and distribution of carbon and nitrogen in dif- ferent fractions under long-term application of compost in rice-wheat system. Soil & Tillage Research, 103, 412- 418. doi:10.1016/j.still.2008.12.005 [12] Angers, D.A. and N’Dayegamiye, A. (1991) Effects of manure application on carbon, nitrogen and carbohydrate contents of a silt loam and its particle-size fractions. Bi- ology and Fertility of Soils, 11, 79-82. doi:10.1007/BF00335840 [13] Yonebayashi, K. and Hattori, T. (1980) Improvements in the method for fractional determination of soil organic nitrogen. Soil Science and Plant Nutrition, 26, 469-481. [14] Bremner, J.M. (1965) Organic forms of nitrogen. In: Black, C.A., et al., Eds., Method of soil analysis. Part II,  T. H. Nguyen et al. / Agricultural Science 2 (2 011) 213-219 Copyright © 2011 SciRes. Openly accessible at http://www.scirp.org/journal/AS/ 219219 American Society of Agronomy, Madison, 1238-1255. [15] Bremner, J.M. and Mulvaney, C.S. (1982) Nitrogen-Total. In: Page, A.L., Miller, R.H. and Keeney, D.R., Eds., Methods of Soil Analysis. Part 2, Chemical and microbi- ological properties, American Society of Agronomy, Soil Science Society of America, Madison, 595-624. [16] Nguyen, T.H. and Shindo, H. (2011) Quantitative and qualitative changes of humus in whole soils and their particle size fractions as influenced by different levels of compost application. Agricultural Sciences, 2, 1-8. doi:10.4236/as.2011.21001 [17] Aoyama, M. (1992) Accumulated organic matter and its nitrogen mineralization in soil particle size fractions with long-term application of farmyard manure or compost. Japanese Journal of Soil Science and Plant Nutrition, 63, 161-168. [18] Aoyama, M. and Taninai, Y. (1992) Organic matter and its mineralization in particle size and aggregate size frac- tions of soils with four-year application of farmyard ma- nure. Japanese Journal of Soil Science and Plant Nutri- tion, 63, 571-580. [19] Schulten, H.R. and Schnitzer, M. (1998) The chemistry of soil organic nitrogen: A Review. Biology and Fertility of Soils, 26, 1-15. doi:10.1007/s003740050335 [20] Goh, K.M. and Edmeades, D.C. (1979) Distribution and partial characterisation of acid hydrolysable organic ni- trogen in six New Zealand soils. Soil Biology and Bio- chemistry, 11, 127-132. doi:10.1016/0038-0717(79)90088-9 [21] Olson, R.V. and Swallow, C.W. (1984) Fate of labelled nitrogen fertilizer applied to winter wheat for five years. Soil Science Society of America Journal, 48, 583-586. doi:10.2136/sssaj1984.03615995004800030023x [22] Kelley, K.R. and Stevenson, F.J. (1987) Effects of carbon source on immobilization and chemical distribution of fertilizer N in soil. Soil Science Society of America Journal, 51, 946-951. doi:10.2136/sssaj1987.03615995005100040023x |