

Paper Menu >>
Journal Menu >>
 Vol.2, No.3, 201-207 (2011) doi:10.4236/as.2011.23028 Copyright © 2011 SciRes. Openly accessible at http://www.scirp.org/journal/AS/ Agricultural Scienc es QTL mapping for Chinese northern-style steamed bread specific volume Peng Wu*1,2, Bin Liu*1, Tao Zhou*3, Zhuokun Li1,Haiyun Du4, Jiteng Wang5, Jichun Tian1,6 1Group of Quality Wheat Breeding of State Key Laboratory of Crop Biology of Shandong Agricultural University, Tai’an, China; 2College of Food Science and Engineering, Shandong Agricultural University, Tai’an, China; Corresponding Aut hor: [email protected] 3College of Horticulture Science and Engineering, Shandong Agricultural University, Tai’an, China; 4Tai’an Bureau of Quality and Technical Supervision, Tai’an, China; 5Rongcheng Entry-Exit Inspection and Quarantine Bureau,Rongcheng, China; 6Agronomy Department, Shandong Agricultural University, Tai’an, China; Corresponding Aut h o r : [email protected], [email protected] Received 25 April 2011; revised 26 June 2011; accepted 7 July 2011. ABSTRACT In this study, quantitative trait loci (QTLs) with additive effects, epistatic effects for CNSB spe- cific volume in bread wheat (Triticum aestivum L.), were studied in cultivars Huapei 3 and Yu- mai 57 (Triticum aestivum L.). The DH popula- tion and the parents were planted in 2007 and 2008 in Tai’an and 2008 in Suzhou. QTL analy- ses were performed using the software of Ici- Mapping v2.2 based on the mixed linear model. Five putative QTLs for CNSB specific volume were detected on 5 chromosomes where single QTLs explained 5.11% to 9.75% of phenotypic variations. All of them had negative effects on specific volume and were contributed by Yumai 57 alleles. Qsv-1B was detected in both envi- ronment 1 and 3 with 13.88% and 4.83% pheno- typic variations which had positive effects and was transmitted by Huapei 3 alleles. Fourteen pairs of QTLs with epistatic effects were de- tected for specific volume. Seven major QTLs, Qsv-1B/Qsv-3A, Qsv-2D/Qsv-3A, Qsv-3A/Qsv- 5B1, Qsv-1B/Qsv-6D, Qsv-2D/Qsv-4D, Qsv-4A/ Qsv-6B and Qsv-3A/Qsv-7D could account for 13.88%、20.39%、18.88%、12.31%、18.78%、11.98%, and 17.05% of the phenotypic variation of spe- cific volume. The information obtained in this study will be useful for manipulating the QTLs for CNSB specific volume proper ty by molecular marker-assisted selecti on (MAS). Keywords: Wheat; Doubled Haploid; Quantitative Trait Loci; CNSB; Specific Volume 1. INTRODUCTION Chinese steamed bread (CSB) is a staple food of the Chinese people, especially in northern China, where it is eaten at every meal. It has been consumed for at least 2,000 years in China, and has also been gaining in popularity in Korea, Japan, and some Southeast Asian countries in recent years as food culture intercommuni- cations have rapidly developed among different coun- tries. There are two types of steamed bread in China: northern-style (CNSB) and southern-style (CSSB), with differences in the ingredients and quality evaluation. Most research has focused on CNSB, since it is by far the most widely produced, and about 40% of Chinese wheat consumption is used to make CNSB, particularly in northern China [1]. CNSB quality is defined by its specific volume, ex- ternal appearance, internal characteristics, and color. Specific volume is an important factor in CNSB’s score, which is the ratio of volume to weight. The greater the value, the better leavened is the CNSB. It has significant correlations with color, another important factor in CNSB’s scores [2]. However, few QTL analyses have yet been reported for those steamed bread’s specific volume. Huapei 3 is hard wheat with a higher grain protein content and wet gluten content. Yumai 57 is soft wheat with higher gluten index and sodium dodecyl sulfate (SDS) sedimentation volume and is more productive under different ecological conditions [3]. The parents both have white seed coats. Wheat processing and end- use characteristics, collectively known as quality traits, are controlled by both genetics and environment. Mo- lecular-genetic studies to elucidate this control may in- crease the efficiency of breeding wheat for improved quality [4]. Quantitative trait loci (QTLs) analyses of *Peng Wu and Bin Liu, Tao Zhou contributed equally to this work.  P. Wu et al. / Agricultural Science 2 (2011) 201-207 Copyright © 2011 SciRes. Openly accessible at http://www.scirp.org/journal/AS/ 202 quality traits have been reported using a set of 168 dou- bled haploid (DH) lines derived from a cross of Huapei 3 × Yu mai 57. The objectives of the study described here was to de- tect QTLs with additive effects, epistatic effects, and QEs for the specific volume of CNSB, which should be useful in manipulating the QTLs for steamed-bread spe- cific volume by the molecular marker-assisted selection in wheat breeding programs. 2. MATERIALS AND METHODS 2.1. Plant Materials and Growth Conditions A population of 168 DH lines, derived from a cross between two Chinese wheat cultivars Huapei 3 (Hp3) and Yumai 57 (Ym57), was used for the construction of a linkage map. The DH population and parents were kindly provided by Professor Yan Hai, Henan Academy of Agricultural Sciences, Zhengzhou, China. Hp3 and Ym57 were released by Henan Province in 2006 [5] and by the State (China) in 2003 [6], respectively. The two parents are cultivated over a large area in the Huang- Huai Wheat Region in China, differing in several agronomi- cally important traits as well as in baking quality traits. The 168 DH lines and parents were planted in two replications at each location with a completely random- ized block design at three environments in 2007 and 2008 in Ta i’an (36.18 ˚N, 117.13˚E), Shandong Province; in 2007 in Suzhou (31.32 ˚N, 120.62˚E), Anhui Province. In Tai’an, there were remarkable differences in tempera- ture and soil conditions between the years 2007 and 2008. In autumn 2007, all lines and parental lines were grown in 2 m long by three-row plots (25 cm apart); in autumn 2008, the lines were grown in 2 m long by four-row plots (25 cm apart). The soil was brown earth, in which the av ailable N, P, and K contents in the top 20 cm were 40.2 mg/kg, 51.3 mg/kg and 70.8 mg/kg. Be- fore planting, 27,500 kg/hectare (ha) of farmyard ma- nure or barnyard manure (nitrogen content, 0.05% - 0.1%), 225 kg/ha of urea, 300 kg/ha of phosphorus dia- mine fertilizer, 225 kg/ha of potassium chloride, and 15 kg/ha of zinc sulphate were added as fertilizers. In Tai’An, the rainfalls during the growth cycles were 165 mm and 172.5 mm in 2007-2008 and 2008-2009, re- spectively. In Suzhou, the rainfalls during the growth cycle totaled 207.5 mm in 2008-2009. All of crop management followed local practices. Plots were irrigated in winter (December 1, 2007), and at jointing (April 3, 2008), anthesis (May 7, 2008), and grain filling (May 20, 2008). They were top-dressed with 225 kg/hectare and 75 kg/hectare urea at the jointing (April 3, 2008) and anthesis stages (May 7, 2008) with irrigation, respectively. The lines were harvested indi- vidually at maturity to prevent yield loss from over-rip- ening. Harvested grain samples from the two replicates at each environment were mixed and cleaned prior to conditioning. One thousand grams of grain samples from each line at each environment were milled on a Buhler experimental mill (model-MLU 300 m/s Buhler, Uzwil Switzerland). Prior to milling, the hard, medium hard (mixtures of hard and soft wheat) and soft wheats were tempered to around 16%, 15%, and 14% moisture con- tents for 24 hours, respectively. 2.2. Steamed Bread Preparation CNSB was prepared according to the Chinese stan- dard SB/T10139-93 App endix A [7]. Th e milled sample, 100 g of flour, was mixed with the yeast solution (1g dry yeast dispersed in 48 ml 38˚C water). Dough was fer- mented for 60 min in a fermentation cabinet (38˚C, 85% rh) after 3 min mixing. The fermented dough was di- vided into two pieces and each shaped by hand for 3 min into a round dough piece with a smooth surface. Then the breads were steamed for 20 min in a steam chamber (>100˚C) after resting in the air for 15 min. Then the steamed breads were cooled in the air for 40 min. 2.3. Specific Volume Measurements of CNSB Samples Steamed bread was placed in a covered bamboo con- tainer at room temperature immediately after steaming. Then the steamed breads were cooled in the air for 40 min. Samples were measured using an electric balance for weight and a substitution method with rapeseed for volume. All scores were taken three times per sample. The mean values of CNSB specific volume in each en- vironment were used for statistical analyses. All determinations were made at least three times, and were expressed on a 14% - 16% moisture basis. 2.4. DNA Marker Assay and Construction of the Genetic Map A genetic linkage map of DH population with 323 markers, including 284 SSR loci, 37 EST loci, 1 inter- simple sequence repeat (ISSR) locus, and 1 HMW-GS locus was constructed. This linkage map covered a total length of 2,485.7 cm with an average distance of 7.67 cm between adjacent markers. Thirteen markers re- mained unlinked. These linked markers formed 24 link- age groups at LOD 4.0. The genomic locations of marker loci/linkage groups were determined based on the wheat consensus map. Thirty loci (7.03%) were mapped on different chromosomal locations compared with the map published by Somers et al. [8]. The rec- ommended map distance for genome wide QTL scan- ning was an interval length less than 10 cm [9]. In this 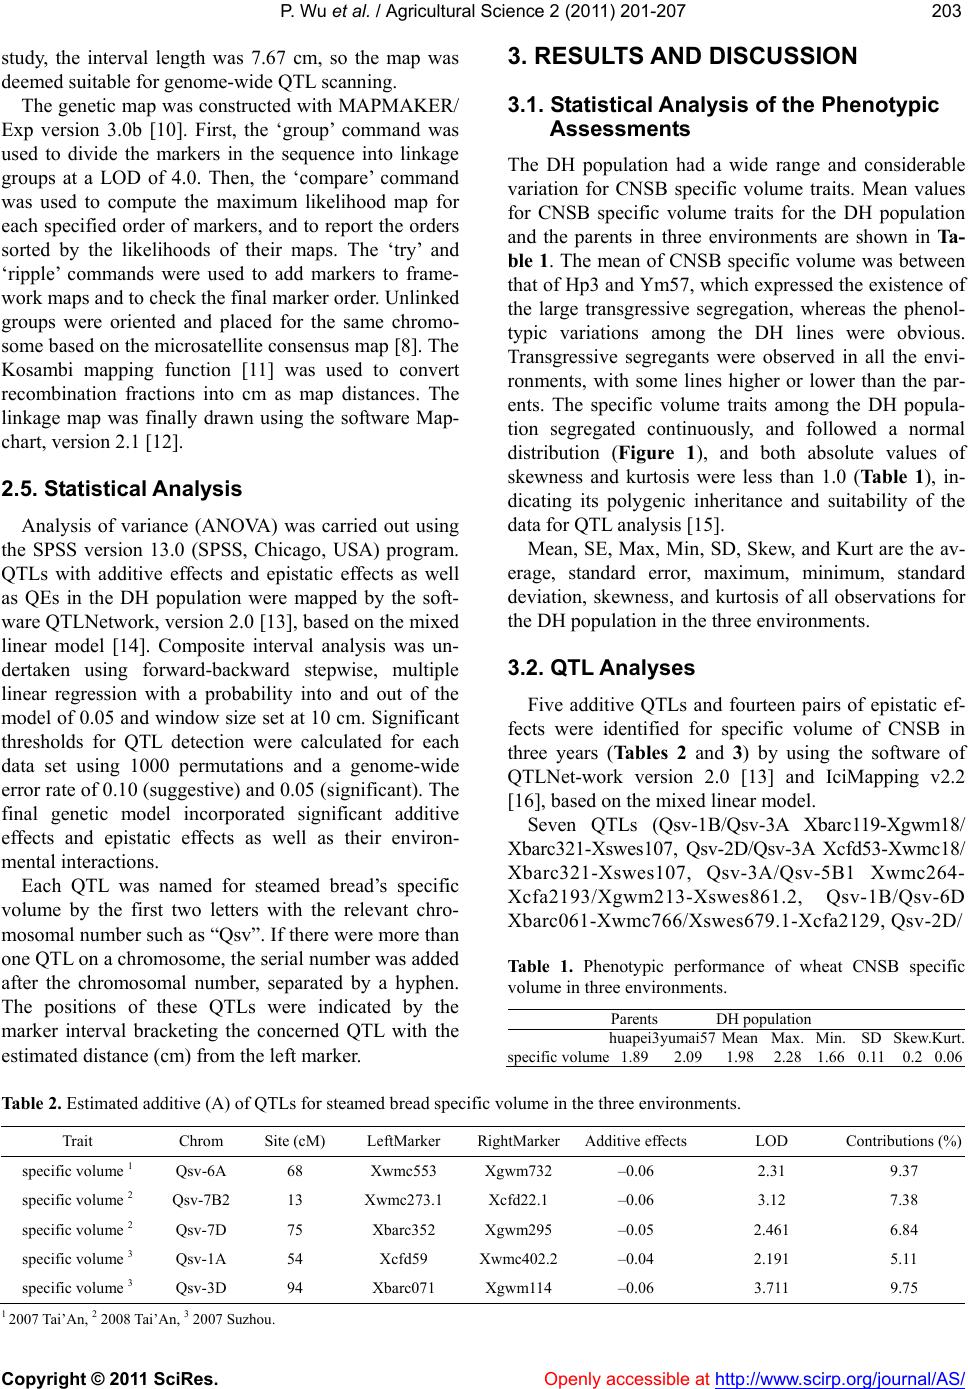 P. Wu et al. / Agricultural Science 2 (2011) 201-207 Copyright © 2011 SciRes. http://www.scirp.org/journal/AS/Openly accessible at 203203 study, the interval length was 7.67 cm, so the map was deemed suitable for genome-wide QTL scanning. The genetic map was constructed with MAPMAKER/ Exp version 3.0b [10]. First, the ‘group’ command was used to divide the markers in the sequence into linkage groups at a LOD of 4.0. Then, the ‘compare’ command was used to compute the maximum likelihood map for each specified order of markers, and to report the orders sorted by the likelihoods of their maps. The ‘try’ and ‘ripple’ commands were used to add markers to frame- work maps and to check the final marker order. Unlinked groups were oriented and placed for the same chromo- some based on the microsatellite consen sus map [8]. Th e Kosambi mapping function [11] was used to convert recombination fractions into cm as map distances. The linkage map was finally drawn using the software Map- chart, versi on 2.1 [12]. 2.5. Statistical Analysis Analysis of variance (ANOVA) was carried out using the SPSS version 13.0 (SPSS, Chicago, USA) program. QTLs with additive effects and epistatic effects as well as QEs in the DH population were mapped by the soft- ware QTLNetwork, version 2.0 [13], based on the mixed linear model [14]. Composite interval analysis was un- dertaken using forward-backward stepwise, multiple linear regression with a probability into and out of the model of 0.05 and window size set at 10 cm. Significant thresholds for QTL detection were calculated for each data set using 1000 permutations and a genome-wide error rate of 0.10 (suggestive) and 0.05 (significant). The final genetic model incorporated significant additive effects and epistatic effects as well as their environ- mental interactions. Each QTL was named for steamed bread’s specific volume by the first two letters with the relevant chro- mosomal number such as “Qsv”. If there were more than one QTL on a chromosome, the serial number was added after the chromosomal number, separated by a hyphen. The positions of these QTLs were indicated by the marker interval bracketing the concerned QTL with the estimated distance (cm) from the left marker. 3. RESULTS AND DIS CUSSION 3.1. Statistical Analysis of the Phenotypic Assessments The DH population had a wide range and considerable variation for CNSB specific volume traits. Mean values for CNSB specific volume traits for the DH population and the parents in three environments are shown in Ta- ble 1. The mean of CNSB specific volume was between that of Hp3 and Ym57, which expressed the existence of the large transgressive segregation, whereas the phenol- typic variations among the DH lines were obvious. Transgressive segregants were observed in all the envi- ronments, with some lines higher or lower than the par- ents. The specific volume traits among the DH popula- tion segregated continuously, and followed a normal distribution (Figure 1), and both absolute values of skewness and kurtosis were less than 1.0 (Ta b le 1 ), in- dicating its polygenic inheritance and suitability of the data for QTL analysis [15]. Mean, SE, Max, Min, SD, Skew, and Kurt are the av- erage, standard error, maximum, minimum, standard deviation, skewness, and kurtosis of all observations for the DH population in the three environments. 3.2. QTL Analyses Five additive QTLs and fourteen pairs of epistatic ef- fects were identified for specific volume of CNSB in three years (Tables 2 and 3) by using the software of QTLNet-work version 2.0 [13] and IciMapping v2.2 [16], based on the mixed linear model. Seven QTLs (Qsv-1B/Qsv-3A Xbarc119-Xgwm18/ Xbarc321-Xswes107, Qsv-2D/Qsv-3A Xcfd53-Xwmc18/ Xbarc321-Xswes107, Qsv-3A/Qsv-5B1 Xwmc264- Xcfa2193/Xgwm213-Xswes861.2, Qsv-1B/Qsv-6D Xbarc061-Xwmc766/Xswes679.1-Xcfa2129, Qsv-2D/ Table 1. Phenotypic performance of wheat CNSB specific volume in three environm e n t s . Parents DH population huapei3yumai57Mean Max. Min. SDSkew.Kurt. specific volume1.892.091.98 2.28 1.66 0.110.20.06 Table 2. Estimated additive (A) of QTLs for steamed bread specific volume in the three environments. Trait Chrom Site (cM) LeftMarker RightMarkerAdditive effectsLOD Contributions (%) specific volume 1 Qsv-6A 68 Xwmc553 Xgwm732 –0.06 2.31 9.37 specific volume 2 Qsv-7B2 13 Xwmc273.1 Xcfd22.1 –0.06 3.12 7.38 specific volume 2 Qsv-7D 75 Xbarc352 Xgwm295 –0.05 2.461 6.84 specific volume 3 Qsv-1A 54 Xcfd59 Xwmc402.2–0.04 2.191 5.11 specific volume 3 Qsv-3D 94 Xbarc071 Xgwm114 –0.06 3.711 9.75 1 2007 Tai’An, 2 2008 Tai’An, 3 2007 Suzhou. 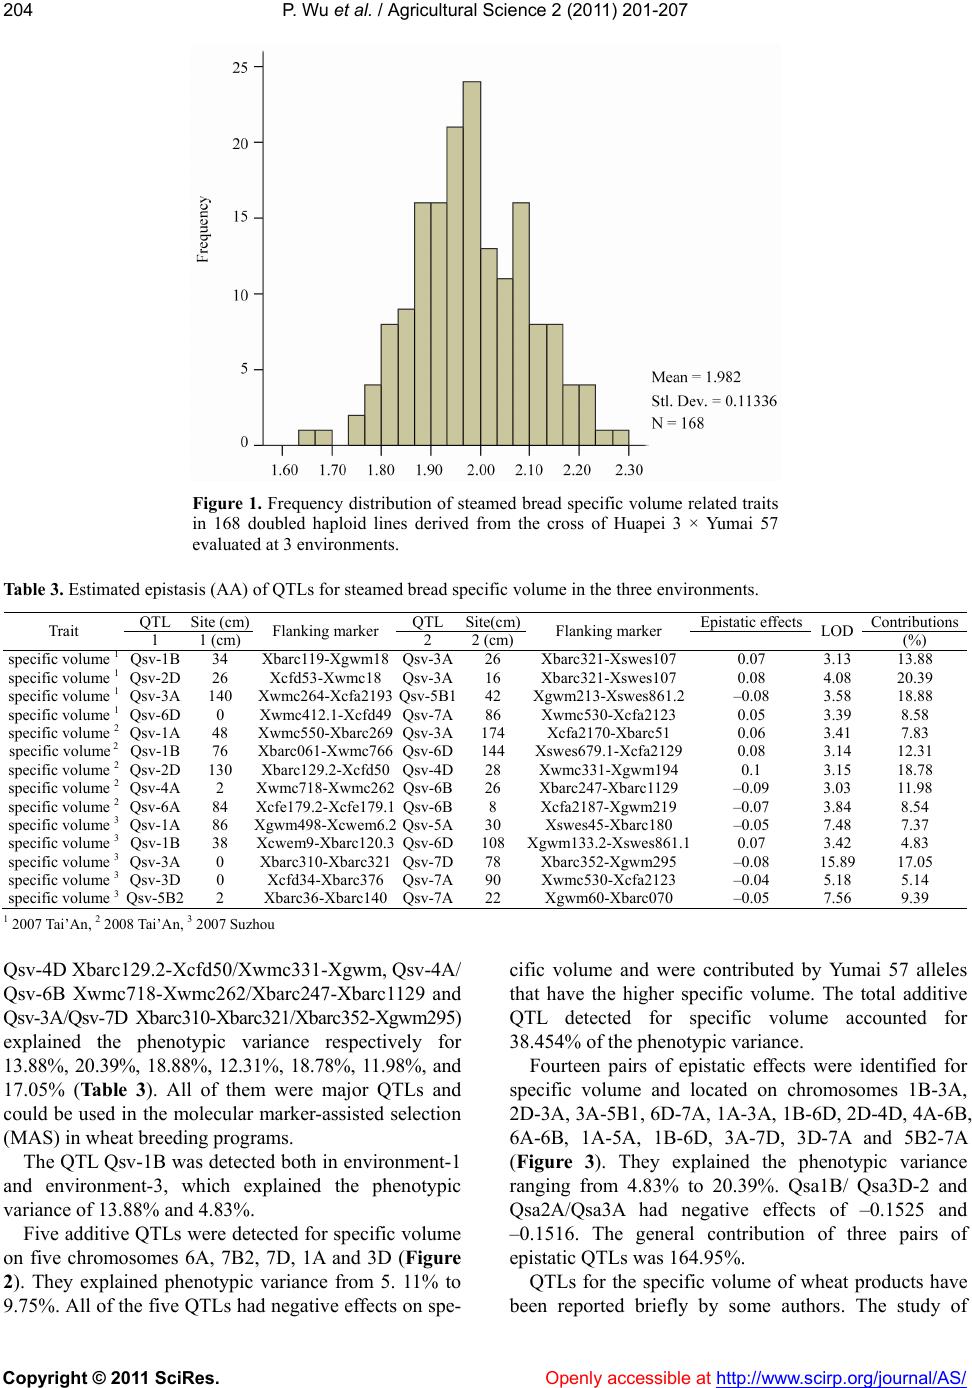 P. Wu et al. / Agricultural Science 2 (2011) 201-207 Copyright © 2011 SciRes. Openly accessible at http://www.scirp.org/journal/AS/ 204 Figure 1. Frequency distribution of steamed bread specific volume related traits in 168 doubled haploid lines derived from the cross of Huapei 3 × Yumai 57 evaluated at 3 environments. Table 3. Estimated epistasis (AA) of QTLs for steamed bread specific volume in the three environments. QTL Site (cm)QTLSite(cm)Epistatic effects Contributions Trait 1 1 (cm)Flanking marker 2 2 (cm)Flanking marker LOD (%) specific volume 1 Qsv-1B 34 Xbarc119-Xgwm18Qsv-3A26 Xbarc321-Xswes1070.07 3.13 13.88 specific volume 1 Qsv-2D 26 Xcfd53-Xwmc18 Qsv-3A16 Xbarc321-Xswes1070.08 4.08 20.39 specific volume 1 Qsv-3A 140 Xwmc264-Xcfa2193Qsv-5B142 Xgwm213-Xswes861.2–0.08 3.58 18.88 specific volume 1 Qsv-6D 0 Xwmc412.1-Xcfd49Qsv-7A86 Xwmc530-Xcfa21230.05 3.39 8.58 specific volume 2 Qsv-1A 48 Xwmc550-Xbarc269Qsv-3A174 Xcfa2170-Xbarc51 0.06 3.41 7.83 specific volume 2 Qsv-1B 76 Xbarc061-Xwmc766Qsv-6D144 Xswes679.1-Xcfa21290.08 3.14 12.31 specific volume 2 Qsv-2D 130 Xbarc129.2-Xcfd50Qsv-4D28 Xwmc331-Xgwm1940.1 3.15 18.78 specific volume 2 Qsv-4A 2 Xwmc718-Xwmc262Qsv-6B26 Xbarc247-Xbarc1129–0.09 3.03 11.98 specific volume 2 Qsv-6A 84 Xcfe179.2-Xcfe179.1Qsv-6B8 Xcfa2187-Xgwm219–0.07 3.84 8.54 specific volume 3 Qsv-1A 86 Xgwm498-Xcwem6.2Qsv-5A30 Xswes45-Xbarc180 –0.05 7.48 7.37 specific volume 3 Qsv-1B 38 Xcwem9-Xbarc120.3Qsv-6D108 Xgwm133.2-Xswes861.10.07 3.42 4.83 specific volume 3 Qsv-3A 0 Xbarc310-Xbarc321Qsv-7D78 Xbarc352-Xgwm295–0.08 15.89 17.05 specific volume 3 Qsv-3D 0 Xcfd34-Xbarc376Qsv-7A90 Xwmc530-Xcfa2123–0.04 5.18 5.14 specific volume 3 Qsv-5B2 2 Xbarc36-Xbarc140Qsv-7A22 Xgwm60-Xbarc070 –0.05 7.56 9.39 1 2007 Tai’An, 2 2008 Tai’An, 3 2007 Su zhou Qsv-4D Xbarc129.2-Xcfd50/Xwmc331-Xgwm, Qsv-4A/ Qsv-6B Xwmc718-Xwmc262/Xbarc247-Xbarc1129 and Qsv-3A/Qsv-7D Xbarc310-Xbarc321/Xbarc352-Xgwm295) explained the phenotypic variance respectively for 13.88%, 20.39%, 18.88%, 12.31%, 18.78%, 11.98%, and 17.05% (Table 3). All of them were major QTLs and could be used in the molecular marker-assisted selection (MAS) in wheat breeding programs. The QTL Qsv-1B was detected both in environment-1 and environment-3, which explained the phenotypic variance of 13.88% and 4.83%. Five additive QTLs were detected for specific volume on five chromosomes 6A, 7B2, 7D, 1A and 3D (Figure 2). They explained phenotypic variance from 5. 11% to 9.75%. All of the five QTLs had negative effects on spe- cific volume and were contributed by Yumai 57 alleles that have the higher specific volume. The total additive QTL detected for specific volume accounted for 38.454% of the phenotypic variance. Fourteen pairs of epistatic effects were identified for specific volume and located on chromosomes 1B-3A, 2D-3A, 3A -5B1, 6D-7A, 1A-3A, 1 B-6D, 2D -4D, 4A- 6B, 6A-6B, 1A-5A, 1B-6D, 3A-7D, 3D-7A and 5B2-7A (Figure 3). They explained the phenotypic variance ranging from 4.83% to 20.39%. Qsa1B/ Qsa3D-2 and Qsa2A/Qsa3A had negative effects of –0.1525 and –0.1516. The general contribution of three pairs of epistatic QTLs was 164.95%. QTLs for the specific volume of wheat products have een reported briefly by some authors. The study of b 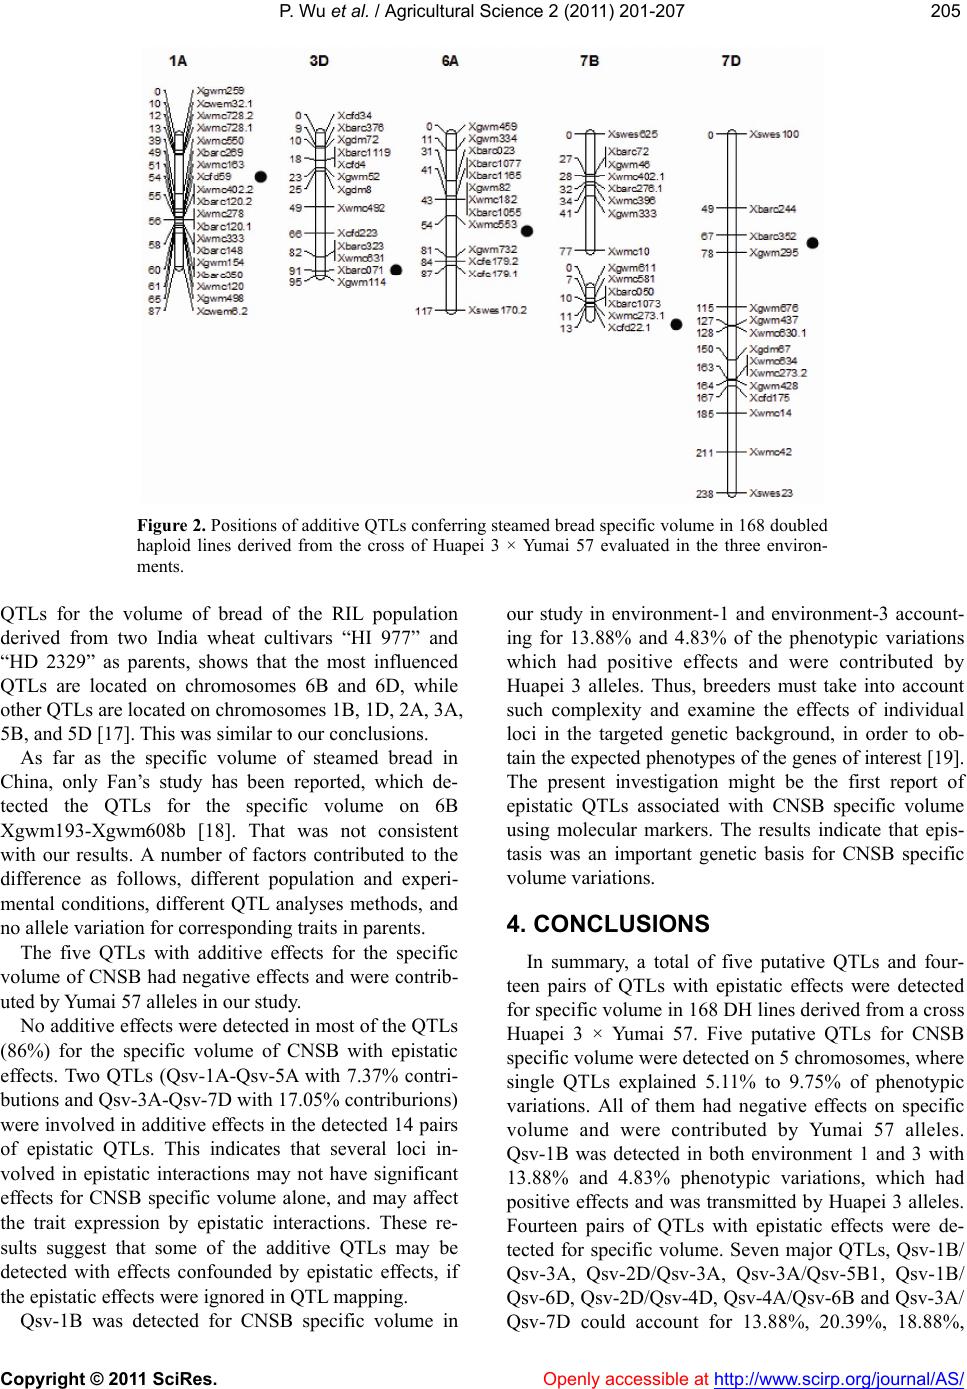 P. Wu et al. / Agricultural Science 2 (2011) 201-207 Copyright © 2011 SciRes. Openly accessible at http://www.scirp.org/journal/AS/ 205205 Figure 2. Positions of additive QTLs conferring steamed bread specific volume in 168 doubled haploid lines derived from the cross of Huapei 3 × Yumai 57 evaluated in the three environ- ments. QTLs for the volume of bread of the RIL population derived from two India wheat cultivars “HI 977” and “HD 2329” as parents, shows that the most influenced QTLs are located on chromosomes 6B and 6D, while other QTLs are located on chromosomes 1B, 1D, 2A, 3A, 5B, and 5D [17]. This was similar to our conclusions. As far as the specific volume of steamed bread in China, only Fan’s study has been reported, which de- tected the QTLs for the specific volume on 6B Xgwm193-Xgwm608b [18]. That was not consistent with our results. A number of factors contributed to the difference as follows, different population and experi- mental conditions, different QTL analyses methods, and no allele variation for corresponding traits in parents. The five QTLs with additive effects for the specific volume of CNSB had negative effects and were contrib- uted by Yu mai 5 7 alleles in our study. No additive effects were detected in most of the QTLs (86%) for the specific volume of CNSB with epistatic effects. Two QTLs (Qsv-1A-Qsv-5A with 7.37% contri- butions and Qsv-3A-Qsv-7D with 17.05% contriburions) were involved in additive effects in the detected 14 pairs of epistatic QTLs. This indicates that several loci in- volved in epistatic interactions may not have significant effects for CNSB specific volume alone, and may affect the trait expression by epistatic interactions. These re- sults suggest that some of the additive QTLs may be detected with effects confounded by epistatic effects, if the epistatic effects were ignored in QTL mapping. Qsv-1B was detected for CNSB specific volume in our study in environment-1 and environment-3 account- ing for 13.88% and 4.83% of the phenotypic variations which had positive effects and were contributed by Huapei 3 alleles. Thus, breeders must take into account such complexity and examine the effects of individual loci in the targeted genetic background, in order to ob- tain the expected phenotypes of the genes of interest [19]. The present investigation might be the first report of epistatic QTLs associated with CNSB specific volume using molecular markers. The results indicate that epis- tasis was an important genetic basis for CNSB specific volume variations. 4. CONCLUSIONS In summary, a total of five putative QTLs and four- teen pairs of QTLs with epistatic effects were detected for specific volume in 168 DH lines derived from a cross Huapei 3 × Yumai 57. Five putative QTLs for CNSB specific volume were detected on 5 chromosomes, where single QTLs explained 5.11% to 9.75% of phenotypic variations. All of them had negative effects on specific volume and were contributed by Yumai 57 alleles. Qsv-1B was detected in both environment 1 and 3 with 13.88% and 4.83% phenotypic variations, which had positive effects and was transmitted by Huapei 3 alleles. Fourteen pairs of QTLs with epistatic effects were de- tected for specific volume. Seven major QTLs, Qsv-1B/ Qsv-3A, Qsv-2D/Qsv-3A, Qsv-3A/Qsv-5B1, Qsv-1B/ Qsv-6D, Qsv-2 D/Qsv-4D, Qsv-4A/Qsv-6B an d Qsv-3A/ Qsv-7D could account for 13.88%, 20.39%, 18.88%, 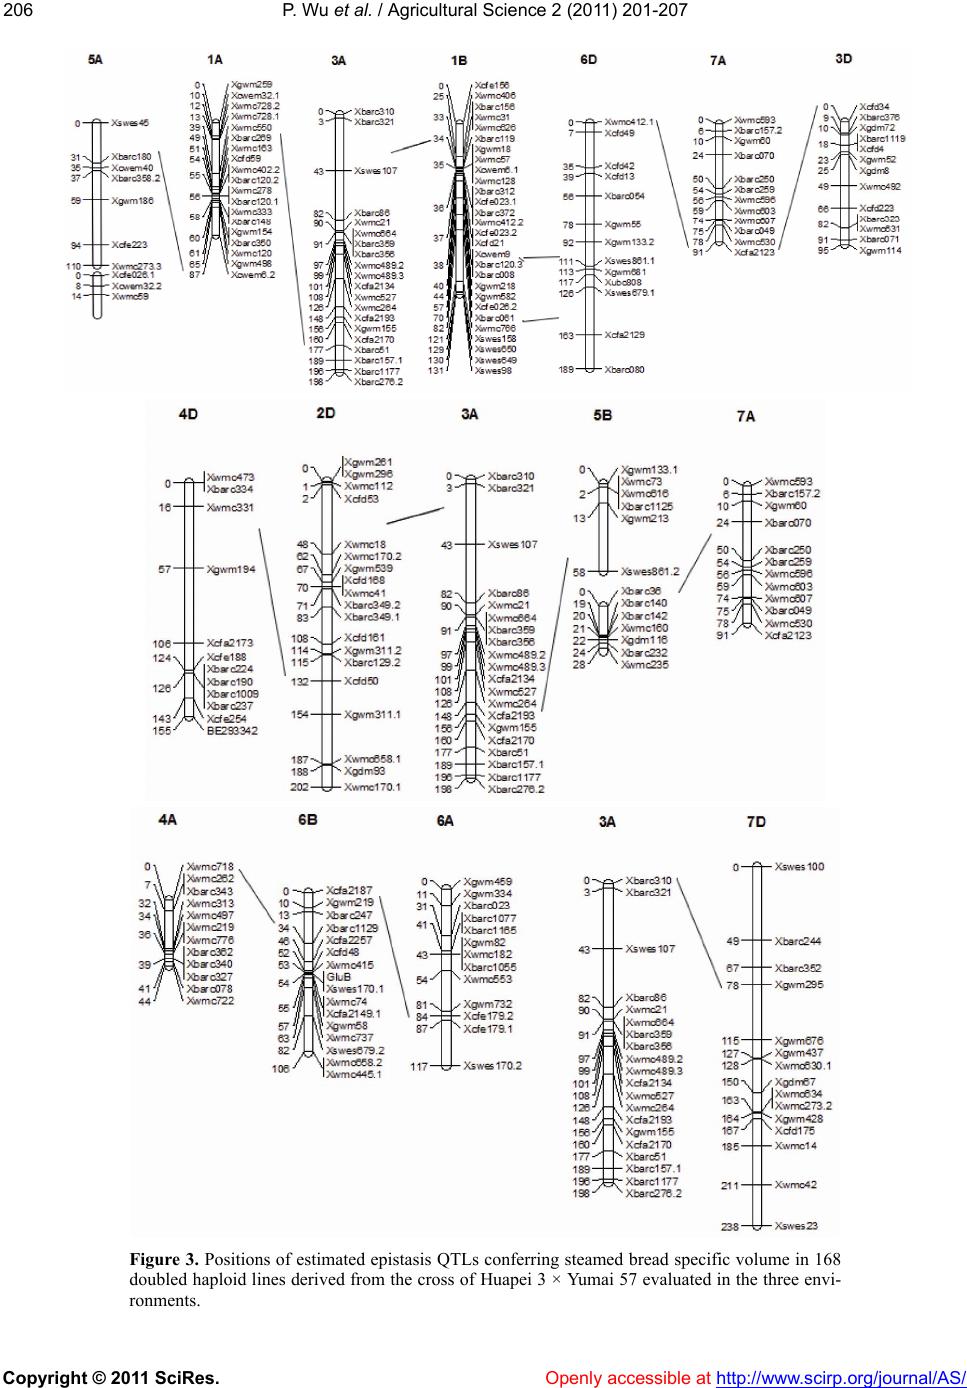 P. Wu et al. / Agricultural Science 2 (2011) 201-207 Copyright © 2011 SciRes. Openly accessible at http://www.scirp.org/journal/AS/ 206 Figure 3. Positions of estimated epistasis QTLs conferring steamed bread specific volume in 168 doubled haploid lines derived from the cross of Huapei 3 × Yumai 57 evaluated in the three envi- ronments. 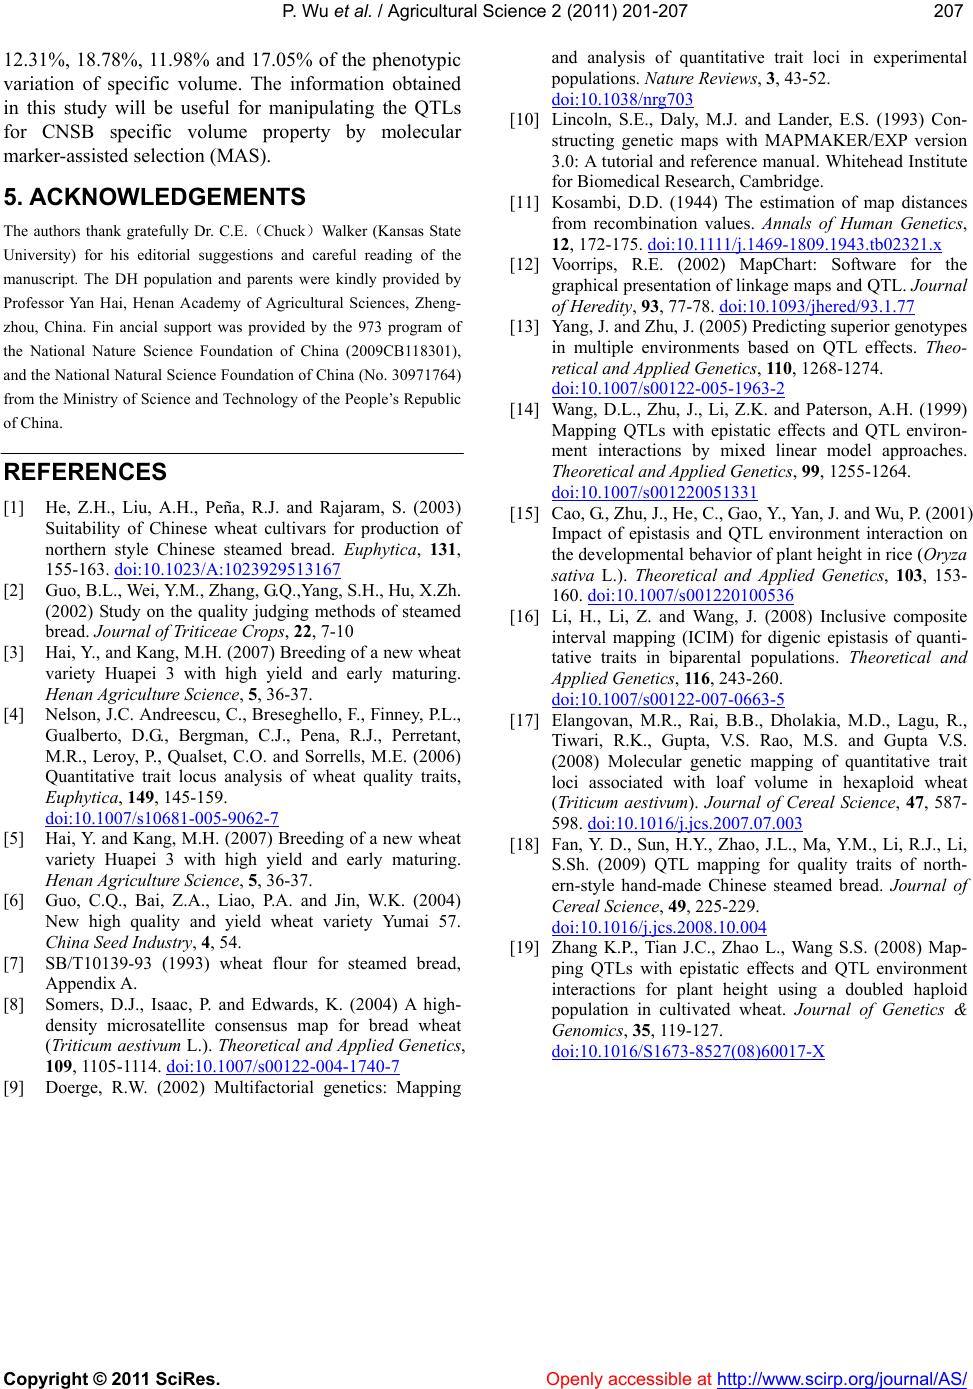 P. Wu et al. / Agricultural Science 2 (2011) 201-207 Copyright © 2011 SciRes. Openly accessible at http://www.scirp.org/journal/AS/ 207207 12.31%, 18.78%, 11.98% and 17.05% of the phenotypic variation of specific volume. The information obtained in this study will be useful for manipulating the QTLs for CNSB specific volume property by molecular marker-assisted selection (MAS). 5. ACKNOWLEDGEMENTS The authors thank gratefully Dr. C.E.(Chuck)Walker (Kansas State University) for his editorial suggestions and careful reading of the manuscript. The DH population and parents were kindly provided by Professor Yan Hai, Henan Academy of Agricultural Sciences, Zheng- zhou, China. Fin ancial support was provided by the 973 program of the National Nature Science Foundation of China (2009CB118301), and the National Natural Science Foundation of China (No. 30971764) from the Ministry of Science and Technology of the People’s Republic of China. REFERENCES [1] He, Z.H., Liu, A.H., Peña, R.J. and Rajaram, S. (2003) Suitability of Chinese wheat cultivars for production of northern style Chinese steamed bread. Euphytica, 131, 155-163. doi:10.1023/A:1023929513167 [2] Guo, B.L., Wei, Y.M., Zhang, G.Q.,Yang, S.H., Hu, X.Zh. (2002) Study on the quality judging methods of steamed bread. Journal of Triticeae Crops, 22, 7-10 [3] Hai, Y., and Kang, M.H. (2007) Breeding of a new wheat variety Huapei 3 with high yield and early maturing. Henan Agriculture Science, 5, 36-37. [4] Nelson, J.C. Andreescu, C., Breseghello, F., Finney, P.L., Gualberto, D.G., Bergman, C.J., Pena, R.J., Perretant, M.R., Leroy, P., Qualset, C.O. and Sorrells, M.E. (2006) Quantitative trait locus analysis of wheat quality traits, Euphytica, 149, 145-159. doi:10.1007/s10681-005-9062-7 [5] Hai, Y. and Kang, M.H. (2007) Breeding of a new wheat variety Huapei 3 with high yield and early maturing. Henan Agriculture Science, 5, 36-37. [6] Guo, C.Q., Bai, Z.A., Liao, P.A. and Jin, W.K. (2004) New high quality and yield wheat variety Yumai 57. China Seed Industry, 4, 54. [7] SB/T10139-93 (1993) wheat flour for steamed bread, Appendix A. [8] Somers, D.J., Isaac, P. and Edwards, K. (2004) A high- density microsatellite consensus map for bread wheat (Triticum aestivum L.). Theoretical and Applied Genetics, 109, 1105-1114. doi:10.1007/s00122-004-1740-7 [9] Doerge, R.W. (2002) Multifactorial genetics: Mapping and analysis of quantitative trait loci in experimental populations. Nature Reviews, 3, 43-52. doi:10.1038/nrg703 [10] Lincoln, S.E., Daly, M.J. and Lander, E.S. (1993) Con- structing genetic maps with MAPMAKER/EXP version 3.0: A tutorial and reference manual. Whitehead Institute for Biomedical Research, Cambridge. [11] Kosambi, D.D. (1944) The estimation of map distances from recombination values. Annals of Human Genetics, 12, 172-175. doi: 10 .1111 /j. 1469-1809.1943.tb02321.x [12] Voorrips, R.E. (2002) MapChart: Software for the graphical presentation of linkage maps and QTL. Journal of Heredity, 93, 77-78. doi:10.1093/jhered/93.1.77 [13] Yang, J. and Zhu, J. (2005) Predicting superior genotypes in multiple environments based on QTL effects. Theo- retical and Applied Genetics, 11 0, 1268-1274. doi:10.1007/s00122-005-1963-2 [14] Wang, D.L., Zhu, J., Li, Z.K. and Paterson, A.H. (1999) Mapping QTLs with epistatic effects and QTL environ- ment interactions by mixed linear model approaches. Theoretical and Applied Genetics, 99, 1255-1264. doi:10.1007/s001220051331 [15] Cao, G., Zhu, J., He, C., Ga o , Y. , Yan, J. and Wu, P. (2001) Impact of epistasis and QTL environment interaction on the developmental behavior of plant height in rice (Oryza sativa L.). Theoretical and Applied Genetics, 103, 153- 160. doi:10.1007/s001220100536 [16] Li, H., Li, Z. and Wang, J. (2008) Inclusive composite interval mapping (ICIM) for digenic epistasis of quanti- tative traits in biparental populations. Theoretical and Applied Genetics, 116, 243-260. doi:10.1007/s00122-007-0663-5 [17] Elangovan, M.R., Rai, B.B., Dholakia, M.D., Lagu, R., Tiwari, R.K., Gupta, V.S. Rao, M.S. and Gupta V.S. (2008) Molecular genetic mapping of quantitative trait loci associated with loaf volume in hexaploid wheat (Triticum aestivum). Journal of Cereal Science, 47, 587- 598. doi:10.1016/j.jcs.2007.07.003 [18] Fan, Y. D., Sun, H.Y., Zhao, J.L., Ma, Y.M., Li, R.J., Li, S.Sh. (2009) QTL mapping for quality traits of north- ern-style hand-made Chinese steamed bread. Journal of Cereal Science, 49, 225-229. doi:10.1016/j.jcs.2008.10.004 [19] Zhang K.P., Tian J.C., Zhao L., Wang S.S. (2008) Map- ping QTLs with epistatic effects and QTL environment interactions for plant height using a doubled haploid population in cultivated wheat. Journal of Genetics & Genomics, 35, 119-127. doi:10.1016/S1673-8527(08)60017-X |