

Paper Menu >>
Journal Menu >>
 Vol.2, No.3, 159-166 (2011) doi:10.4236/as.2011.23022 Copyright © 2011 SciRes. Openly accessible at http://www.scirp.org/journal/AS/ Agricultural Scienc es Response of coleoptiles to water deficit: growth, turgor maintenance and osmotic adjustment in barley plants (Hordeum vulgare L.) Águeda González1*, Luís Ayerbe2 1Departamento de Investigación Agroambiental, Alcalá de Henares, Spain; *Corresponding Author: [email protected] 2Centro de Recursos Fitogenéticos, Alcalá de Henares, Spain. Received 11 January 2011; revised 23 May 2011; accepted 25 July 2011. ABSTRACT Cereal crop improvement programmes involve the analysis of a great number of lines every year; the availability of a simple, rapid method that would allow the identification of a trait in the early stages of plant development would facilitate the selection process. This work re- ports two experiments involving the germina- tion of seeds in Petri dishes, perform ed to study the effect o f water de ficit on the gro wth of barley coleoptiles. In one experiment water stress was induced by allowing evaporation from the Petri dishes; in the other water stress was achieved by adding pol yethy lene glycol 6000. The growth of the control coleoptiles was greater than that of the treatment coleoptiles in all cases, but with differences between the dif- ferent genotypes. A significant correlation (P < 0.01) was found between the relative growth of the coleoptiles and turgor maintenance in the seedlings. Significant correlations were also seen between the relative growth of the coleop- tiles and the osmotic adjustment of the flag leaf (P < 0.05) and the grain weight (P < 0.01) in adult plants. The genotypes that showed the greatest relative growth also showed the greatest ca- pacity for osmotic adjustment in the flag leaf and produce d the grea te st y ie lds in e xperimen ts with adult plants. The results indicate that the growth of coleoptiles subjected to water deficit could be used as a selection criterion in breed- ing programmes designed to improve the tol- erance of barley to drought. Keywords: Barley; Drought Tolerance; Water Potential; Osmotic Potential; Grain Yield 1. INTRODUCTION Obtaining high, stable yields is a priority aim of cereal improvement programmes. In environments affected by drought the improvement of yield is difficult given the low heritability of this trait and because of the variable quantity and temporal distribution of soil water. The use of secondary traits, including physiological traits [1], has been proposed as a possible solution to this problem. In this approach the identification of traits that contribute towards drought tolerance and that can be used as selec- tion criteria in improvement programmes is essential for increasing selection efficiency, especially in climates in which water availability is low. Unfortunately, the majority of physiological traits as- sociated with drought tolerance that could be used as selection criteria are not easy to measure, and physio- logical screening tests are complex and slow when a large number of genotypes are involved. These problems can be minimised, however, if traits of interest can be measured in the first stages of development with plants growing in controlled environments as long as these measures are sufficiently closely correlated with drought tolerance at crop level. Under such conditions the selec- tion process can be much more quickly and efficiently undertaken—many genotypes can be studied at once and the time and space required for tests to be performed are reduced. Coleoptile length has been identified as one interesting trait for improving drought tolerance. Final coleoptile length is under the control of many genes and regulated by environment. The expression of these genes is differentially affected by the drought stress applied [2]. Heat-stress was associated with a decrease in the rate of growth and in the final length of barley and wheat col- eoptiles [3,4] Osmotic adjustment is becoming increasingly recog- nised as an efficient drought tolerance mechanism in cultivated plants [5,6], exerting a positive effect―either  Á. González et al. / Agricultural Science 2 (2011) 159-166 Copyright © 2011 SciRes. Openly accessible at http://www.scirp.org/journal/AS/ 160 directly or indirectly—on the productivity of plants that grow under drought conditions [7]. Genotypes with the ability to make osmotic adjustments produce greater yields; for example in chickpea [8,9], pea [10], sorghum [11,12], wheat [13,14], barley [15,16], sunflower [17] and potato [18] . Osmotic adjustment consists in the active accumula- tion of solutes in cells as a response to a reduction in the water potential. This leads to cells retaining water and a consequent tendency to retain their turgor pressure under water deficit. Osmotic adjustment reduces the sensitivity of processes dependent on turgor, such as growth and stomatal activity, when the water potential falls [19]. Genetic variation is essential for a trait to be used as a selection criterion in improvement programmes. The existence of intraspecific variability with respect to os- motic adjustment [6,16,17,19,20-22] and coleoptile growth [23,24] has been demonstrated in different crops. This, along with the possibility of identifying QTLs that con- trol drought tolerance in seedling [25], and coleoptile growth [26], renders the study of coleoptile growth of great interest in the improvement of drought tolerance. Differences in osmotic adjustment capacity can be measured in adult plants. However, it is not easy to measure in the very great numbers of lines that a breed- ing programme handles every year. The aims of the pre- sent work were to: 1) understand the response of differ- ent barley genotypes to water deficit in their first weeks of growth, 2) to determine whether any differences exist in the growth of coleoptiles of different barley genotypes under water deficit conditions, and 3) to study the rela- tionship between osmotic adjustment of the coleoptiles and that of adult plants. 2. MATERIALS AND METHODS 2.1. Plant Materials and Stress Treatments Eight barely genotypes were used in the present work, including three improvement lines from ICARDA (L31, L40 and L47) and five commercial varieties (Tipper, Plaisant, Viva, Reinette and Albacete). Experiments to determine the relationship between osmotic adjustment and growth were performed in a germination chamber following the method of Morgan [26]. Fourteen seeds were placed on germination paper in 13 cm-diameter Petri dishes, with six dishes per genotype (three control dishes and three treatment dishes); 22 ml of distilled water were then added to all the dishes. These dishes were then placed in a germination chamber at a constant temperature of 25˚C - 26˚C. After three days the lengths of the coleoptiles in every dish were measured. Two water deficit experiments were conducted. In the first, water deficit was induced by allowing the evapora- tion of the water from the Petri dish. After measuring the length of the coleoptiles (initial length), the Petri dish lids were left off. In the control dishes the germination paper was placed over four 1 cm-tall methacrylate sup- ports, and water added beneath the paper to help main- tain the moisture level. These control dishes were then placed once again in the germination chamber for 48 h at 26˚C and at 90% relative humidity (RH). The germina- tion paper was mounted in the same fashion in the treatment dishes, but these received no extra water. These plates were then placed in a germination chamber for 48 h at 26˚C and at 70% RH. The lengths of the col- eoptiles of both the treatment and control plants were then measured once more (final length). In the second experiment, water deficit was induced by the addition of PEG (PEG-6000). Twenty millilitres of distilled water were added to each of the control dishes, while 20 ml of PEG (30% p/v) were added to the treatment dishes. All these plates were then introduced into a germination chamber for 48 h at 26˚C before mea- suring the coleoptiles again. Relative growth was calculated as follows: (final length - initial length)/initial length. 2.2. Measurements of Physiological Parameters The stress suffered by the plants was determined by measuring the water potential ( ) and osmotic potential ( s) using two coleoptiles from each dish. When the final length was obtained, they were placed in hygrome- try chambers following the same procedure employed with adult plants [16]. Rectangular sections of the col- eoptiles (5.7 cm2) were placed inside separate psy- chrometer chambers. The closed chambers were allowed to equilibrate in a water bath at 25˚C for 3 h. Measure- ments of of the tissue were then made using a ther- mocouple hygrometer (Wescor model C-52, Logan, UT, USA) in dew point mode. The chambers containing the samples were then placed in a freezer at –20˚C for 2 h. After thawing and equilibrating at 25˚C for 3 h, the s was determined. The turgor potential ( t) was calculated as the difference between and s. 2.3. Traits Associated with the Adult Plants The data for the adult plants used in this work are mean values for four years obtained during assays per- formed in a rain shelter, with plants growing under ter- minal water deficit conditions [27]. The rain shelter was divided into two areas (irrigated and water deficit condi- tions) separated by a 1.5 m wide central corridor. In the water deficit plots, each genotype was deprived of water when the plants reached the flag leaf stage, stage 41 on 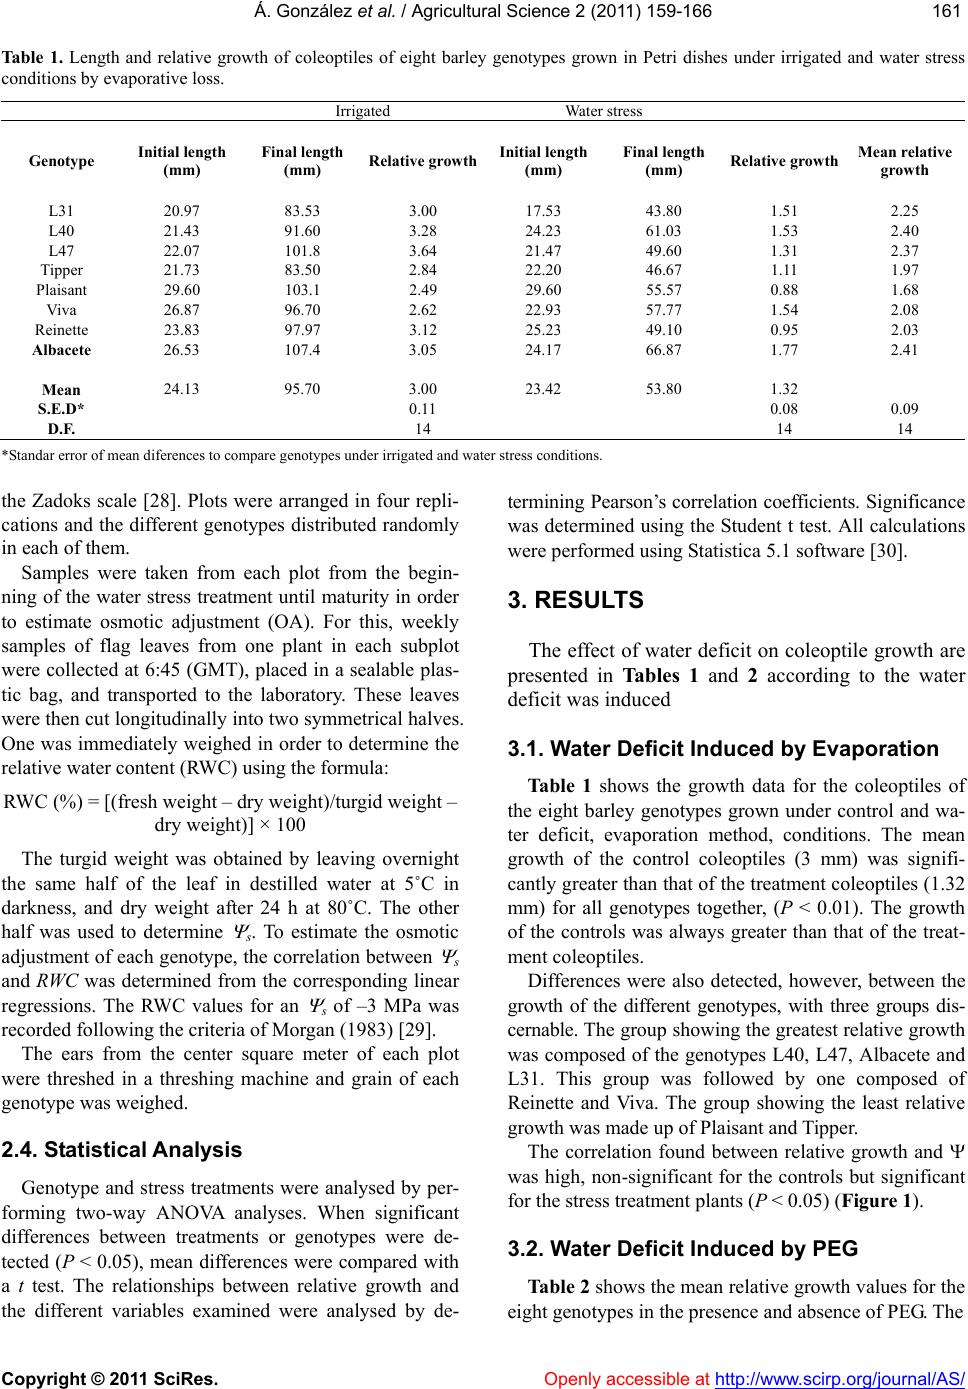 Á. González et al. / Agricultural Science 2 (2011) 159-166 Copyright © 2011 SciRes. http://www.scirp.org/journal/AS/Openly accessible at 161161 Ta b le 1 . Length and relative growth of coleoptiles of eight barley genotypes grown in Petri dishes under irrigated and water stress conditions by evaporative loss. Irrigated Water stress Genotype Initial length (mm) Final length (mm) Relative growthInitial length (mm) Final length (mm) Relative growth Mean relative growth L31 20.97 83.53 3.00 17.53 43.80 1.51 2.25 L40 21.43 91.60 3.28 24.23 61.03 1.53 2.40 L47 22.07 101.8 3.64 21.47 49.60 1.31 2.37 Tipper 21.73 83.50 2.84 22.20 46.67 1.11 1.97 Plaisant 29.60 103.1 2.49 29.60 55.57 0.88 1.68 Viva 26.87 96.70 2.62 22.93 57.77 1.54 2.08 Reinette 23.83 97.97 3.12 25.23 49.10 0.95 2.03 Albacete 26.53 107.4 3.05 24.17 66.87 1.77 2.41 Mean 24.13 95.70 3.00 23.42 53.80 1.32 S.E.D* 0.11 0.08 0.09 D.F. 14 14 14 *Standar error of mean diferences to compare genotypes under irrigated and water stress conditions. the Zadoks scale [28]. Plots were arranged in four repli- cations and the different genotypes distributed randomly in each of them. Samples were taken from each plot from the begin- ning of the water stress treatment until maturity in order to estimate osmotic adjustment (OA). For this, weekly samples of flag leaves from one plant in each subplot were collected at 6:45 (GMT), placed in a sealable plas- tic bag, and transported to the laboratory. These leaves were then cut longitudinally into two symmetrical halves. One was immediately weighed in order to determine the relative water content (RWC) using the formula: RWC (%) = [(fresh weight – dry weight)/turgid weight – dry weight)] × 100 The turgid weight was obtained by leaving overnight the same half of the leaf in destilled water at 5˚C in darkness, and dry weight after 24 h at 80˚C. The other half was used to determine s. To estimate the osmotic adjustment of each genotype, the correlation between s and RWC was determined from the corresponding linear regressions. The RWC values for an s of –3 MPa was recorded following the criteria of Morgan (1983) [29]. The ears from the center square meter of each plot were threshed in a threshing machine and grain of each genotype was weighed. 2.4. Statistical Analysis Genotype and stress treatments were analysed by per- forming two-way ANOVA analyses. When significant differences between treatments or genotypes were de- tected (P < 0.05), mean differences were compared with a t test. The relationships between relative growth and the different variables examined were analysed by de- termining Pearson’s correlation coefficients. Significance was determined using the Student t test. All calculations were performed using Statistica 5.1 software [30]. 3. RESULTS The effect of water deficit on coleoptile growth are presented in Tables 1 and 2 according to the water deficit was induced 3.1. Water Deficit Induced by Evaporation Ta ble 1 shows the growth data for the coleoptiles of the eight barley genotypes grown under control and wa- ter deficit, evaporation method, conditions. The mean growth of the control coleoptiles (3 mm) was signifi- cantly greater than that of the treatment coleoptiles (1.32 mm) for all genotypes together, (P < 0.01). The growth of the controls was always greater than that of the treat- ment coleoptiles. Differences were also detected, however, between the growth of the different genotypes, with three groups dis- cernable. The group showing the greatest relative growth was composed of the genotypes L40, L47, Albacete and L31. This group was followed by one composed of Reinette and Viva. The group showing the least relative growth was made up of Plaisant and Tipper. The correlation found between relative growth and was high, non-significant for the controls but significant for the stress treatment plants (P < 0.05) (Figure 1). 3.2. Water Deficit Induced by PEG Table 2 shows the mean relative growth values for the ight genotypes in the presence and absence of PEG. The e 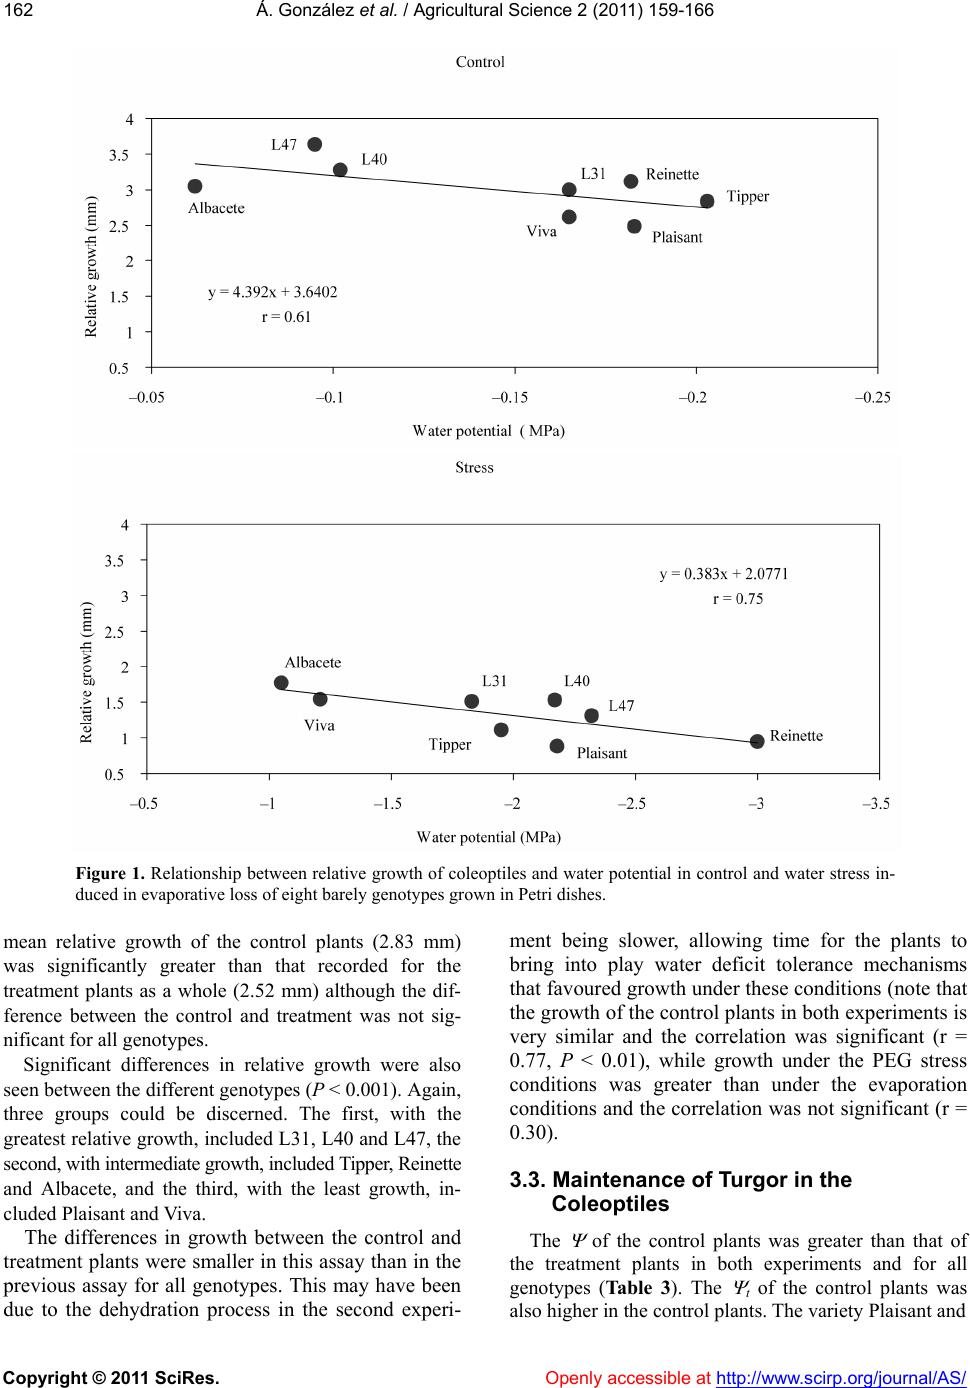 Á. González et al. / Agricultural Science 2 (2011) 159-166 Copyright © 2011 SciRes. Openly accessible at http://www.scirp.org/journal/AS/ 162 Figure 1. Relationship between relative growth of coleoptiles and water potential in control and water stress in- duced in evaporative loss of eight barely genotypes grown in Petri dishes. mean relative growth of the control plants (2.83 mm) was significantly greater than that recorded for the treatment plants as a whole (2.52 mm) although the dif- ference between the control and treatment was not sig- nificant for all genotypes. Significant differences in relative growth were also seen between the different genotypes (P < 0.001). Again, three groups could be discerned. The first, with the greatest relative growth, included L31, L40 and L47, the second, with intermediate growth, included Tipper, Reinette and Albacete, and the third, with the least growth, in- cluded Plaisant and Viva. The differences in growth between the control and treatment plants were smaller in this assay than in the previous assay for all genotypes. This may have been due to the dehydration process in the second experi- ment being slower, allowing time for the plants to bring into play water deficit tolerance mechanisms that favoured growth under these conditions (note that the growth of the control plants in both experiments is very similar and the correlation was significant (r = 0.77, P < 0.01), while growth under the PEG stress conditions was greater than under the evaporation conditions and the correlation was not significant (r = 0.30). 3.3. Maintenance of Turgor in the Coleoptiles The of the control plants was greater than that of the treatment plants in both experiments and for all genotypes (Table 3). The t of the control plants was lso higher in the control plants. The variety Plaisant and a 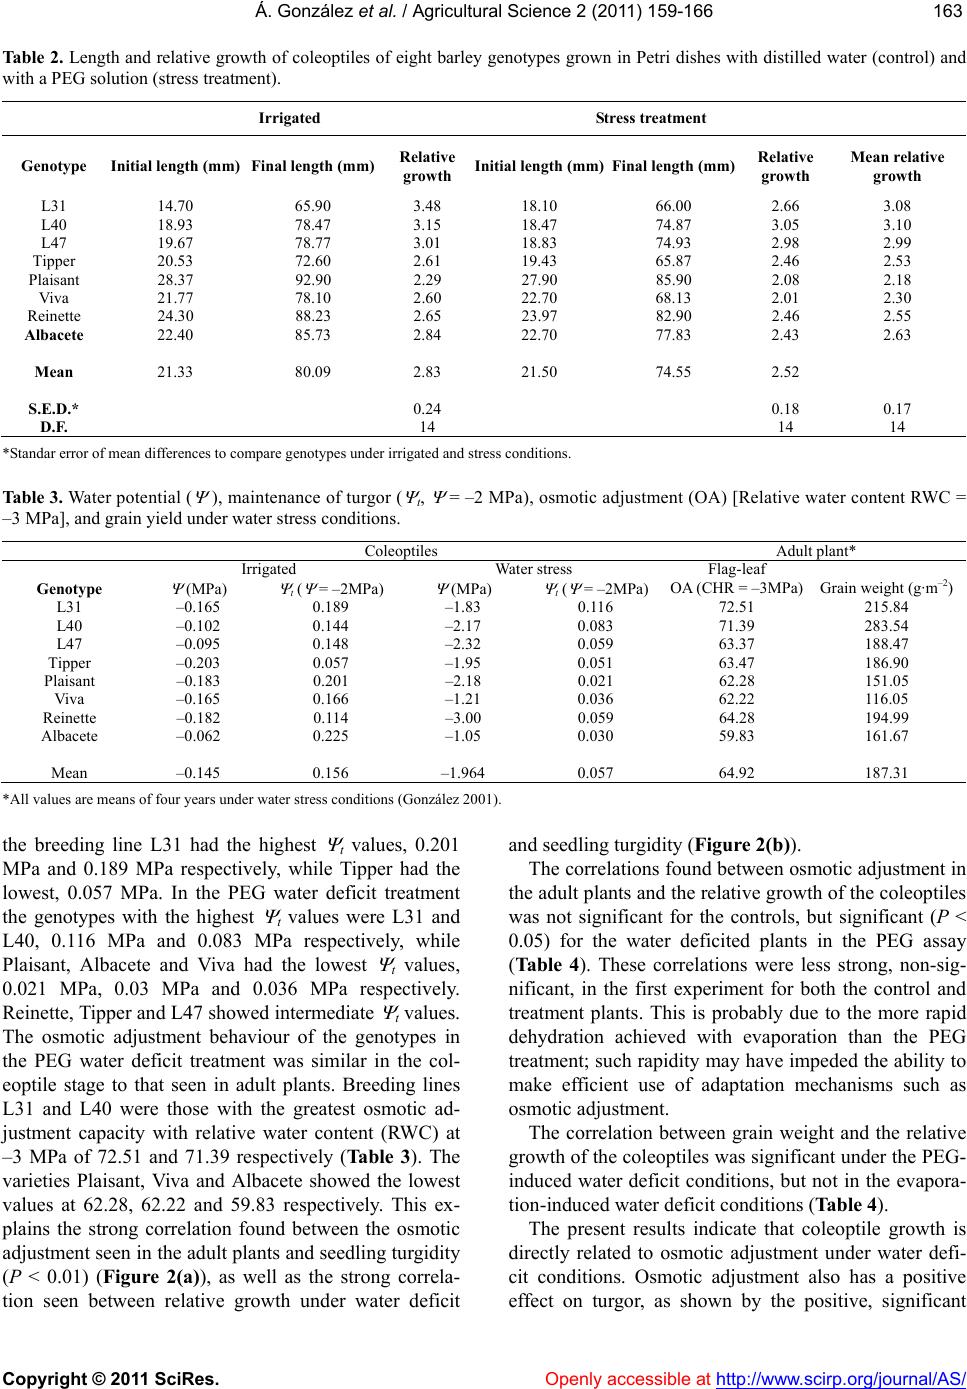 Á. González et al. / Agricultural Science 2 (2011) 159-166 Copyright © 2011 SciRes. Openly accessible at http://www.scirp.org/journal/AS/ 163163 Tab le 2. Length and relative growth of coleoptiles of eight barley genotypes grown in Petri dishes with distilled water (control) and with a PEG solution (stress treatment). Irrigated Stress treatment Genotype Initial length (mm)Final length (mm) Relative growth Initial length (mm)Final length (mm) Relative growth Mean relative growth L31 14.70 65.90 3.48 18.10 66.00 2.66 3.08 L40 18.93 78.47 3.15 18.47 74.87 3.05 3.10 L47 19.67 78.77 3.01 18.83 74.93 2.98 2.99 Tipper 20.53 72.60 2.61 19.43 65.87 2.46 2.53 Plaisant 28.37 92.90 2.29 27.90 85.90 2.08 2.18 Viva 21.77 78.10 2.60 22.70 68.13 2.01 2.30 Reinette 24.30 88.23 2.65 23.97 82.90 2.46 2.55 Albacete 22.40 85.73 2.84 22.70 77.83 2.43 2.63 Mean 21.33 80.09 2.83 21.50 74.55 2.52 S.E.D.* 0.24 0.18 0.17 D.F. 14 14 14 *Standar error of mean differences to compare genotypes under irrigated and stress conditions. Table 3. Water potential ( ), maintenance of turgor ( t, = –2 MPa), osmotic adjustment (OA) [Relative water content RWC = –3 MPa], and grain yield under water stress conditions. Coleoptiles Adult plant* Irrigated Water stress Flag-leaf Genotype (MPa) t ( = –2MPa) (MPa) t ( = –2MPa) OA (CHR = –3MPa) Grain weight (g·m–2) L31 –0.165 0.189 –1.83 0.116 72.51 215.84 L40 –0.102 0.144 –2.17 0.083 71.39 283.54 L47 –0.095 0.148 –2.32 0.059 63.37 188.47 Tipper –0.203 0.057 –1.95 0.051 63.47 186.90 Plaisant –0.183 0.201 –2.18 0.021 62.28 151.05 Viva –0.165 0.166 –1.21 0.036 62.22 116.05 Reinette –0.182 0.114 –3.00 0.059 64.28 194.99 Albacete –0.062 0.225 –1.05 0.030 59.83 161.67 Mean –0.145 0.156 –1.964 0.057 64.92 187.31 *All values are means of four years under water stress conditions (González 2001). the breeding line L31 had the highest t values, 0.201 MPa and 0.189 MPa respectively, while Tipper had the lowest, 0.057 MPa. In the PEG water deficit treatment the genotypes with the highest t values were L31 and L40, 0.116 MPa and 0.083 MPa respectively, while Plaisant, Albacete and Viva had the lowest t values, 0.021 MPa, 0.03 MPa and 0.036 MPa respectively. Reinette, Tipper and L47 showed intermediate t values. The osmotic adjustment behaviour of the genotypes in the PEG water deficit treatment was similar in the col- eoptile stage to that seen in adult plants. Breeding lines L31 and L40 were those with the greatest osmotic ad- justment capacity with relative water content (RWC) at –3 MPa of 72.51 and 71.39 respectively (Ta b l e 3 ). The varieties Plaisant, Viva and Albacete showed the lowest values at 62.28, 62.22 and 59.83 respectively. This ex- plains the strong correlation found between the osmotic adjustment seen in the adult plants and seedling turgidity (P < 0.01) (Figure 2(a)), as well as the strong correla- tion seen between relative growth under water deficit and seedling turgidity (Figure 2(b)). The correlations found between osmotic adjustment in the adult plants and the relative growth of the coleoptiles was not significant for the controls, but significant (P < 0.05) for the water deficited plants in the PEG assay (Ta ble 4 ). These correlations were less strong, non-sig- nificant, in the first experiment for both the control and treatment plants. This is probably due to the more rapid dehydration achieved with evaporation than the PEG treatment; such rapidity may have impeded the ability to make efficient use of adaptation mechanisms such as osmotic adjustment. The correlation between grain weight and the relative growth of the coleoptiles was significant under the PEG- induced water deficit conditions, but not in the evapora- tion-induced water deficit conditions (Table 4). The present results indicate that coleoptile growth is directly related to osmotic adjustment under water defi- cit conditions. Osmotic adjustment also has a positive ffect on turgor, as shown by the positive, significant e 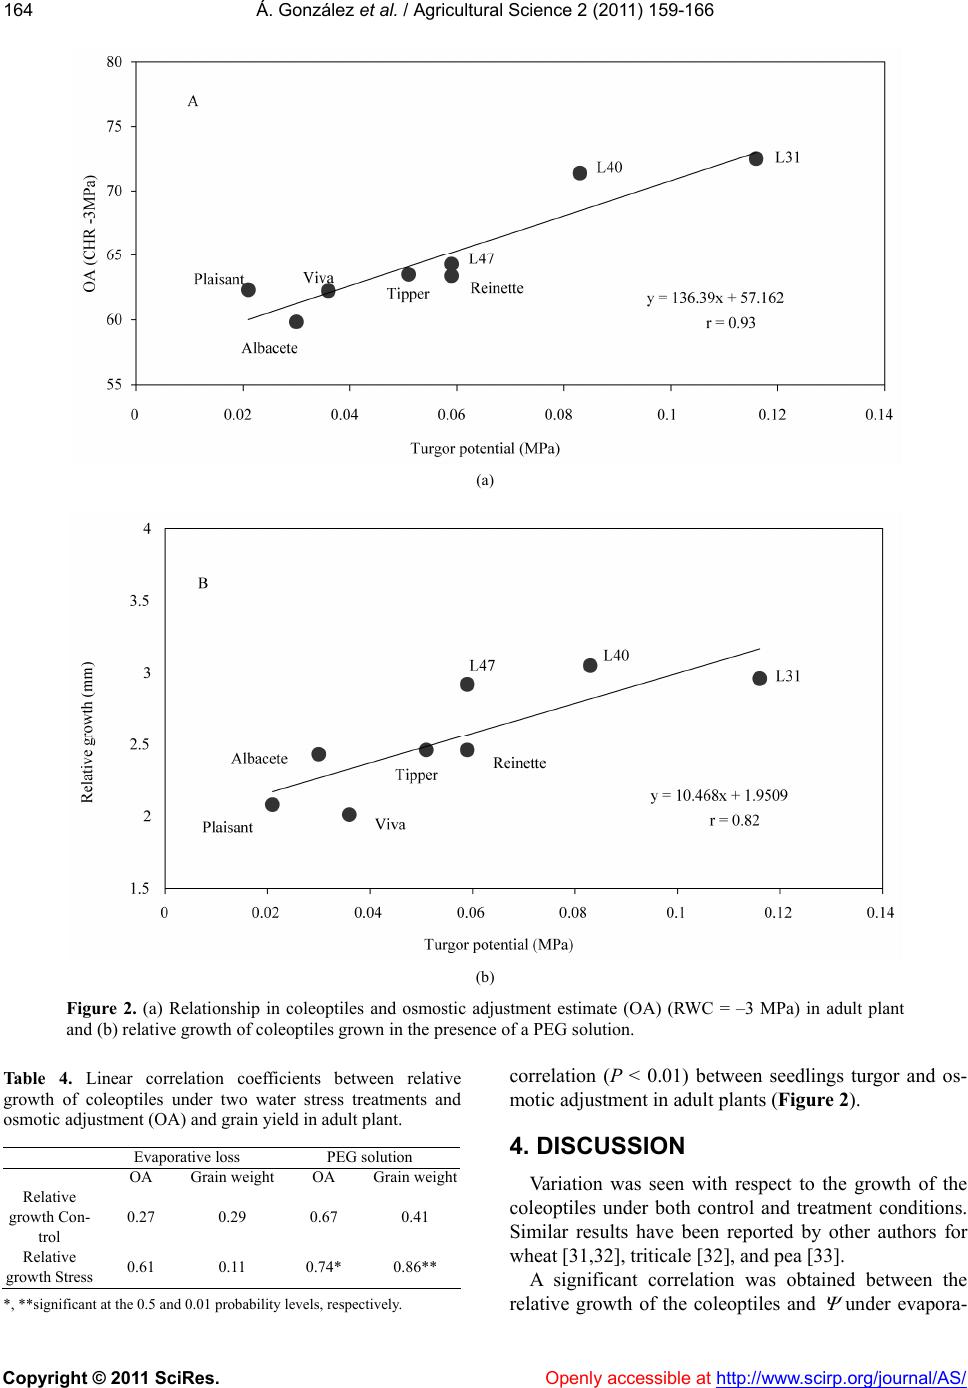 Á. González et al. / Agricultural Science 2 (2011) 159-166 Copyright © 2011 SciRes. Openly accessible at http://www.scirp.org/journal/AS/ 164 (a) (b) Figure 2. (a) Relationship in coleoptiles and osmostic adjustment estimate (OA) (RWC = –3 MPa) in adult plant and (b) relative growth of coleoptiles grown in the presence of a PEG solution. Table 4. Linear correlation coefficients between relative growth of coleoptiles under two water stress treatments and osmotic adjustment (OA) and grain yield in adult plant. Evaporative loss PEG solution OA Grain weight OA Grain weight Relative growth Con- trol 0.27 0.29 0.67 0.41 Relative growth Stress 0.61 0.11 0.74* 0.86** *, **significant at the 0.5 and 0.01 probability levels, respectively. correlation (P < 0.01) between seedlings turgor and os- motic adjustment in adult plants (Figur e 2). 4. DISCUSSION Variation was seen with respect to the growth of the coleoptiles under both control and treatment conditions. Similar results have been reported by other authors for wheat [31,32], triticale [32], and pea [33]. A significant correlation was obtained between the relative growth of the coleoptiles and under evapora- 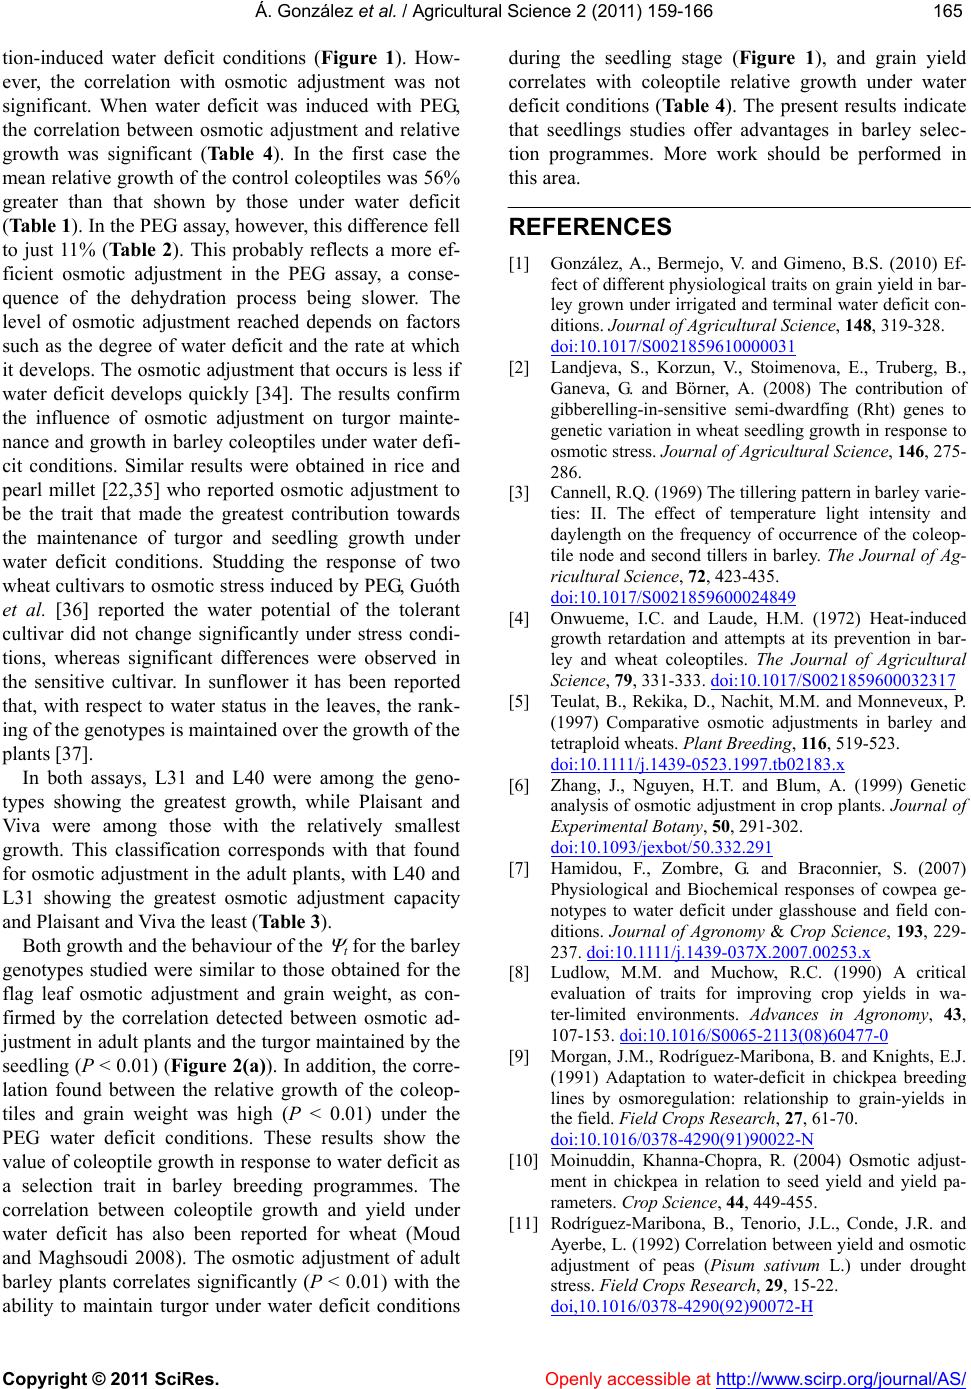 Á. González et al. / Agricultural Science 2 (2011) 159-166 Copyright © 2011 SciRes. Openly accessible at http://www.scirp.org/journal/AS/ 165165 tion-induced water deficit conditions (Figure 1). How- ever, the correlation with osmotic adjustment was not significant. When water deficit was induced with PEG, the correlation between osmotic adjustment and relative growth was significant (Table 4). In the first case the mean relative growth of the control coleoptiles was 56% greater than that shown by those under water deficit (Table 1). In the PEG assay, however, this difference fell to just 11% (Ta ble 2 ). This probably reflects a more ef- ficient osmotic adjustment in the PEG assay, a conse- quence of the dehydration process being slower. The level of osmotic adjustment reached depends on factors such as the degree of water deficit and the rate at which it develops. The osmotic adjustment that occurs is less if water deficit develops quickly [34]. The results confirm the influence of osmotic adjustment on turgor mainte- nance and growth in barley coleoptiles under water defi- cit conditions. Similar results were obtained in rice and pearl millet [22,35] who reported osmotic adjustment to be the trait that made the greatest contribution towards the maintenance of turgor and seedling growth under water deficit conditions. Studding the response of two wheat cultivars to osmotic stress induced by PEG, Guóth et al. [36] reported the water potential of the tolerant cultivar did not change significantly under stress condi- tions, whereas significant differences were observed in the sensitive cultivar. In sunflower it has been reported that, with respect to water status in the leaves, the rank- ing of the genotypes is maintained over the growth of the plants [37]. In both assays, L31 and L40 were among the geno- types showing the greatest growth, while Plaisant and Viva were among those with the relatively smallest growth. This classification corresponds with that found for osmotic adjustment in the adult plants, with L40 and L31 showing the greatest osmotic adjustment capacity and Plaisant and Viva the least (Table 3). Both growth and the behaviour of the t for the barley genotypes studied were similar to those obtained for the flag leaf osmotic adjustment and grain weight, as con- firmed by the correlation detected between osmotic ad- justment in adult plants and the turgor maintained by the seedling (P < 0.01) (Figure 2(a)). In addition, the corre- lation found between the relative growth of the coleop- tiles and grain weight was high (P < 0.01) under the PEG water deficit conditions. These results show the value of coleoptile growth in response to water deficit as a selection trait in barley breeding programmes. The correlation between coleoptile growth and yield under water deficit has also been reported for wheat (Moud and Maghsoudi 2008). The osmotic adjustment of adult barley plants correlates significantly (P < 0.01) with the ability to maintain turgor under water deficit conditions during the seedling stage (Figure 1), and grain yield correlates with coleoptile relative growth under water deficit conditions (Ta ble 4 ). The present results indicate that seedlings studies offer advantages in barley selec- tion programmes. More work should be performed in this area. REFERENCES [1] González, A., Bermejo, V. and Gimeno, B.S. (2010) Ef- fect of different physiological traits on grain yield in bar- ley grown under irrigated and terminal water deficit con- ditions. Journal of Agric ultural Science, 148, 319-328. doi:10.1017/S0021859610000031 [2] Landjeva, S., Korzun, V., Stoimenova, E., Truberg, B., Ganeva, G. and Börner, A. (2008) The contribution of gibberelling-in-sensitive semi-dwardfing (Rht) genes to genetic variation in wheat seedling growth in response to osmotic stress. Journal of Agricultural S ci e nce, 146, 275- 286. [3] Cannell, R.Q. (1969) The tillering pattern in barley varie- ties: II. The effect of temperature light intensity and daylength on the frequency of occurrence of the coleop- tile node and second tillers in barley. The Journal of Ag- ricultural Scienc e, 72, 423-435. doi:10.1017/S0021859600024849 [4] Onwueme, I.C. and Laude, H.M. (1972) Heat-induced growth retardation and attempts at its prevention in bar- ley and wheat coleoptiles. The Journal of Agricultural Science, 79, 331-333. doi:10.1017/S0021859600032317 [5] Teulat, B., Rekika, D., Nachit, M.M. and Monneveux, P. (1997) Comparative osmotic adjustments in barley and tetraploid wheats. Plant Breeding, 116, 519-523. doi:10.1111/j.1439-0523.1997.tb02183.x [6] Zhang, J., Nguyen, H.T. and Blum, A. (1999) Genetic analysis of osmotic adjustment in crop plants. Journal of Experimental Botany, 50, 291-302. doi:10.1093/jexbot/50.332.291 [7] Hamidou, F., Zombre, G. and Braconnier, S. (2007) Physiological and Biochemical responses of cowpea ge- notypes to water deficit under glasshouse and field con- ditions. Journal of Agronomy & Crop Science, 193, 229- 237. doi:10.1111/j.1439-037X.2007.00253.x [8] Ludlow, M.M. and Muchow, R.C. (1990) A critical evaluation of traits for improving crop yields in wa- ter-limited environments. Advances in Agronomy, 43, 107-153. doi:10.1016/S0065-2113(08)60477-0 [9] Morgan, J.M., Rodríguez-Maribona, B. and Knights, E.J. (1991) Adaptation to water-deficit in chickpea breeding lines by osmoregulation: relationship to grain-yields in the field. F i e ld C rops Research, 27, 61-70. doi:10.1016/0378-4290(91)90022-N [10] Moinuddin, Khanna-Chopra, R. (2004) Osmotic adjust- ment in chickpea in relation to seed yield and yield pa- rameters. Crop Science, 44, 449-455. [11] Rodríguez-Maribona, B., Tenorio, J.L., Conde, J.R. and Ayerbe, L. (1992) Correlation between yield and osmotic adjustment of peas (Pisum sativum L.) under drought stress. Field Crops Research, 29, 15-22. doi,10.1016/0378-4290(92)90072-H  Á. González et al. / Agricultural Science 2 (2011) 159-166 Copyright © 2011 SciRes. http://www.scirp.org/journal/AS/Openly accessible at 166 [12] Ludlow, M.M., Santamaria, J.M. and Fukai, S. (1990) Contribution of osmotic adjustment to grain yield in Sorghum bicolor (L.) moench under water-limited condi- tions. II. Water deficit after anthesis. Australian Journal of Agricultural Research, 41, 67-78. doi:10.1071/AR9900067 [13] Santamaria, J.M., Ludlow, M.M. and Fukai, S. (1990) Contribution of osmotic adjustment to grain yield in Sorghum bicolor (L.) moench under water-limited condi- tions. I. Water deficit before anthesis. Australian Journal of Agricultural Research, 41, 51-65. doi:10.1071/AR9900051 [14] Morgan, J.M. (1995) Growth and yield of wheat lines with differing osmoregulative capacity at high soil water deficit in seasons of varying evaporative demand. Field Crops Research, 40, 143-152. doi:10.1016/0378-4290(94)00100-Q [15] Blum, A., Zhang, J. and Nguyen, H.T. (1999) Consistent differences among wheat cultivars in osmotic adjustment and their relationship to plant production. Field Crops Research, 64, 287-291. doi:10.1016/S0378-4290(99)00064-7 [16] González, A., Martín, I. and Ayerbe, L. (1999) Barley yield in water-stress conditions. The influence of precoc- ity, osmotic adjustment and stomatal conductance. Field Crops Research, 62, 23-34. doi:10.1016/S0378-4290(99)00002-7 [17] González, A., Martín, I. and Ayerbe, L. (2008) Yield and osmotic adjustment capacity of barley under terminal water deficit conditions. Journal of Agronomy & Crop Science, 194, 81-91. doi:10.1111/j.1439-037X.2007.00289.x [18] Chimenti, C.A., Pearson, J. and Hall, A.J. (2002) Os- motic adjustment and yield maintenance under drought in sunflower. Field Crops Research, 75, 235-246. doi:10.1016/S0378-4290(02)00029-1 [19] Daneshmand, F., Harvin, M.J. and Kalantari, K.M. (2010) Physiological responses to NaCl stress in three wild spe- cies of potato in vitro. Acta Physiologiae Plantarum, 32, 91-101. doi:10.1007/s11738-009-0384-2 [20] Morgan, J.M. (1984) Osmoregulation and water deficit in higher plants. Annual Review of Plant Physiology, 35, 299-319. doi:10.1146/annurev.pp.35.060184.001503 [21] Blum, A. (1989) Osmotic adjustment and growth of bar- ley genotypes under drought stress. Crop Science, 29, 230-233. doi:10.2135/cropsci1989.0011183X002900010052x [22] Basu, S., Roychoudhury, A., Saha, P.P. and Sengupta, D.N. (2010) Comparative analysis of some biochemical responses of three indica rice varieties during polyethyl- ene glycol-mediated water stress exhibits distinct varietal differences. Acta Physiologiae Plantarum, 32, 551- 563. doi:10.1007/s11738-009-0432-y [23] Moud, A.M. and Maghsoudi, K. (2008) Application of coleoptile growth response method to differentiate os- moregulation capability of wheat (Triticum aestivum L.) cultivars. Research Journal of Agronomy, 2, 36-43. [24] Murphy, K., Balow, K., Lyon, S.R. and Jones, S.S. (2008) Response to selection, combining ability and heritability of coleoptile length in winter wheat. Euphytica, 164, 709-718. doi:10.1007/s10681-008-9692-7 [25] Kato, Y., Hirotsu, S., Yamagishi, J. and Nemoto, K. (2008) Identification of QTLs controlling rice drought tolerance at seedling stage in hydroponic culture. Euphy- tica, 160, 423-430. doi:10.1007/s10681-007-9605-1 [26] Rebetzke, G., Ellis, M., Bonnett, D. and Richards, R. (2007) Molecular mapping of genes for coleoptile growth in bread wheat (Triticum aestivum L.). Theorical and Applied Genetics, 11 4, 1173-1183. doi:10.1007/s00122-007-0509-1 [27] Morgan, J.M. (1988) The use of coleoptile responses to water deficit to differentiate wheat genotypes for osmo- regulation, growth and yield. Annals of Botany, 62, 193-198. [28] González, A. (2001) Estudio de caracteres fenológicos, agronómicos, morfológicos y fisiológicos en relación con tolerancia al estrés hídrico en cebada. Ph.D. Thesis, Uni- versidad Complutense, Madrid. [29] Zadoks, J.C., Chang, T.T. and Kozank, C.F. (1974) A decimal code for the growth stages of cereals. Weed Re- search, 14, 415-421. doi:10.1111/j.1365-3180.1974.tb01084.x [30] Morgan, J.M., 1983, Osmoregulation as a selection crite- rion for drought tolerance in wheat. Australian Journal of Agricultural Research, 34, 607-614. doi:10.1071/AR9830607 [31] Dhanda, S.S., Sethi, G.S. and Behl, R.K.(2004) Indices of drought tolerance in wheat genotypes at early stages of plant growth. Journal of Agronomy & Crop Science, 190, 6-12. [32] Yagmur, M. and Kaydan, D. (2008) Early seedling growth and relative water content of triticale varieties under osmotic stress of water and NaCl. Research Jour- nal of Agriculture and Biological Sciences, 4, 767-772. [33] Sánchez, F.J., de Andrés, E.F., Tenorio, J.L. and Ayerbe, L. (2004) Growth of epicotyls, turgor maintenance and osmotic adjustment in pea plants (Pisum sativum L.) sub- jected to water deficit. Field Crops Research, 86, 81-90. doi:10.1016/S0378-4290(03)00121-7 [34] Turner, N.C. and Jones, M.M. (1980) Turgor mainte- nance by osmotic adjustment: A review and evaluation. In: Turner, N.C. and Kramer, P.J., Eds., Adaptation of plants to water and high temperature stress, John Wiley & Sons, Hoboken, 87-104. [35] Kusaka, M., Garcia Lalusin, A. and Fujimura, T. (2005) The maintenance of growth and turgor in pearl millet (Pennisetum glaucum L.) cultivars with different root structures and osmo-regulation under drought stress. Plant Science, 168, 1-14. doi:10.1016/j.plantsci.2004.06.021 [36] Guóth, A., Benyó, D., Csiszár, J., Gallé, A., Horváth, F., Cseuz, L., Erdei, L. and Tari, I. (2010) Relationship be- tween osmotic stress-induced abscisic acid accumulation, biomass production and plant growth in drought-tolerant and sensitive wheat cultivars. Acta Physiologiae Planta- rum, 32, 719-727. doi:10.1007/s11738-009-0453-6 [37] Chimenti, C.A. and Hall, A.J. (1993) Genetic variation and changes with ontogeny of osmotic adjustment in sun- flower (Helianthus annuus L.). Euphytica, 71, 201-210. doi:10.1007/BF00040409 |