

Paper Menu >>
Journal Menu >>
 Vol.2, No.3, 334-340 (2011) doi:10.4236/as.2011.23044 Copyright © 2011 SciRes. Openly accessible at http://www.scirp.org/journal/AS/ Agricultural Scienc es Effects of tillage, fallow and burning on selected properties and fertility status of Andosols in the Mounts Bambouto, W est Cameroon Paul Tematio1*, Ertine Isabelle Tsafack2, Lucas Kengni2 1Department of Earth Science, University of Dschang, Dschang, Cameroon; *Corresponding Author: [email protected] 2Department of Earth Science, University of Dschang, Dschang, Cameroon. Received 28 January 2011; revised 23 May 2011; accepted 7 July 2011. ABSTRACT To assess the imp act of land u se on the Andosol fertility, changes in chemical and physical pro- perties affecting soil quality were monitored on Andosols from Mount Bambouto submitted to four different land uses and management sys- tems: natural cover, tillage, burning and fallow. In comparison with the natural cover, tillage reduces Andosol OC (6.5% to 4.8%), total N (4.51‰ to 2.95‰), CEC (22.0 to 20.9 cmol·kg–1) and the abundance of soil macro-aggregates expressed by the water stable aggregates (WSA) varies from 53.8% to 12.0%; and increases the bulk density (0.69 to 1.09 g·cm–3) and the sum of exchangeable cations (3.58 to 4.84 cmol·kg–1). Burning also reduces Andosol OC (6.5% to 0.8%), total N (4.51‰ to 0.95‰) and CEC (22.0 to 10.2 cmol·kg–1), but increases soil pH (4.62 to 6.54), the sum of exchangeable cations (3.58 to 5.74 cmol·kg–1) and the abundance of soil macro-aggregates (WSA: 38.2% to 57.0%). In comparison with tillage, fallow increases An- dosol OC (4.8% to 6.5%), total N (2.95‰ to 5.04‰), CEC (18.0 to 21.6 cmol·kg–1), the sum of exchangeable cations (3.58 to 5.05 cmol·kg–1) and the abundance of soil macro-aggregates (WSA: 12.0% to 48.8%). Globally, the tillage man- agement deteriorates Andosol chemical and physical properties affecting fertility, whereas the fallow management restores them. The burning management also improves some An- dosol chemical and physical properties affect- ing quality, but it won’t last long. Keywords: Andosols; Land Use Management Systems; Soil Physic-Chemical Properties; Soil Fertility 1. INTRODUCTION Soil quality is fundamental for sustainable agriculture development [1]. The land use and management systems strongly influence soil quality expressed by changes in soil chemical and physical properties (organic matter content, CEC, sum of exchangeable cations, acidity, bulk density, aggregates stability, etc.). Thus, improper land use and management systems reduce soil fertility and the subsequent food security [2]. Many studies on soil fertil- ity have focused mainly on nutrients budget and bal- ances [3,4] without emphasis on changes in soil chemi- cal and physical properties affecting soil quality over time. In Mount Bambouto, a volcanic mountain of the West Cameroon Highlands where Andosols are widespread [5] (Figure 1), strong human pressures on lands expressed by the tillage and burning management systems have affected the agro-ecosystems over the past 30 years [6]. One of the consequences is the overexploitation of soil resources with subsequent crop yields decrease. Consid- ering the precarious conditions of Andosols character- ized by a rapid degradation of the majority of their chemical and physical properties when farming, new strategies for sustainable management of Andosols in this area have to be found urgently. Therefore, it might be useful to identify the land use and management sys- tems impacts on Andosol fertility in Mount Bambouto. The main objective of this study is to quantify changes in chemical and physical properties of the Andosols from Mount Bambouto submitted to tillage, burning or fallow management systems in order to compare the effects of these land uses and management systems on Andosol quality changes. This would contribute to propose stan- dard systems that safeguard Andosol quality. 2. MATERIALS AND METHODS This study was carried out in Mount Bambouto, one 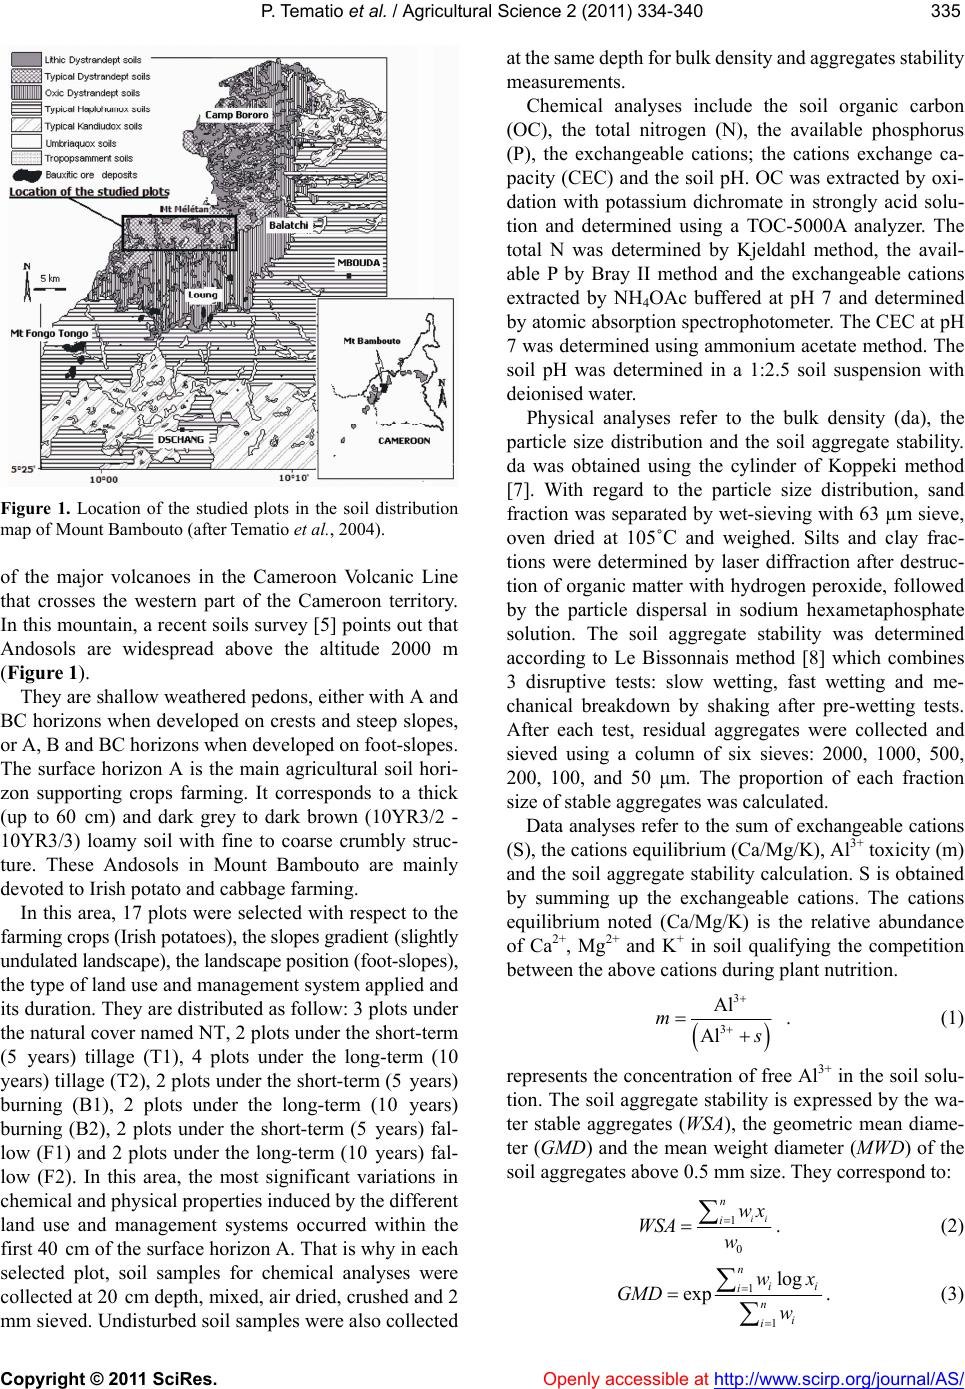 P. Tematio et al. / Agricultural Science 2 (2011) 334-340 Copyright © 2011 SciRes. Openly accessible at http://www.scirp.org/journal/AS/ 335335 Figure 1. Location of the studied plots in the soil distribution map of Mount Bambouto (after Tematio et al., 2004). of the major volcanoes in the Cameroon Volcanic Line that crosses the western part of the Cameroon territory. In this mountain, a recent soils survey [5] points out that Andosols are widespread above the altitude 2000 m (Figure 1). They are shallow weathered pedons, either with A and BC horizons when developed on crests and steep slopes, or A, B and BC horizons when developed on foot-slopes. The surface horizon A is the main agricultural soil hori- zon supporting crops farming. It corresponds to a thick (up to 60 cm) and dark grey to dark brown (10YR3/2 - 10YR3/3) loamy soil with fine to coarse crumbly struc- ture. These Andosols in Mount Bambouto are mainly devoted to Irish potato and cabbage farming. In this area, 17 plots were selected with respect to the farming crops (Irish potatoes), the slopes gradient (slightly undulated landscape), the landscape position (foot-slopes), the type of land use and management system applied and its duration. They are distributed as follow: 3 plots under the natural cover named NT, 2 plots under the short-term (5 years) tillage (T1), 4 plots under the long-term (10 years) tillage (T2), 2 plots under the short-term (5 years) burning (B1), 2 plots under the long-term (10 years) burning (B2), 2 plots under the short-term (5 years) fal- low (F1) and 2 plots under the long-term (10 years) fal- low (F2). In this area, the most significant variations in chemical and physical properties induced by the different land use and management systems occurred within the first 40 cm of the surface horizon A. That is why in each selected plot, soil samples for chemical analyses were collected at 20 cm depth, mixed, air dried, crushed and 2 mm sieved. Undisturbed soil samples were also collected at the same depth for bulk density and aggregates stability measurements. Chemical analyses include the soil organic carbon (OC), the total nitrogen (N), the available phosphorus (P), the exchangeable cations; the cations exchange ca- pacity (CEC) and the soil pH. OC was extracted by oxi- dation with potassium dichromate in strongly acid solu- tion and determined using a TOC-5000A analyzer. The total N was determined by Kjeldahl method, the avail- able P by Bray II method and the exchangeable cations extracted by NH4OAc buffered at pH 7 and determined by atomic absorption spectrophotometer. The CEC at pH 7 was determined using ammonium acetate method. The soil pH was determined in a 1:2.5 soil suspension with deionised water. Physical analyses refer to the bulk density (da), the particle size distribution and the soil aggregate stability. da was obtained using the cylinder of Koppeki method [7]. With regard to the particle size distribution, sand fraction was separated by wet-sieving with 63 µm sieve, oven dried at 105˚C and weighed. Silts and clay frac- tions were determined by laser diffraction after destruc- tion of organic matter with hydrogen peroxide, followed by the particle dispersal in sodium hexametaphosphate solution. The soil aggregate stability was determined according to Le Bissonnais method [8] which combines 3 disruptive tests: slow wetting, fast wetting and me- chanical breakdown by shaking after pre-wetting tests. After each test, residual aggregates were collected and sieved using a column of six sieves: 2000, 1000, 500, 200, 100, and 50 μm. The proportion of each fraction size of stable aggregates was calculated. Data analyses refer to the sum of exchangeable cations (S), the cations equilibrium (Ca/Mg/K), Al3+ toxicity (m) and the soil aggregate stability calculation. S is obtained by summing up the exchangeable cations. The cations equilibrium noted (Ca/Mg/K) is the relative abundance of Ca2+, Mg2+ and K+ in soil qualifying the competition between the above cations during plant nutrition. 3 3 Al mAl s . (1) represents the concentration of free Al3+ in the soil solu- tion. The soil aggregate stability is expressed by the wa- ter stable aggregates (WSA), the geometric mean diame- ter (GMD) and the mean weight diameter (MWD) of the soil aggregates above 0.5 mm size. They correspond to: 1 0 ii n iwx WSA w . (2) 1 1 log exp n ii in i i wx GMD w . (3) 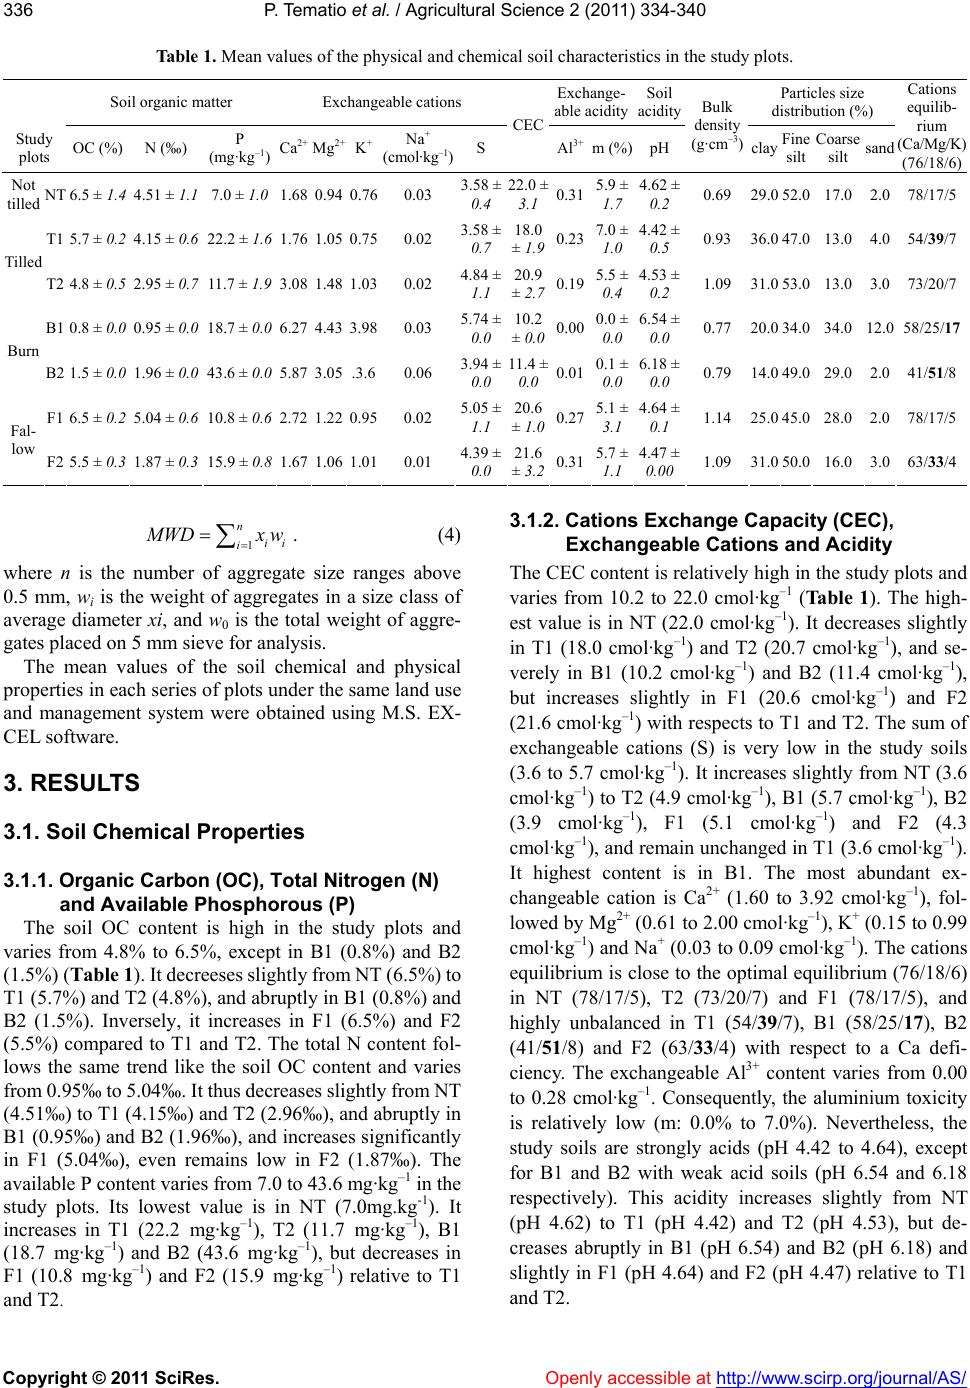 P. Tematio et al . / Agricultural Science 2 (2011) 334-340 Copyright © 2011 SciRes. http://www.scirp.org/journal/AS/ 336 Table 1. Mean values of the physical and chemical soil characteristics in the study plots. Soil organic matter Exchangeable cations Exchange- able acidity Soil acidity Particles size distribution (%) Study plots OC (%) N (‰(mg·kg–1) (cmol·kg–1) Bulk e Coarse sand Cations equilib- rium (Ca/Mg/K) ) P Ca2+ Mg2+ K + Na+ S CEC Al3+ m (%)pH density (g·cm–3) clay Fin silt silt (76/18/6) Not tilled NT 6.5 ± 1. 1.0 1.68 0..58 ± 0.4 22.0 ±29 04 4.51 ± 1.1 7.0 ± 94 0.76 0.03 33.1 0.31 5.9 ± 1.7 4.62 ± 0.2 0.69 .0 52.0 17.0 2.78/17/5 T1 3.± 0.7 18.0 ± 1.9 31.0 4. 0.5 0.93 ± low ± 5.7 ± 0.2 4.15 ± 0.6 22.2 ± 1.6 1.76 1.05 0.75 0.02 58 0.2 7.0 ± 42 ±36.0 47.0 13.0 4.054/39/7 Tilled T2 4.8 ± 0.5 2.95 ± 0.7 11.7 ± 1.9 3.08 1.48 1.03 0.02 4.84 ± 1.1 20.9 2.7 0.19 5.5 ± 0.4 4.53 ± 0.2 1.09 31.0 53.0 13.0 3.073/20/7 B1 0.8 ± 0.0 0.95 ± 0.0 18.7 ± 0.0 6.27 4.43 3.98 0.03 5.74 ± 0.0 10.2 ± 0.0 0.00 0.0 ± 0.0 6.54 ± 0.0 0.77 20.0 34.0 34.0 12.058/25/17 Burn B2 1.5 ± 0.0 1.96 ± 0.0 43.6 ± 0.0 5.87 3.05 .3.6 0.06 3.94 ± 0.0 11.4 ± 0.0 0.01 0.1 ± 0.0 6.18 ± 0.0 0.79 14.0 49.0 29.0 2.041/51/8 F1 6.5 ± 0.2 5.04 ± 0.6 10.8 ± 0.6 2.72 1.22 0.95 0.02 5.05 ± 1.1 20.6 ± 1.0 0.27 5.1 ± 3.1 4.64 ± 0.1 1.14 25.0 45.0 28.0 2.078/17/5 Fal- F2 5.5 ± 0.3 1.87 ± 0.3 15.9 ± 0.8 1.67 1.06 1.01 0.01 4.39 ± 0.0 21.6 3.2 0.31 5.7 ± 1.1 4.47 ± 0.00 1.09 31.0 50.0 16.0 3.063/33/4 Openly accessible at 1i i n i M WD xw . 4 here n is the number of aggregate size ranges above 0.5 mm, wi is the weight of aggregates in a size class of average diameter xi, and w0 is the t arbon (O C), Total Nitrogen (N) study plots and 2 o T1 . Caange Capacity (CEC), cle io The CEC content is relatively high in the study plots and 0 cmol·kg) and T2 (20.7 cmol·kg), and se- l·kg–1), but innd F2 () 3.1.2 tions han Exch geabEx Catns and Acidity w otal weight of aggre- gates placed on 5 mm sieve for analysis. The mean values of the soil chemical and physical properties in each series of plots under the same land use and management system were obtained using M.S. EX- CEL software. 3. RESULTS 3.1. Soil Chemical Properties 3.1.1. Organic C and Available Phosphorous (P) The soil OC content is high in the varies from 4.8% to 6.5%, except in B1 (0.8%) and B (1.5%) (Table 1). It decreeses slightly from NT (6.5%) t (5.7%) and T2 (4.8%), and abruptly in B1 (0.8%) and B2 (1.5%). Inversely, it increases in F1 (6.5%) and F2 (5.5%) compared to T1 and T2. The total N content fol- lows the same trend like the soil OC content and varies from 0.95‰ to 5.04‰. It thus decreases slightly from NT (4.51‰) to T1 (4.15‰) and T2 (2.96‰), and abruptly in B1 (0.95‰) and B2 (1.96‰), and increases significantly in F1 (5.04‰), even remains low in F2 (1.87‰). The available P content varies from 7.0 to 43.6 mg·kg–1 in the study plots. Its lowest value is in NT (7.0mg.kg-1). It increases in T1 (22.2 mg·kg–1), T2 (11.7 mg·kg–1), B1 (18.7 mg·kg–1) and B2 (43.6 mg·kg–1), but decreases in F1 (10.8 mg·kg–1) and F2 (15.9 mg·kg–1) relative to T1 and T2. varies from 10.2 to 22.0 cmol·kg–1 (Ta ble 1). The high- est value is in NT (22.0 cmol·kg–1). It decreases slightly in T1 (18.–1–1 verely in B1 (10.2 cmol·kg–1) and B2 (11.4 cmo creases slightly in F1 (20.6 cmol·kg–1) a (21.6 cmol·kg–1) with respects to T1 and T2. The sum of exchangeable cations (S) is very low in the study soils (3.6 to 5.7 cmol·kg–1). It increases slightly from NT (3.6 cmol·kg–1) to T2 (4.9 cmol·kg–1), B1 (5.7 cmol·kg–1), B2 (3.9 cmol·kg–1), F1 (5.1 cmol·kg–1) and F2 (4.3 cmol·kg–1), and remain unchanged in T1 (3.6 cmol·kg–1). It highest content is in B1. The most abundant ex- changeable cation is Ca2+ (1.60 to 3.92 cmol·kg–1), fol- lowed by Mg2+ (0.61 to 2.00 cmol·kg–1), K+ (0.15 to 0.99 cmol·kg–1) and Na+ (0.03 to 0.09 cmol·kg–1). The cations equilibrium is close to the optimal equilibrium (76/18/6) in NT (78/17/5), T2 (73/20/7) and F1 (78/17/5), and highly unbalanced in T1 (54/39/7), B1 (58/25/17), B2 (41/51/8) and F2 (63/33/4) with respect to a Ca defi- ciency. The exchangeable Al3+ content varies from 0.00 to 0.28 cmol·kg–1. Consequently, the aluminium toxicity is relatively low (m: 0.0% to 7.0%). Nevertheless, the study soils are strongly acids (pH 4.42 to 4.64), except for B1 and B2 with weak acid soils (pH 6.54 and 6.18 respectively). This acidity increases slightly from NT (pH 4.62) to T1 (pH 4.42) and T2 (pH 4.53), but de- creases abruptly in B1 (pH 6.54) and B2 (pH 6.18) and slightly in F1 (pH 4.64) and F2 (pH 4.47) relative to T1 and T2. 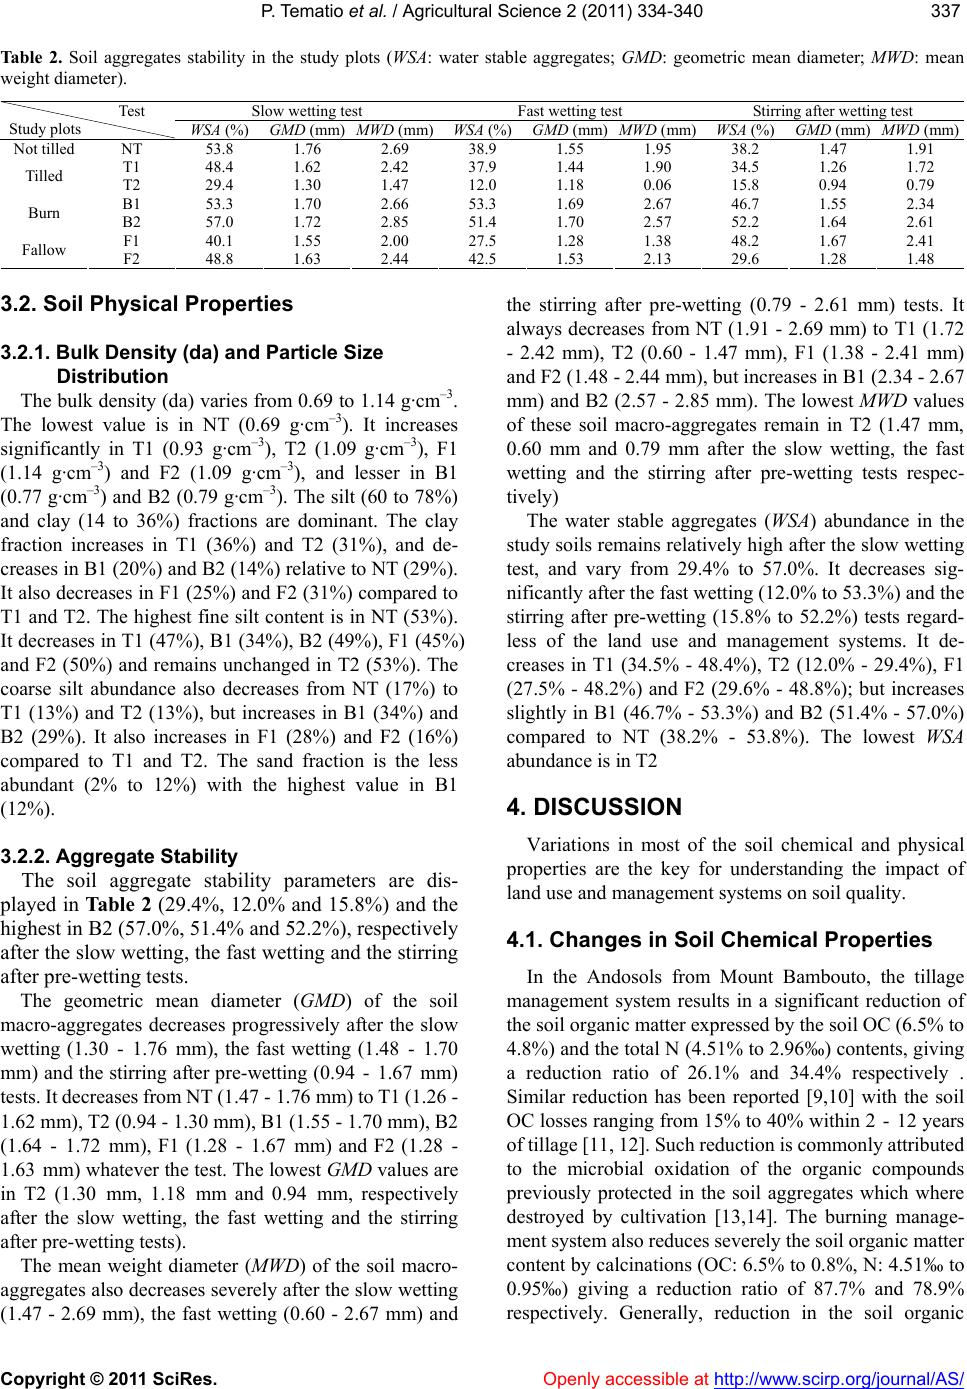 P. Tematio et al . / Agricultural Science 2 (2011) 334-340 Copyright © 2011 SciRes. Openly accessible at http://www.scirp.org/journal/AS/ 337337 r sta Fast wetting test Stirring after wetting test Ta b le 2. Soil aggregates stability in the study plots (WSA: wateble aggregates; GMD: geometric mean diameter; MWD: mean weight diameter). Slow wetting test Test Study plots WSA (%)GMD (mm) MWD (mm)WSA (%)GMD (mm)MWD (mm)WSA (%) GMD (mm)MWD (mm) Not tilled NT 53.8 1.76 2.69 38.9 1.55 1.95 38.2 1.47 1.91 T1 48.4 1.62 2.42 37.9 1.44 1.90 34.5 1.26 1.72 Tilled T2 29.4 1.30 1.47 12.0 1.18 0.06 15.8 0.94 0.79 53.3 2.66 53.3 2.67 46.B1 Burn B2 1.70 1.69 7 1.55 2.34 57.0 1.72 2.85 51.4 1.70 2.57 52.2 1.64 2.61 F1 40.1 1.55 2.00 27.5 1.28 1.38 48.2 1.67 2.41 Fallow F2 48.8 1.63 2.44 42.5 1.53 2.13 29.6 1.28 1.48 3.2il Phal Prties 3.2.1. Bulk Density (da) and Particle Size Distribution .69 to 1.14 g·cm–3. The lowest value is in NT (0.69 g·cm–3). It increases –3), F1 (1.14 (1.09 g·cm), and lesser in B1 (0 n Tab le 2 (29.4%, 12.0% and 15.8%) and the highest in B2 (57.0%, 51.4% and 52.2%), respectively ting and the stirring af r pre-wetting (0.94 - 1.67 mm) te the st afterwettin9 - mm) tests. It alwayrease NT - 2.6) to T72 - 2.42), T2 - 1.4), F1 - 2.m) and F2 (1.48 - 2.44 mm), but increases in B1 (2.34 - 2.67 mm). The lowest MWD values of - 48.2%) and F2 (29.6% - 48.8%); but increases sl In the Andosols from Mount Bambouto, the tillage sults in a significant reduction of the so soil rs ed to . Soysicrope The bulk density (da) varies from 0 significantly in T1 (0.93 g·cm–3), T2 (1.09 g·cm g·cm–3) and F2–3 .77 g·cm–3) and B2 (0.79 g·cm–3). The silt (60 to 78%) and clay (14 to 36%) fractions are dominant. The clay fraction increases in T1 (36%) and T2 (31%), and de- creases in B1 (20%) and B2 (14%) relative to NT (29%). It also decreases in F1 (25%) and F2 (31%) compared to T1 and T2. The highest fine silt content is in NT (53%). It decreases in T1 (47%), B1 (34%), B2 (49%), F1 (45%) and F2 (50%) and remains unchanged in T2 (53%). The coarse silt abundance also decreases from NT (17%) to T1 (13%) and T2 (13%), but increases in B1 (34%) and B2 (29%). It also increases in F1 (28%) and F2 (16%) compared to T1 and T2. The sand fraction is the less abundant (2% to 12%) with the highest value in B1 (12%). 3.2.2. Aggregate Stability The soil aggregate stability parameters are dis- played i after the slow wetting, the fast wet ter pre-wetting tests. The geometric mean diameter (GMD) of the soil macro-aggregates decreases progressively after the slow wetting (1.30 - 1.76 mm), the fast wetting (1.48 - 1.70 mm) and the stirring afte sts. It decreases from NT (1.47 - 1.76 mm) to T1 (1.26 - 1.62 mm), T2 (0.94 - 1.30 mm), B1 (1.55 - 1.70 mm), B2 (1.64 - 1.72 mm), F1 (1.28 - 1.67 mm) and F2 (1.28 - 1.63 mm) whatever the test. The lowest GMD values are in T2 (1.30 mm, 1.18 mm and 0.94 mm, respectively after the slow wetting, the fast wetting and the stirring after pre-wetting tests). The mean weight diameter (MWD) of the soil macro- aggregates also decreases severely after the slow wetting (1.47 - 2.69 mm), the fast wetting (0.60 - 2.67 mm) and mm) and B2 (2.57 - 2.85 irring pre-g (0.72.61 s decs from(1.919 mm1 (1. mm(0.607 mm (1.3841 m these soil macro-aggregates remain in T2 (1.47 mm, 0.60 mm and 0.79 mm after the slow wetting, the fast wetting and the stirring after pre-wetting tests respec- tively) The water stable aggregates (WSA) abundance in the study soils remains relatively high after the slow wetting test, and vary from 29.4% to 57.0%. It decreases sig- nificantly after the fast wetting (12.0% to 53.3%) and the stirring after pre-wetting (15.8% to 52.2%) tests regard- less of the land use and management systems. It de- creases in T1 (34.5% - 48.4%), T2 (12.0% - 29.4%), F1 (27.5% ightly in B1 (46.7% - 53.3%) and B2 (51.4% - 57.0%) compared to NT (38.2% - 53.8%). The lowest WSA abundance is in T2 4. DISCUSSION Variations in most of the soil chemical and physical properties are the key for understanding the impact of land use and management systems on soil quality. 4.1. Changes in Soil Chemical Properties management system re il organic matter expressed by the soil OC (6.5% to 4.8%) and the total N (4.51% to 2.96‰) contents, giving a reduction ratio of 26.1% and 34.4% respectively . Similar reduction has been reported [9,10] with the OC losses ranging from 15% to 40% within 2 - 12 yea of tillage [11, 12]. Such reduction is commonly attribut the microbial oxidation of the organic compounds previously protected in the soil aggregates which where destroyed by cultivation [13,14]. The burning manage- ment system also reduces severely the soil organic matter content by calcinations (OC: 6.5% to 0.8%, N: 4.51‰ to 0.95‰) giving a reduction ratio of 87.7% and 78.9% respectively. Generally, reduction in the soil organic  P. Tematio et al . / Agricultural Science 2 (2011) 334-340 Copyright © 2011 SciRes. Openly accessible at http://www.scirp.org/journal/AS/ 338 three land us en after 10years oils ent sy ing to moderate rainfalls is le matter content influences negatively the fertility of An- dosols, since it is known to play a central role in the ex- changeable cations retention [15]. This reduction could also increase the soil erodibility, causing an offsite transport of the soil nutrients and the subsequent soil fertility decline. Conversely, the fallow management system improves the soil organic matter content relative to the tillage management system (OC: 4.8% to 6.5%, N: 2.96‰ to 5.04‰) with an increasing ratio of 26.1% and 41.3% respectively. This increase in the soil organic matter content with fallow may be consistent with addi- tional supply of the organic residues which act as com- post with time [16]. These particulate organic matters are protected physically in soil aggregates [17]. In the Andosols from Mount Bambouto, the tillage and burning management systems also lead to a net loss of the CEC content (22.0 to 18.0 and 10.2 cmol·kg–1) with a reduction ratio of 18.2% and 53.6% respectively, giving rise to the soil fertility decline [18], whereas the fallow management system restores it relative to the tillage management system (18.0 to 21.6 cmol·kg–1) with an increasing ratio of 16.7%. Inversely, the above e and management systems are marked by a slight increase of the sum of the exchangeable cations relative to the natural cover (3.6 to 4.9 cmol·kg–1, 5.7 and 5.1 cmol·kg–1) with and increasing ratio of 26.5%, 36.8% and 29.4% respectively. In the tillage management system, this may be due to an input of fertilizers during land preparation. In the fallow management system, it sug- gests that this unmanaged period can restore the soil nutrients exported by the harvest of the plant biomass. In the burning management system, it may be consistent with the release of the base cations during soil calcination [19] as indicated by the net increase in the soil pH values in B1 (6.54) and B2 (6.18). Thus, the burning manage- ment system improves the soil fertility through accumu- lation of the exchangeable cations. But it is well known that this improvement lasts only for a short period and that the water erosion and the subsequent soil nutrients leaching leads to soil impoverishment [19]. The soil acidity also increases in the tillage management system compared to the natural cover (pH 4.62 to 4.42), inducing the decrease in the agricultural productivity [20]. Even 10 years of the fallow management system practice (F2 plots) is not enough to improve this strong acidity induced by the tillage management system. Always in the Andosols from Mount Bambouto, the long-term tillage (T2 plots) and the fallow management systems have brought the cations equilibrium close to the optimal equilibrium (T2: 73/20/7, F1: 78/17/5 and F2: 63/33/4) and consequently improve Andosol fertility. Inversely, the short-term till- age (T1 plots) and the burning management systems provoke the cations imbalance (T1: 54/39/7, B1: 58/25/17 and B2: 41/51/8) with a significant Ca2+ deficiency. This Ca2+ deficiency may induce a severe antagonism between the cations during the plants nutrition. 4.2. Changes in Soil Physical Properties The soil compaction (36.7%) induced by the tillage management system and expressed by the soil bulk den- sity increase (0.69 to 1.09 g·cm–3) has significant effect on soil physical properties. It reduces infiltration and percolation of water, and thus favours the surface runoff and land degradation by soil erosion. Ev of the fallow management system practice, these s seem to have not recovered from the tillage managem stem induced compaction. The water stable aggregates (WSA: 12.0% - 53.3% and 15.8% - 52.2%) abundance, the geometric mean diameter (GMD: 1.18 - 1.70 mm and 0.94 - 1.67 mm) and the mean weight diameter (MWD: 0.60 - 2.57 mm and 0.79 - 2.61 mm) values reveal that the fast wetting and the stirring after pre-wetting tests representing moderate to violent storms highly disrupt the Andosol macro-aggregates. The slow wetting test correspond ast disruptive (WSA: 29.4% - 57.0%; GMD: 1.30 - 1.76 mm; MWD: 1.47 - 2.85 mm). Globally, the Andosols from Mount Bambouto have low to moderate resistance to water erosion. As the land use and management system is concerned, the tillage management system lead to an important destruction of the Andosol macro-aggregates (WSA: 12.0% - 48.4%; GMD: 0.94 - 1.62 mm and MWD: 0.60 - 2.42 mm), whereas the burning management sys- tem regenerates them ((WSA: 46.7% - 57.0%; GMD: 1.55 - 1.72 mm and MWD: 2.34 - 2.85 mm). The fallow man- agement system also regenerates the Andosol macro- aggregates after the tillage management system practice (WSA: 27.5% - 48.8%; GMD: 1.28 - 1.67 mm and MWD: 1.38 - 2.44 mm). The destruction of the Andosol macro- aggregates by the tillage management system with it subsequent increasing clay fraction (36%) may be con- sistent with the mechanical breakdown of the soil ag- gregates by ploughing. The regeneration of the Andosol macro-aggregates with the burning management system practice may be related to Al3+ activity in the soil solution. In fact, above pH 5.5, Al3+ precipitates in soil as hy- droxides and can act as links between mineral particles, generating soil aggregates. Under the fallow management system, the regeneration of the Andosol macro-aggre- gates may be associated to the formation of the organo- metal and oxides-humus complexes with organic acids acting as binding agent [21]. The increase in the Andosol macro-aggregates abundance in both cases and the rela- tively low bulk density indicate well-structured soils with good pore connectivity.  P. Tematio et al . / Agricultural Science 2 (2011) 334-340 Copyright © 2011 SciRes. Openly accessible at http://www.scirp.org/journal/AS/ 339339 exchangeable cations and t the optimal equilibrium after are not enough to restore ef- fic rovement lasts only for a sh R 5. CONCLUSIONS The tillage management system is a significant driver of the Andosol fertility decline. It reduces significantly the soil organic matter and the CEC content, increases soil acidity and compaction, and destroys the Andosol macro-aggregates; the chemical and physical properties that affect negatively the Andosol quality. The relative increase of the sum of thehe cations equilibrium close to 10 years of tillage practice iently the Andosol fertility. The burning management system has mitigated influ- ences on Andosols quality. The severe reduction of the soil organic matter and the CEC content, and the cations equilibrium imbalance in the burning management sys- tem affect negatively the Andosol quality. Inversely, the net increase of the sum of the exchangeable cations and the soil pH above 6, and the fairly high soil macro-ag- gregates abundance contribute to improve significantly the Andosol quality. But this imp ort period because the water erosion and it subsequent nutrients leaching leads to the soil impoverishment. The fallow management system globally improves significantly the Andosol quality. It is sustainable in term of the soil organic matter, the CEC and the sum of the exchangeable cations increase, and the soil macro-ag- gregates regeneration after the tillage management sys- tem practice. But, even 10 years of the fallow manage- ment system is not enough to regenerate efficiently the soil macro-aggregates and improve the soil acidity. EFERENCES [1] Dumanski, J. and Pieri, C. (2000) Land quality indicators: Research plan. Agriculture, Ecosystems and Environment, 81, 93-102. doi:10.1016/S0167-8809(00)00183-3 [2] Oldeman, L.R., Hakkeling, R.T.A. and Sombroek, W.G. (1990) World map of human-induced soil degradation. ISRIC: Wageningen, UNEP: Nairobi. [3] Smaling, E.M.A., Fresco, L.O. and de Jager, A. (1996) Classifying monitoring and improving soil nutrient stocks and flows i 496. n African agriculture. Ambio, 25, 492- [4] Harris, F.M.A. (1998) Farm-level assessment of the nu- trient balance in northern Nigeria. Agriculture, Ecosys- tems and Environment, 71, 201-214. doi:10.1016/S0167-8809(98)00141-8 [5] Tematio, P., Kengni, L., Bitom, D., Hodson, M., Fopoussi, J.C., Leumbe, O., Mpakam, H.G. and Tsozué, D. (2004) Soils and their distribution on Bambouto volcanic moun- tain, West Cameroon highland, central Africa. Journal of African Earth Sciences, 39, 447-457. doi:10.1016/j.jafrearsci.2004.07.020 [6] Tematio, P. and Olson, K.R. (1997) Impacts of industri- alized agriculture on land in Bafou, Cameroon. Journal of Soil and Water Conservation, 52, 404-405. [7] Blake, G.R. (1982) Bulk density. Soil s soil analysis. American Society of Ag cience methods of ronomy and Crop 843.x Science Society of America, Madison, 374-390. [8] Le Bissonnais, Y. (1996) Aggregate stability and assess- ment of soil crustability and erodibility: I. Theory and methodology. European Journal of Soil Science, 47, 425- 437. d oi:10.1111/j.1365-2389.1996.tb01 ) Water-dispersible n and Nu- erzabek, ience, 51, [9] Mbagwu, J.S.C. and Piccolo, A. (1998 clay in aggregates of forest and cultivated soils in south- ern Nigeria in relation to organic matter constituents. In: Bergström, L. and Kirchman, H., Eds., Carbo trient Dynamics in Natural and Agricultural Ecosystems, CAB International, Wallingford, 71-83. [10] Spaccini, R., Piccolo, A., Haberhauer, G. and G M. (2000) Transformation of organic matter from maize residues into labile and humic fractions of three Euro- pean soils as revealed by 13C distribution and CPMAS- NMR spectra. European Journal of Soil Sc 583-594. [11] Davidson, E.A. and Ackerman, I.L. (1993) Changes in soil carbon inventories following cultivation of previ- ously untilled soils. Biogeochemistry, 20, 161-193. doi:10.1007/BF00000786 [12] Evrendilek, F., Celik, I. and Kilic, S. (2004) Changes in soil organic carbon and other physical soil properties along adjacent Mediterranean forest, grassland, and cropland ecosystems in Turkey. Journal of Arid Envi- ronments, 59, 743-752. doi:10.1016/j.jaridenv.2004.03.002 [13] Cambardella, C.A. and Elliot, E.T. (1993) Carbon and 15995005700040032x nitrogen distributions in aggregates from cultivated and native grassland soils. Soil Science Society of America Journal, 57, 1071-1076. doi:10.2136/sssaj1993.036 [14] Piccolo, A. (1996) Humus and soil conservation. In: Pic- colo, A., Ed., Humic Substances in Terrestrial Ecosys- tems, Elsevier, Amsterdam, 225-264. doi:10.1016/B978-044481516-3/50006-2 [15] Shoji, S., Nanzyo, M. an canic ash soil: genesis, properties an d Dahlgren, R.A. (1993) Vol- d utilization. Devel- on the low land composi- enegal. conventional and y of America opments in Soil Science 21, Elsevier Science Publisher, Amsterdam, 287. [16] Feller, C., Cnoparts, L. and Daneetti, F. (1987) Effect of different millet straw addition tion of organic matter in two tropical soils in S Pedologie, 23, 237-252. [17] Six, J., Elliott, E.T. and Paustian, K. (1999) Aggregate and soil organic matter dynamics under no-tillage systems. Soil Science Societ Journal, 63, 1350-1358. doi:10.2136/sssaj1999.6351350x [18] Nobel, P.S. (1989) A nutrient index quantifying produc- tivity of agaves and cacti. Journal of Applied Ecology, 26, 635-645. doi:10.2307/2404088 [19] Sommer, R., Vlek, P.L.G., de Abreu Sá, D., Vielhauer, K., de Fátima Rodrigues Coelho, R. and Fölster, H. (2004) Nutrient balance of shifting cultivation by burning or 019470.93637.54 mulching in the Eastern Amazon: Evidence for subsoil nutrient accumulation. Nutrient Cycling in Agroecosys- tems, 68, 257-271. doi:10.1023/B:FRES.0000  P. Tematio et al . / Agricultural Science 2 (2011) 334-340 Copyright © 2011 SciRes. http://www.scirp.org/journal/AS/Openly accessible at 340 n /S96069 [20] Moody, P.W. and Aitken, R.L. (1997) Soil acidificatio under some tropical systems: 1. Rates of acidification and contributing factors. Australian Journal of Soil Re- search, 35, 163-173. doi:10.1071 matter and [21] Tate, K.R. and Theng, B.K.G. (1980) Organic its interactions with inorganic soil constituents. Soils with Variable Charge, Soil Bureau Department of Scientific and Industrial Research, New Zealand, 225-244. |