

Paper Menu >>
Journal Menu >>
 Vol.3, No.8, 646-650 (2011) Natural Science http://dx.doi.org/10.4236/ns.2011.38088 Copyright © 2011 SciRes. OPEN ACCESS Major elements and lithostratigraphic study of the contact rocks of the Togo and the Dahomeyan formations in Ghana Mawutorli Nyarku1*, Samuel Yao Ganyaglo1, Eric Tetteh Glover1, Yaw Serfor-Armah2 1National Nuclear Research Institute, Ghana Atomic Energy Commission, Accra, Ghana; *Corresponding Author: [email protected] 2Graduate School of Nuclear and Allied Sciences, University of Ghana, Accra, Ghana. Received 4 April 2011; revised 26 April 2011; accepted 30 April 2011. ABSTRACT The thrust contact between the Togo and the Dahomeyan formations in Ghana is a lithotec- tonic boundary that exists between two major Precambrian formations which are of impor- tance to geologists owing to the fact that Pre- cambrian rocks in Ghana host almost all eco- nomic minerals and metals. The lithostratigra- phy of the Togo-Dahomyan thrust contact rocks from a borehole in Kwabenya near Accra (the Capital of Ghana) has been studied and major crustal chemical elements assayed using In- strumental Neutron Activation Analysis (INAA) techniques. The results have revealed elemental compositions and the mineralogical make up of the lithostratigraphic units of these contact rocks and the general geology of the Togo and the Dahomeyan formations. The profile shows a thrust contact that exists between the Togo for- mations which are underlying the Dhomeyan formations. The Togo formations here are made mainly of quartzite in fresh schist and the Da- homeyan made of gneisses. In between these two major geologic formations are the rocks of the contact which are intercalation of quartzite and schist. The rocks are felsic with an average felsic index (F) of 85.74 and feldspar rich with K-(orthoclase) feldspars dominating the Da- homeyan rocks. Iron and titanium oxides are depleted with depth from 52 m depth below surface downward and potassium oxide was enriched with depth from 42 m below surface downward. Major mineral forming elements such as aluminum and calcium had varied lev- els in the Togo and in the Dahomeyan rocks. Keywords: Dahomeyan; Togo; Contact Rocks; Elemental; Concentrations; INAA; Ghana 1. INTRODUCTION Thrust contact of the Togo and the Dahomeyan for- mations underlie some suburbs of Accra such as Kwa- benya and Achimota. The geology of the Togo and Da- homeyan formations and their contact are well described by Blay and Kesse [1,2]. Rocks of these two formations and their thrust contact are important owing to the fact that the Togo and the Dahomeyan formations are among Precambrian rocks in Ghana which happened to host majority of the economic minerals and metals. The li- thologic successions of these two formations are known to be complex. The Togo has been classified into three stratigraphic divisions namely: Basic, Arenaceous and Argillaceous groups while the Dahomeyan formations have been classified into an order of Acidic Dahomeyan, Alkalic gneiss, Basic intrusives and the Metabasics re- spectively with the first in each case being the youngest and at the top of the lithosuccession. The Togo forma- tions are Upper Precambrian while the Dahomeyan for- mations are Middle to Late Precambrian [3,4]. The Togo formations are deformed thrusted supracrustal rocks and trend northeast-southwest. The Dahomeyan formations are belts with the same northeast-southwest trending east of the Togo, they are highly metamorphosed and are associated with much thermotectonic activities. The Dahomeyan formations are found in the easternmost part of Ghana. Mineral and for that matter elemental compo- sition of these contact rocks have always been of interest to geologists, as this has helped to establish origin, evo- lution and the geology of the contact. Since quantity of chemical elements in a mineral is what determines the mineral type and the mineral name, elemental data on rocks and minerals of the thrust contact of the Togo and the Dahomeyan formations is needful for the proper 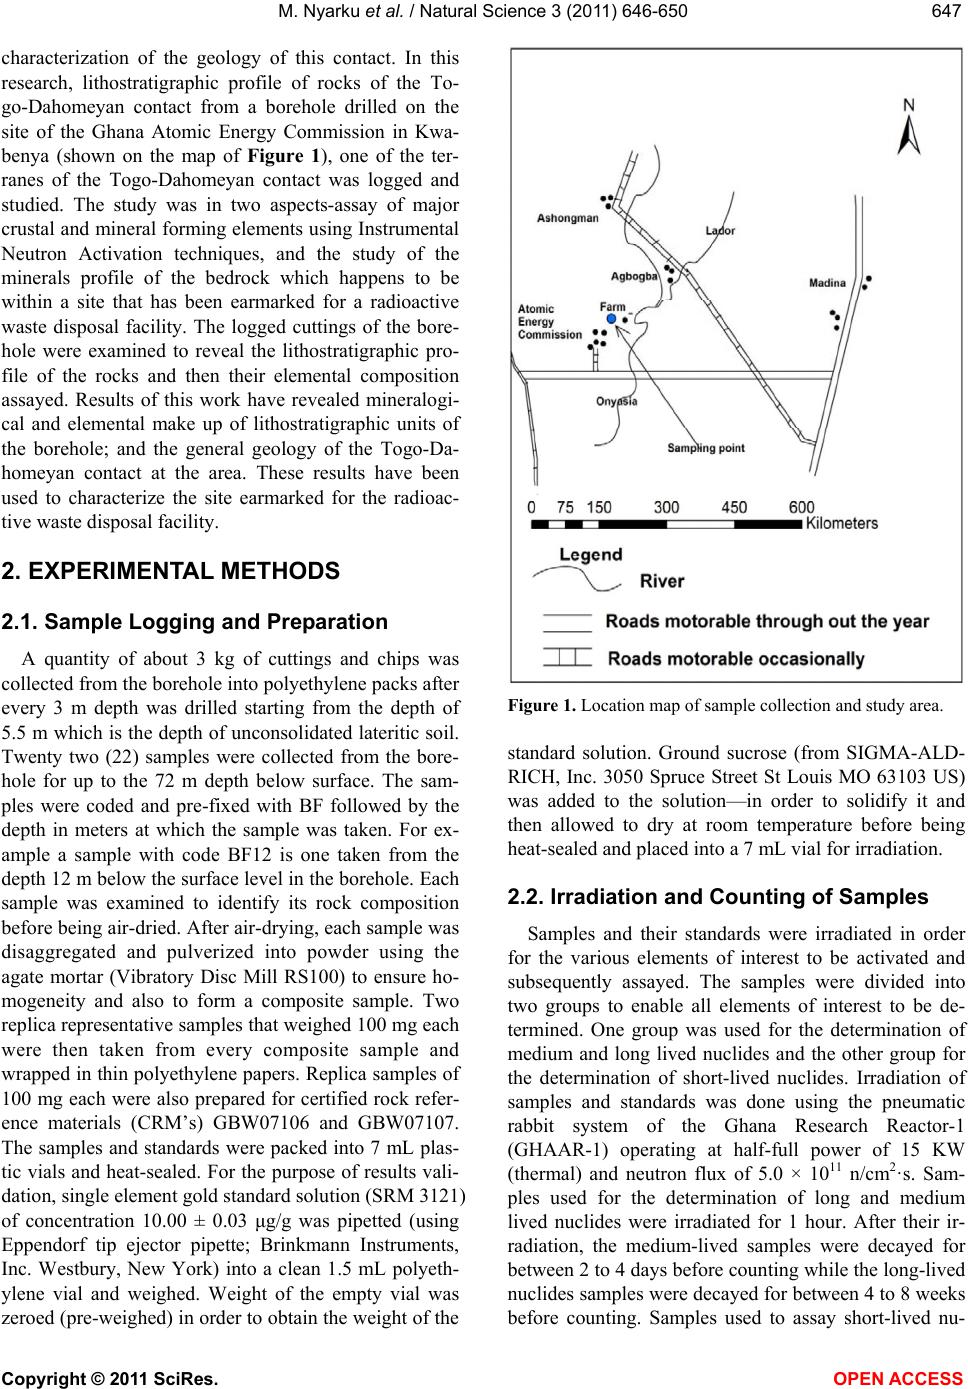 M. Nyarku et al. / Natural Science 3 (2011) 646-650 Copyright © 2011 SciRes. OPEN ACCESS 647647 characterization of the geology of this contact. In this research, lithostratigraphic profile of rocks of the To- go-Dahomeyan contact from a borehole drilled on the site of the Ghana Atomic Energy Commission in Kwa- benya (shown on the map of Figure 1), one of the ter- ranes of the Togo-Dahomeyan contact was logged and studied. The study was in two aspects-assay of major crustal and mineral forming elements using Instrumental Neutron Activation techniques, and the study of the minerals profile of the bedrock which happens to be within a site that has been earmarked for a radioactive waste disposal facility. The logged cuttings of the bore- hole were examined to reveal the lithostratigraphic pro- file of the rocks and then their elemental composition assayed. Results of this work have revealed mineralogi- cal and elemental make up of lithostratigraphic units of the borehole; and the general geology of the Togo-Da- homeyan contact at the area. These results have been used to characterize the site earmarked for the radioac- tive waste disposal facility. 2. EXPERIMENTAL METHODS 2.1. Sample Logging and Preparation A quantity of about 3 kg of cuttings and chips was collected from the borehole into polyethylene packs after every 3 m depth was drilled starting from the depth of 5.5 m which is the depth of unconsolidated lateritic soil. Twenty two (22) samples were collected from the bore- hole for up to the 72 m depth below surface. The sam- ples were coded and pre-fixed with BF followed by the depth in meters at which the sample was taken. For ex- ample a sample with code BF12 is one taken from the depth 12 m below the surface level in the borehole. Each sample was examined to identify its rock composition before being air-dried. After air-drying, each sample was disaggregated and pulverized into powder using the agate mortar (Vibratory Disc Mill RS100) to ensure ho- mogeneity and also to form a composite sample. Two replica representative samples that weighed 100 mg each were then taken from every composite sample and wrapped in thin polyethylene papers. Replica samples of 100 mg each were also prepared for certified rock refer- ence materials (CRM’s) GBW07106 and GBW07107. The samples and standards were packed into 7 mL plas- tic vials and heat-sealed. For the purpose of results vali- dation, single element gold standard solution (SRM 3121) of concentration 10.00 ± 0.03 μg/g was pipetted (using Eppendorf tip ejector pipette; Brinkmann Instruments, Inc. Westbury, New York) into a clean 1.5 mL polyeth- ylene vial and weighed. Weight of the empty vial was zeroed (pre-weighed) in order to obtain the weight of the Figure 1. Location map of sample collection and study area. standard solution. Ground sucrose (from SIGMA-ALD- RICH, Inc. 3050 Spruce Street St Louis MO 63103 US) was added to the solution—in order to solidify it and then allowed to dry at room temperature before being heat-sealed and placed into a 7 mL vial for irradiation. 2.2. Irradiation and Counting of Samples Samples and their standards were irradiated in order for the various elements of interest to be activated and subsequently assayed. The samples were divided into two groups to enable all elements of interest to be de- termined. One group was used for the determination of medium and long lived nuclides and the other group for the determination of short-lived nuclides. Irradiation of samples and standards was done using the pneumatic rabbit system of the Ghana Research Reactor-1 (GHAAR-1) operating at half-full power of 15 KW (thermal) and neutron flux of 5.0 × 10¹¹ n/cm2·s. Sam- ples used for the determination of long and medium lived nuclides were irradiated for 1 hour. After their ir- radiation, the medium-lived samples were decayed for between 2 to 4 days before counting while the long-lived nuclides samples were decayed for between 4 to 8 weeks before counting. Samples used to assay short-lived nu- 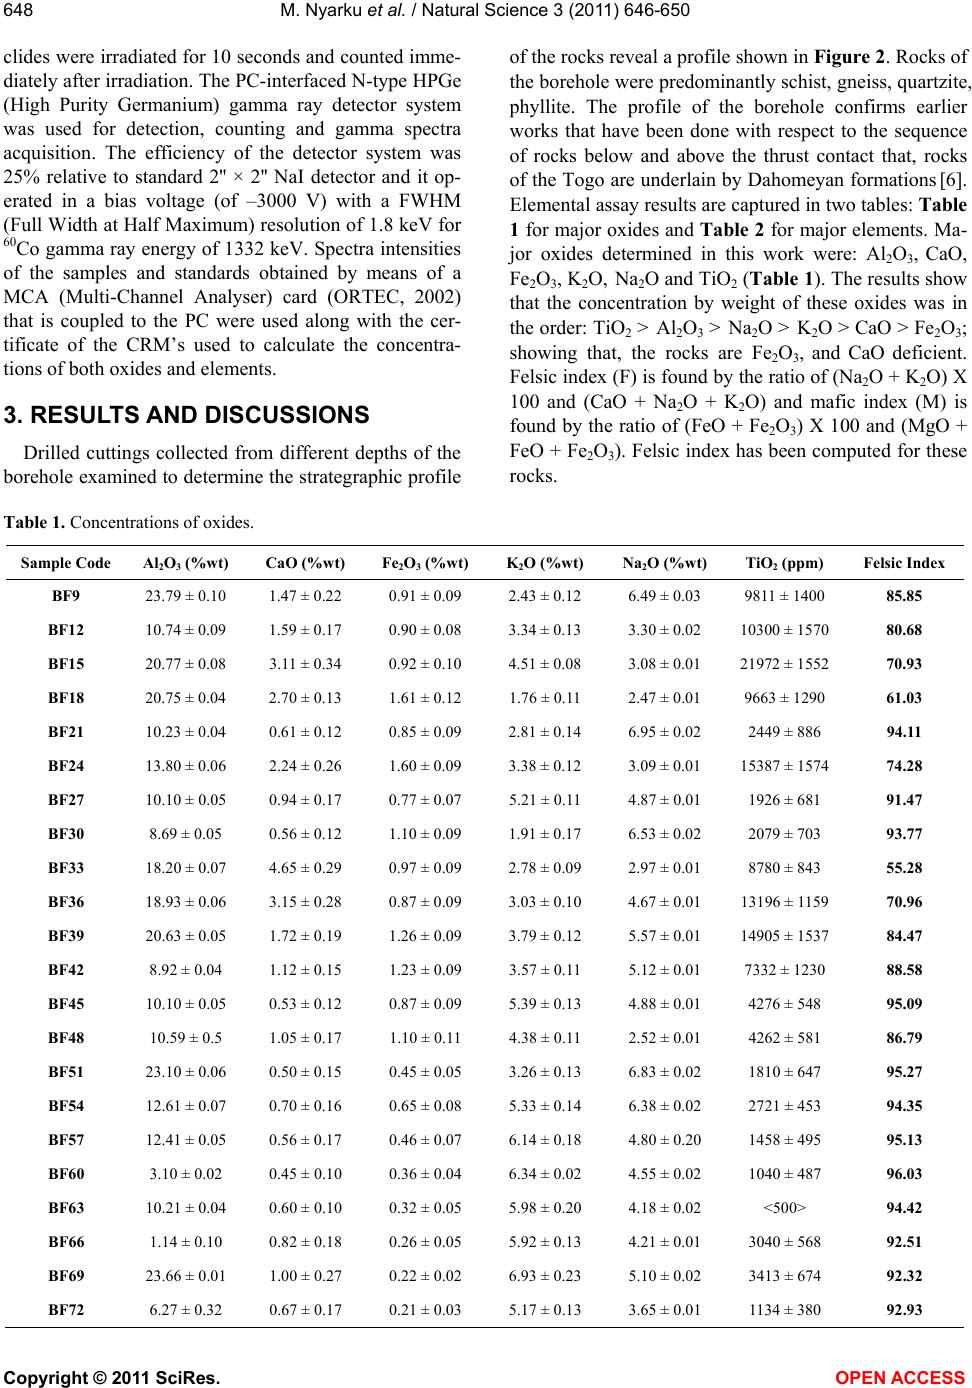 M. Nyarku et al. / Natural Science 3 (2011) 646-650 Copyright © 2011 SciRes. OPEN ACCESS 648 clides were irradiated for 10 seconds and counted imme- diately after irradiation. The PC-interfaced N-type HPGe (High Purity Germanium) gamma ray detector system was used for detection, counting and gamma spectra acquisition. The efficiency of the detector system was 25% relative to standard 2'' × 2'' NaI detector and it op- erated in a bias voltage (of –3000 V) with a FWHM (Full Width at Half Maximum) resolution of 1.8 keV for 60Co gamma ray energy of 1332 keV. Spectra intensities of the samples and standards obtained by means of a MCA (Multi-Channel Analyser) card (ORTEC, 2002) that is coupled to the PC were used along with the cer- tificate of the CRM’s used to calculate the concentra- tions of both oxides and elements. 3. RESULTS AND DISCUSSIONS Drilled cuttings collected from different depths of the borehole examined to determine the strategraphic profile of the rocks reveal a profile shown in Figure 2. Rocks of the borehole were predominantly schist, gneiss, quartzite, phyllite. The profile of the borehole confirms earlier works that have been done with respect to the sequence of rocks below and above the thrust contact that, rocks of the Togo are underlain by Dahomeyan formations [6]. Elemental assay results are captured in two tables: Table 1 for major oxides and Table 2 for major elements. Ma- jor oxides determined in this work were: Al2O3, CaO, Fe2O3, K2O, Na2O and TiO2 (Table 1). The results show that the concentration by weight of these oxides was in the order: TiO2 > Al2O3 > Na2O > K2O > CaO > Fe2O3; showing that, the rocks are Fe2O3, and CaO deficient. Felsic index (F) is found by the ratio of (Na2O + K2O) X 100 and (CaO + Na2O + K2O) and mafic index (M) is found by the ratio of (FeO + Fe2O3) X 100 and (MgO + FeO + Fe2O3). Felsic index has been computed for these rocks. Table 1. Concentrations of oxides. Sample Code Al2O3 (%wt) CaO (%wt) Fe2O3 (%wt) K2O (%wt) Na2O (%wt) TiO2 (ppm) Felsic Index BF9 23.79 ± 0.10 1.47 ± 0.22 0.91 ± 0.09 2.43 ± 0.12 6.49 ± 0.03 9811 ± 1400 85.85 BF12 10.74 ± 0.09 1.59 ± 0.17 0.90 ± 0.08 3.34 ± 0.13 3.30 ± 0.02 10300 ± 1570 80.68 BF15 20.77 ± 0.08 3.11 ± 0.34 0.92 ± 0.10 4.51 ± 0.08 3.08 ± 0.01 21972 ± 1552 70.93 BF18 20.75 ± 0.04 2.70 ± 0.13 1.61 ± 0.12 1.76 ± 0.11 2.47 ± 0.01 9663 ± 1290 61.03 BF21 10.23 ± 0.04 0.61 ± 0.12 0.85 ± 0.09 2.81 ± 0.14 6.95 ± 0.02 2449 ± 886 94.11 BF24 13.80 ± 0.06 2.24 ± 0.26 1.60 ± 0.09 3.38 ± 0.12 3.09 ± 0.01 15387 ± 1574 74.28 BF27 10.10 ± 0.05 0.94 ± 0.17 0.77 ± 0.07 5.21 ± 0.11 4.87 ± 0.01 1926 ± 681 91.47 BF30 8.69 ± 0.05 0.56 ± 0.12 1.10 ± 0.09 1.91 ± 0.17 6.53 ± 0.02 2079 ± 703 93.77 BF33 18.20 ± 0.07 4.65 ± 0.29 0.97 ± 0.09 2.78 ± 0.09 2.97 ± 0.01 8780 ± 843 55.28 BF36 18.93 ± 0.06 3.15 ± 0.28 0.87 ± 0.09 3.03 ± 0.10 4.67 ± 0.01 13196 ± 1159 70.96 BF39 20.63 ± 0.05 1.72 ± 0.19 1.26 ± 0.09 3.79 ± 0.12 5.57 ± 0.01 14905 ± 1537 84.47 BF42 8.92 ± 0.04 1.12 ± 0.15 1.23 ± 0.09 3.57 ± 0.11 5.12 ± 0.01 7332 ± 1230 88.58 BF45 10.10 ± 0.05 0.53 ± 0.12 0.87 ± 0.09 5.39 ± 0.13 4.88 ± 0.01 4276 ± 548 95.09 BF48 10.59 ± 0.5 1.05 ± 0.17 1.10 ± 0.11 4.38 ± 0.11 2.52 ± 0.01 4262 ± 581 86.79 BF51 23.10 ± 0.06 0.50 ± 0.15 0.45 ± 0.05 3.26 ± 0.13 6.83 ± 0.02 1810 ± 647 95.27 BF54 12.61 ± 0.07 0.70 ± 0.16 0.65 ± 0.08 5.33 ± 0.14 6.38 ± 0.02 2721 ± 453 94.35 BF57 12.41 ± 0.05 0.56 ± 0.17 0.46 ± 0.07 6.14 ± 0.18 4.80 ± 0.20 1458 ± 495 95.13 BF60 3.10 ± 0.02 0.45 ± 0.10 0.36 ± 0.04 6.34 ± 0.02 4.55 ± 0.02 1040 ± 487 96.03 BF63 10.21 ± 0.04 0.60 ± 0.10 0.32 ± 0.05 5.98 ± 0.20 4.18 ± 0.02 <500> 94.42 BF66 1.14 ± 0.10 0.82 ± 0.18 0.26 ± 0.05 5.92 ± 0.13 4.21 ± 0.01 3040 ± 568 92.51 BF69 23.66 ± 0.01 1.00 ± 0.27 0.22 ± 0.02 6.93 ± 0.23 5.10 ± 0.02 3413 ± 674 92.32 BF72 6.27 ± 0.32 0.67 ± 0.17 0.21 ± 0.03 5.17 ± 0.13 3.65 ± 0.01 1134 ± 380 92.93 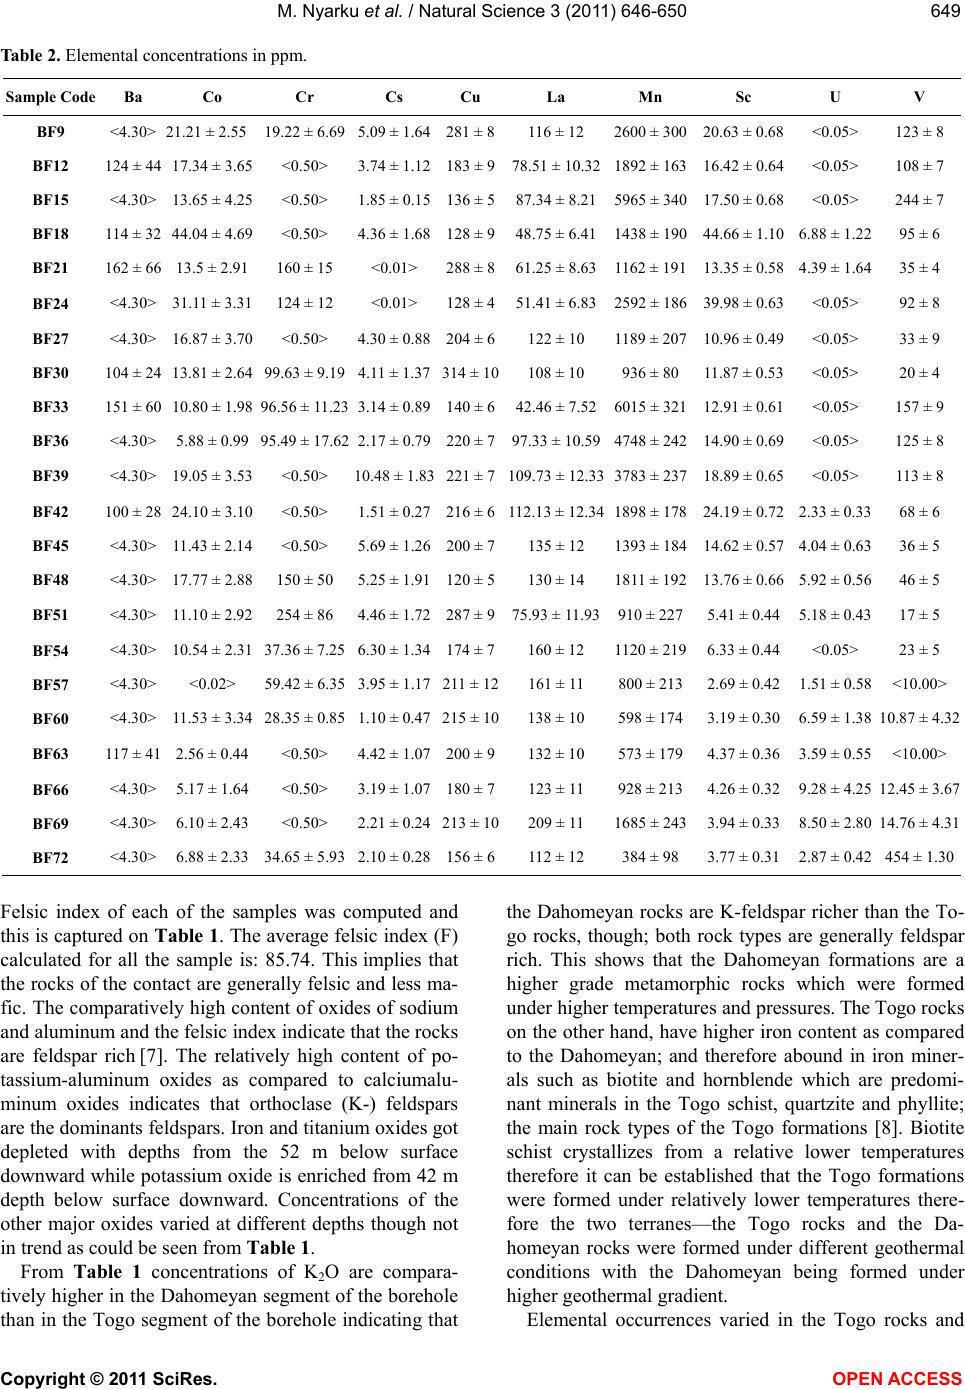 M. Nyarku et al. / Natural Science 3 (2011) 646-650 Copyright © 2011 SciRes. OPEN ACCESS 649649 Table 2. Elemental concentrations in ppm. Sample Code Ba Co Cr Cs Cu La Mn Sc U V BF9 <4.30> 2 1.21 ± 2.5519.22 ± 6.69 5.09 ± 1.64281 ± 8116 ± 12 2600 ± 30020.63 ± 0.68 <0.05> 123 ± 8 BF12 124 ± 44 17.34 ± 3.65<0.50> 3.74 ± 1.12183 ± 978.51 ± 10.321892 ± 16316.42 ± 0.64 <0.05> 108 ± 7 BF15 <4.30> 13.65 ± 4.25<0.50> 1.85 ± 0.15136 ± 587.34 ± 8.215965 ± 34017.50 ± 0.68 <0.05> 244 ± 7 BF18 114 ± 32 44.04 ± 4.69<0.50> 4.36 ± 1.68128 ± 948.75 ± 6.411438 ± 19044.66 ± 1.10 6.88 ± 1.2295 ± 6 BF21 162 ± 66 13.5 ± 2.91160 ± 15 <0.01> 288 ± 861.25 ± 8.631162 ± 19113.35 ± 0.58 4.39 ± 1.6435 ± 4 BF24 <4.30> 31.11 ± 3.31124 ± 12 <0.01> 128 ± 451.41 ± 6.832592 ± 18639.98 ± 0.63 <0.05> 92 ± 8 BF27 <4.30> 16.87 ± 3.70<0.50> 4.30 ± 0.88204 ± 6122 ± 10 1189 ± 20710.96 ± 0.49 <0.05> 33 ± 9 BF30 104 ± 24 13.81 ± 2.6499.63 ± 9.19 4.11 ± 1.37314 ± 10108 ± 10 936 ± 80 11.87 ± 0.53 <0.05> 20 ± 4 BF33 151 ± 60 10.80 ± 1.9896.56 ± 11.23 3.14 ± 0.89140 ± 642.46 ± 7.526015 ± 32112.91 ± 0.61 <0.05> 157 ± 9 BF36 <4.30> 5.88 ± 0.9995.49 ± 17.62 2.17 ± 0.79220 ± 797.33 ± 10.594748 ± 24214.90 ± 0.69 <0.05> 125 ± 8 BF39 <4.30> 19.05 ± 3.53<0.50> 10.48 ± 1.83221 ± 7109.73 ± 12.333783 ± 23718.89 ± 0.65 <0.05> 113 ± 8 BF42 100 ± 28 24.10 ± 3.10<0.50> 1.51 ± 0.27216 ± 6112.13 ± 12.341898 ± 17824.19 ± 0.72 2.33 ± 0.3368 ± 6 BF45 <4.30> 11.43 ± 2.14<0.50> 5.69 ± 1.26200 ± 7135 ± 12 1393 ± 18414.62 ± 0.57 4.04 ± 0.6336 ± 5 BF48 <4.30> 17.77 ± 2.88150 ± 50 5.25 ± 1.91120 ± 5130 ± 14 1811 ± 19213.76 ± 0.66 5.92 ± 0.5646 ± 5 BF51 <4.30> 11.10 ± 2.92254 ± 86 4.46 ± 1.72287 ± 975.93 ± 11.93910 ± 2275.41 ± 0.44 5.18 ± 0.4317 ± 5 BF54 <4.30> 10.54 ± 2.3137.36 ± 7.25 6.30 ± 1.34174 ± 7160 ± 12 1120 ± 2196.33 ± 0.44 <0.05> 23 ± 5 BF57 <4.30> <0.02> 59.42 ± 6.35 3.95 ± 1.17211 ± 12161 ± 11 800 ± 2132.69 ± 0.42 1.51 ± 0.58<10.00> BF60 <4.30> 11.53 ± 3.3428.35 ± 0.85 1.10 ± 0.47215 ± 10138 ± 10 598 ± 1743.19 ± 0.30 6.59 ± 1.3810.87 ± 4.32 BF63 117 ± 41 2.56 ± 0.44<0.50> 4.42 ± 1.07200 ± 9132 ± 10 573 ± 1794.37 ± 0.36 3.59 ± 0.55<10.00> BF66 <4.30> 5.17 ± 1.64<0.50> 3.19 ± 1.07180 ± 7123 ± 11 928 ± 2134.26 ± 0.32 9.28 ± 4.2512.45 ± 3.67 BF69 <4.30> 6.10 ± 2.43<0.50> 2.21 ± 0.24213 ± 10209 ± 11 1685 ± 2433.94 ± 0.33 8.50 ± 2.8014.76 ± 4.31 BF72 <4.30> 6.88 ± 2.3334.65 ± 5.93 2.10 ± 0.28156 ± 6112 ± 12 384 ± 98 3.77 ± 0.31 2.87 ± 0.42454 ± 1.30 Felsic index of each of the samples was computed and this is captured on Table 1. The average felsic index (F) calculated for all the sample is: 85.74. This implies that the rocks of the contact are generally felsic and less ma- fic. The comparatively high content of oxides of sodium and aluminum and the felsic index indicate that the rocks are feldspar rich [7]. The relatively high content of po- tassium-aluminum oxides as compared to calciumalu- minum oxides indicates that orthoclase (K-) feldspars are the dominants feldspars. Iron and titanium oxides got depleted with depths from the 52 m below surface downward while potassium oxide is enriched from 42 m depth below surface downward. Concentrations of the other major oxides varied at different depths though not in trend as could be seen from Table 1. From Table 1 concentrations of K2O are compara- tively higher in the Dahomeyan segment of the borehole than in the Togo segment of the borehole indicating that the Dahomeyan rocks are K-feldspar richer than the To- go rocks, though; both rock types are generally feldspar rich. This shows that the Dahomeyan formations are a higher grade metamorphic rocks which were formed under higher temperatures and pressures. The Togo rocks on the other hand, have higher iron content as compared to the Dahomeyan; and therefore abound in iron miner- als such as biotite and hornblende which are predomi- nant minerals in the Togo schist, quartzite and phyllite; the main rock types of the Togo formations [8]. Biotite schist crystallizes from a relative lower temperatures therefore it can be established that the Togo formations were formed under relatively lower temperatures there- fore the two terranes—the Togo rocks and the Da- homeyan rocks were formed under different geothermal conditions with the Dahomeyan being formed under higher geothermal gradient. Elemental occurrences varied in the Togo rocks and 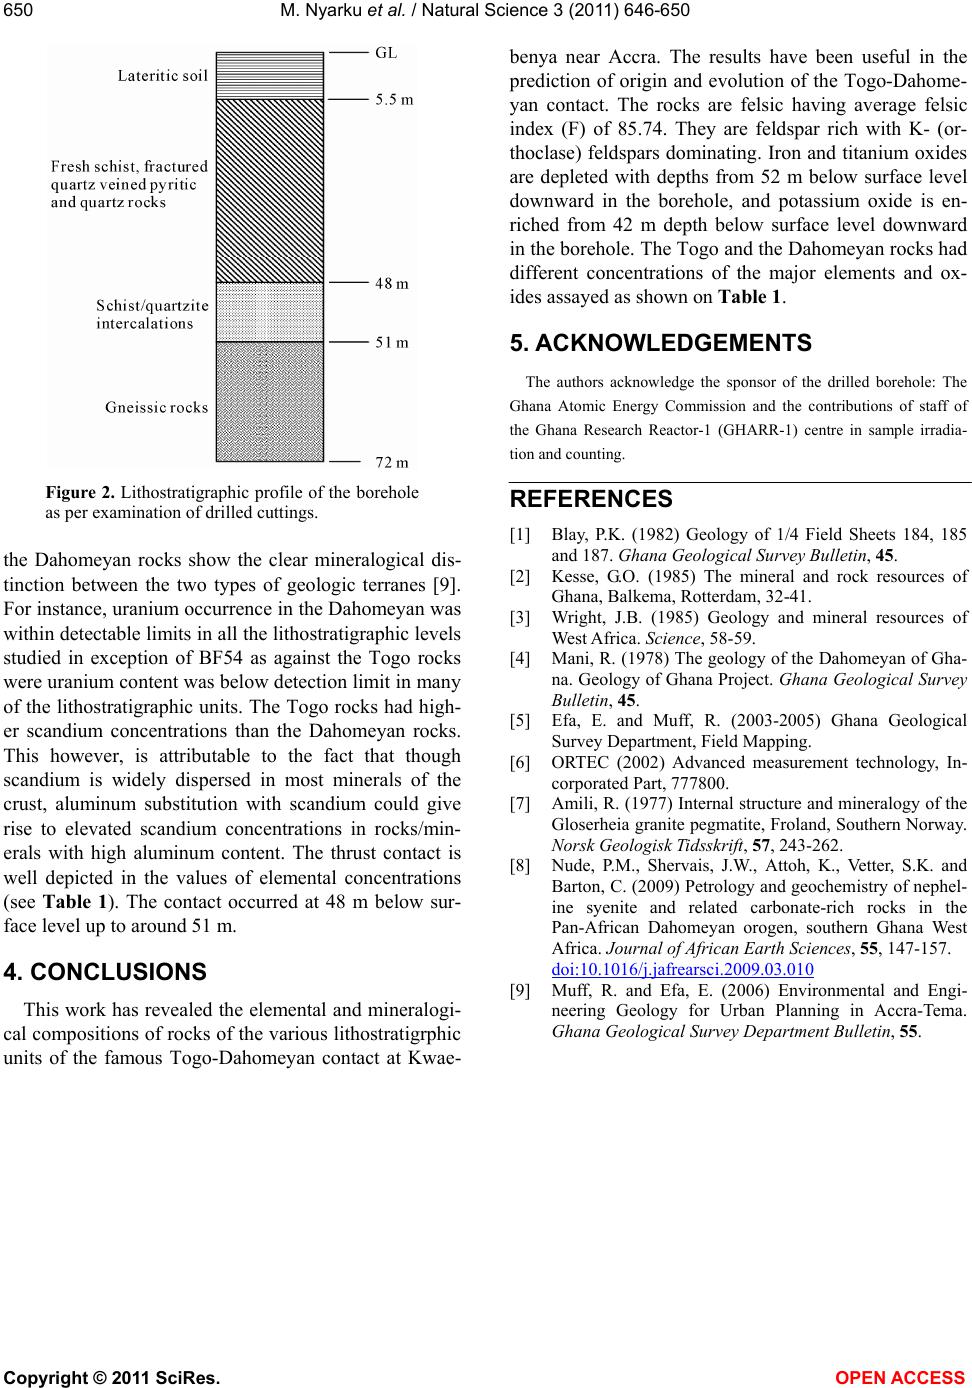 M. Nyarku et al. / Natural Science 3 (2011) 646-650 Copyright © 2011 SciRes. OPEN ACCESS 650 Figure 2. Lithostratigraphic profile of the borehole as per examination of drilled cuttings. the Dahomeyan rocks show the clear mineralogical dis- tinction between the two types of geologic terranes [9]. For instance, uranium occurrence in the Dahomeyan was within detectable limits in all the lithostratigraphic levels studied in exception of BF54 as against the Togo rocks were uranium content was below detection limit in many of the lithostratigraphic units. The Togo rocks had high- er scandium concentrations than the Dahomeyan rocks. This however, is attributable to the fact that though scandium is widely dispersed in most minerals of the crust, aluminum substitution with scandium could give rise to elevated scandium concentrations in rocks/min- erals with high aluminum content. The thrust contact is well depicted in the values of elemental concentrations (see Table 1). The contact occurred at 48 m below sur- face level up to around 51 m. 4. CONCLUSIONS This work has revealed the elemental and mineralogi- cal compositions of rocks of the various lithostratigrphic units of the famous Togo-Dahomeyan contact at Kwae- benya near Accra. The results have been useful in the prediction of origin and evolution of the Togo-Dahome- yan contact. The rocks are felsic having average felsic index (F) of 85.74. They are feldspar rich with K- (or- thoclase) feldspars dominating. Iron and titanium oxides are depleted with depths from 52 m below surface level downward in the borehole, and potassium oxide is en- riched from 42 m depth below surface level downward in the borehole. The Togo and the Dahomeyan rocks had different concentrations of the major elements and ox- ides assayed as shown on Table 1. 5. ACKNOWLEDGEMENTS The authors acknowledge the sponsor of the drilled borehole: The Ghana Atomic Energy Commission and the contributions of staff of the Ghana Research Reactor-1 (GHARR-1) centre in sample irradia- tion and counting. REFERENCES [1] Blay, P.K. (1982) Geology of 1/4 Field Sheets 184, 185 and 187. Ghana Geological Survey Bulletin, 45. [2] Kesse, G.O. (1985) The mineral and rock resources of Ghana, Balkema, Rotterdam, 32-41. [3] Wright, J.B. (1985) Geology and mineral resources of West Africa. Science, 58-59. [4] Mani, R. (1978) The geology of the Dahomeyan of Gha- na. Geology of Ghana Project. Ghana Geological Survey Bulletin, 45. [5] Efa, E. and Muff, R. (2003-2005) Ghana Geological Survey Department, Field Mapping. [6] ORTEC (2002) Advanced measurement technology, In- corporated Part, 777800. [7] Amili, R. (1977) Internal structure and mineralogy of the Gloserheia granite pegmatite, Froland, Southern Norway. Norsk Geologisk Tidsskrift, 57, 243-262. [8] Nude, P.M., Shervais, J.W., Attoh, K., Vetter, S.K. and Barton, C. (2009) Petrology and geochemistry of nephel- ine syenite and related carbonate-rich rocks in the Pan-African Dahomeyan orogen, southern Ghana West Africa. Journal of African Earth Sciences, 55, 147-157. doi:10.1016/j.jafrearsci.2009.03.010 [9] Muff, R. and Efa, E. (2006) Environmental and Engi- neering Geology for Urban Planning in Accra-Tema. Ghana Geological Survey Department Bulletin, 55. |