

Paper Menu >>
Journal Menu >>
 Journal of Software Engineering and Applications, 2011, 4, 491-496 doi:10.4236/jsea.2011.48057 Published Online August 2011 (http://www.SciRP.org/journal/jsea) Copyright © 2011 SciRes. JSEA 491 The Use of Fuzzy Clustering and Correlation to Implement an Heart Disease Diagnosing System in FPGA Evaldo Renó Faria Cintra, Tales Cleber Pimenta, Robson Luiz Moreno Federal University of Itajuba, Itajuba, Brazil. Email: [email protected] Received June 11th, 2011, revised July 13th, 2011, accepted July 20th, 2011. ABSTRACT In this paper we present a signal processing method capable of detecting cardiopathies in electrocardiograms that was implemented in FPGA. The adopted procedure is based on fuzzy clustering to reduce the amount of data sampling, and a comparison with samples from a previously established database. By using the correlation method on the samples, it is possible to establish an initial indication of a cardiopathy. The reduced number of samples of the clustering process turns the processing simpler and allows its hardware implementation. According to the tests conducted, the method achieves 91% correct diagnoses. Keywords: Cardiopathy, Heart, Correlation, Fuzzy Clustering, Electrocardiogram 1. Introduction Due to the large number of death caused by heart dis- eases, researchers have been working on the search for solutions that can provide early detection of heart prob- lems, and thus increase the chance of survival [1-3]. In order to diagnose a cardiopathy some factors are taken into account such as patient’s age and physical activity. Nevertheless, the main analysis is based on the electrocardiogram. Some studies [2-6] describe computer systems running signal processing techniques that evalu- ate the characteristics of the electrocardiograms to obtain a preliminary diagnosis of any disease. Those techniques turn possible an automatic patient diagnostic system. It allows remote monitoring that can trigger an alarm to notify the patient or the medical team, which in turn can take early actions to treat the problem as soon as it ap- pears. This article intends to show a signal processing tech- nique that uses fuzzy clustering to reduce the amount of data to be processed, and a correlation method used to identify heart problems on the electrocardiogram. The smaller amount of data means also hardware simplifica- tion. It does allow FPGA implementation and provides diagnosis similar to software implementations [4-6], as it will be shown in Section 6. Due to the presence of noise and DC components in the electrocardiograms, signal processing tools such as the third order Butterworth filter were used. The elimina- tion of DC level allows more accuracy to the results. The signal is them compared to a signal database and a correlation value between then is generated. The diag- nosed cardiopathy corresponds to the signal from the database that shows the highest direct correlation with the signal under analysis. Next section presents the electrocardiogram and its main features that are used to diagnose a cardiopathy. Section three describes the fuzzy clustering process that is used to reduce the processing. The fourth section pre- sents the diagnosis based on the correlation. Section five describes validating system. The sixth section describes the tests conducted and finally the last section presents the conclusions and compares our results with others listed in the literature. 2. Electrocardiogram The electrocardiogram is a test widely used to assess cardiac rhythm disturbances. By using electrocardiogram, it is possible obtain information of structural cardiac problems such as myocardial ischemia, myocardial elec- trophysiological disturbances, pericardial diseases, heart position, cardiac pacing, systemic electrolytic and meta-  The Use of Fuzzy Clustering and Correlation to Implement an Heart Disease Diagnosing System in FPGA 492 bolic alterations, documentation of autonomous and pharmacological influences (therapeutic or toxic) [1]. The exam also shows the entire heart conduction path. Figure 1 highlights the main signal segments of a typical ECG signal. Segment P represents the depolariza- tion that runs on both atriums, starting on the right atrium and later on the left one. The segment represented by PR is the time interval the electric pulse flows in the His, and the left and right branches. It indicates the beginning of the atrium activation until the ventricular activation. The ventricular depolarization is represented by seg- ment QRS. The Q wave is the negative segment just be- fore the positive QRS. The R wane is the positive part of the QRS, and the S wave is the negative segment just after the positive QRS. The ST segment corresponds to the beginning of the ventricular repolarization. The T wave describes the final ventricular repolarization. The diagnosis of a cardiopathy is made by assessing and detecting any amplitude variation or time variation during each interval 3. Fuzzy Clustering The fuzzy clustering process for data pruning [7] allows the system to process a smaller number of samples to describe the main features of the original signal. There- fore, the required processing to generate the signal diag- nosis is faster and consequently the required hardware to process it can be simplified. The clustering process consists on the application of orthogonal transformations and fuzzy clustering to ex- tract the fuzzy rules from the input data. Each cluster is characterized by a function that indicates the output ten- dency due to an input near to certain values. That process can be used to create a control system. The control actions are implemented by a system training in which the clusters are generated, and their respective P PR QRS ST T Figure 1. Typical electrocardiogram waveform with seg- ment indication. memberships will perform the actions at the system out- put. In this system we have used known values at input and the system is conditioned to generate the desired output. Therefore, the generated clusters are functions that will provide the correct output, according to their cluster training. In this work, the clustering process was used to iden- tify the position and value of each cluster, since they are generated to operate in the most relevant points of the input signal in order to generate the output control. The input signal used to generate the clusters is the electro- cardiogram with a cardiopathy. Therefore, the generated clusters describe the main features of a signal with a cer- tain cardiopathy [7]. In this work, the clustering process is used to indicate the value and location of each cluster, without requiring the generation of functions or rules corresponding to each cluster. Consider the set of N input-output data pairs where X is the n dimensional input vector 12 ,,, n X xx x corresponding to the acquisition time of each electrocar- diogram signal and vector 12 ,,, n y yYy is the electrocardiogram samples generated each time for vec- tor X. Here, n corresponds to the nth sample. The parameters ai and bi of the corresponding func- tions in each rule are obtained through expression (1) [7]. 1 .. T. T X XX y (1) where, 12 .,.,,. eeMe X XX X (2) According to expression (2), Xe is a matrix ,1 e X X i , and the activation of each rule is provided by , which is a diagonal matrix whose normalized degree is the diagonal element. ki u 1 () ik ki M i i A x u A k (3) where, ki —is the normalized degree of participation of each input for rule Ri [7]: u Ai is a group of fuzzy antecessors of a given i–rule, given by expression (4) [7]. 1 ()( ) n iij j i A x x (4) where the membership degree of each rule, regarding to the input xi, is given by μij. Once Ai is achieved, the normalized degree of ante- cessor for rule Ri can be obtained. By running the algorithm for the reduction of number Copyright © 2011 SciRes. JSEA 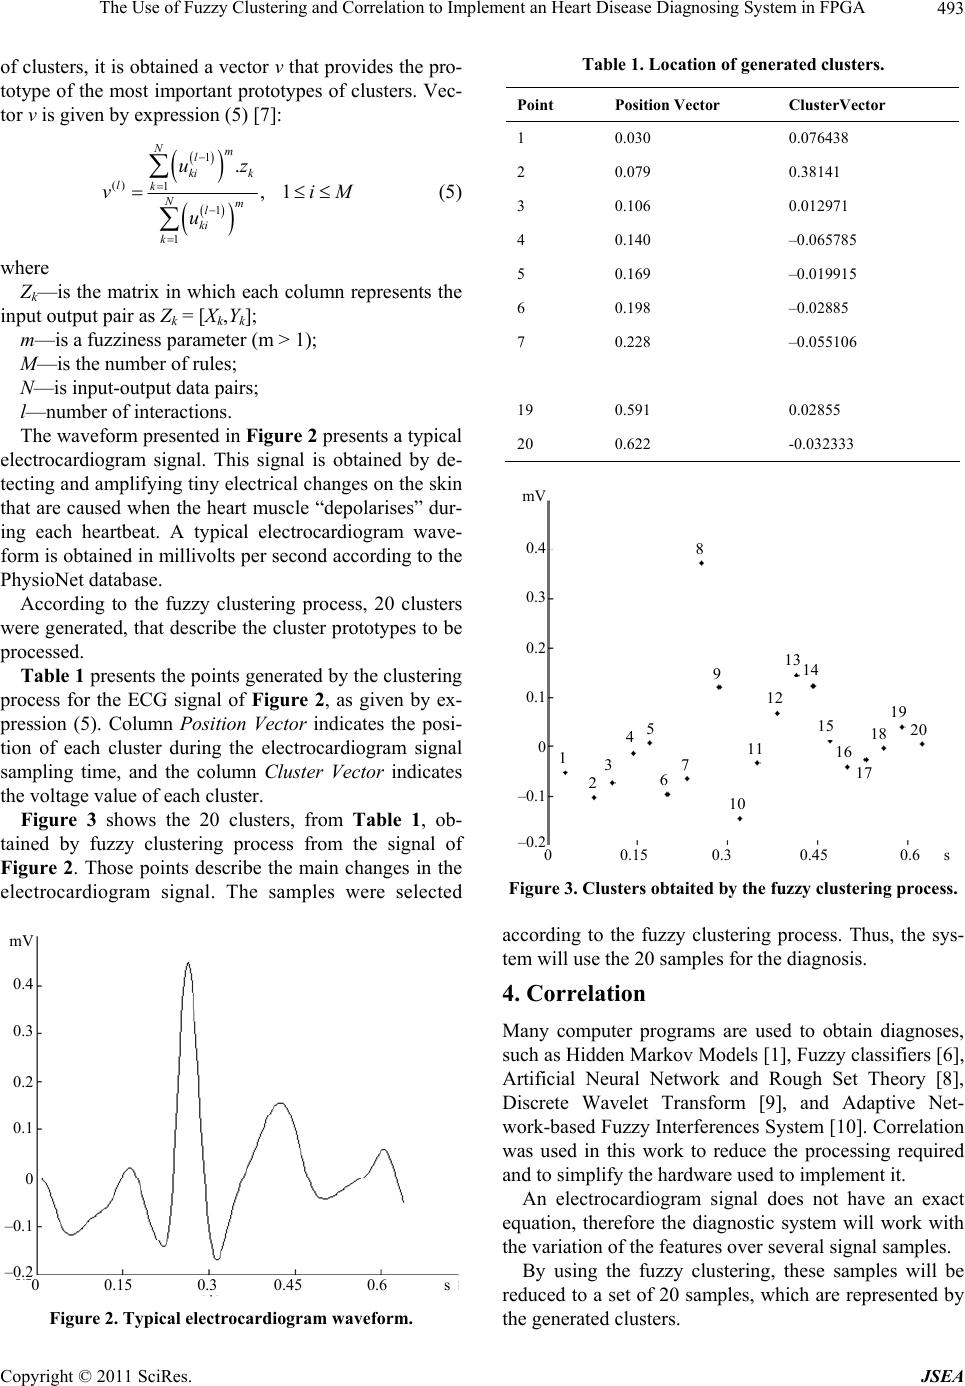 The Use of Fuzzy Clustering and Correlation to Implement an Heart Disease Diagnosing System in FPGA493 of clusters, it is obtained a vector v that provides the pro- totype of the most important prototypes of clusters. Vec- tor v is given by expression (5) [7]: 1 () 1 1 1 . ,1 Nm l ki k lk Nm l ki k uz vi u M (5) where Zk—is the matrix in which each column represents the input output pair as Zk = [Xk,Yk]; m—is a fuzziness parameter (m > 1); M—is the number of rules; N—is input-output data pairs; l—number of interactions. The waveform presented in Figure 2 presents a typical electrocardiogram signal. This signal is obtained by de- tecting and amplifying tiny electrical changes on the skin that are caused when the heart muscle “depolarises” dur- ing each heartbeat. A typical electrocardiogram wave- form is obtained in millivolts per second according to the PhysioNet database. According to the fuzzy clustering process, 20 clusters were generated, that describe the cluster prototypes to be processed. Table 1 presents the points generated by the clustering process for the ECG signal of Figure 2, as given by ex- pression (5). Column Position Vector indicates the posi- tion of each cluster during the electrocardiogram signal sampling time, and the column Cluster Vector indicates the voltage value of each cluster. Figure 3 shows the 20 clusters, from Table 1, ob- tained by fuzzy clustering process from the signal of Figure 2. Those points describe the main changes in the electrocardiogram signal. The samples were selected 0 0.15 0.3 0.45 0.6 s mV 0.4 0.3 0.2 0.1 0 –0.1 – 0.2 Figure 2. Typical electrocardiogram waveform. Table 1. Location of generated clusters. Point Position Vector ClusterVector 1 0.030 0.076438 2 0.079 0.38141 3 0.106 0.012971 4 0.140 –0.065785 5 0.169 –0.019915 6 0.198 –0.02885 7 0.228 –0.055106 19 0.591 0.02855 20 0.622 -0.032333 1 13 2 45 6 7 8 9 11 12 13 10 14 15 16 17 18 19 20 0 0.15 0.3 0.45 0.6 s mV 0.4 0.3 0.2 0.1 0 –0.1 –0.2 Figure 3. Clusters obtaited by the fuzzy clustering process. according to the fuzzy clustering process. Thus, the sys- tem will use the 20 samples for the diagnosis. 4. Correlation Many computer programs are used to obtain diagnoses, such as Hidden Markov Models [1], Fuzzy classifiers [6], Artificial Neural Network and Rough Set Theory [8], Discrete Wavelet Transform [9], and Adaptive Net- work-based Fuzzy Interferences System [10]. Correlation was used in this work to reduce the processing required and to simplify the hardware used to implement it. An electrocardiogram signal does not have an exact equation, therefore the diagnostic system will work with the variation of the features over several signal samples. By using the fuzzy clustering, these samples will be reduced to a set of 20 samples, which are represented by the generated clusters. Copyright © 2011 SciRes. JSEA  The Use of Fuzzy Clustering and Correlation to Implement an Heart Disease Diagnosing System in FPGA 494 The clusters generated by the fuzzy clustering process are compared with the clusters of signals from a database, whose diagnosis is known. This comparison is done by calculating the correlation among them. In calculating the correlation, three outcomes are possible: If the correlation value is equal or close to –1, it indi- cates a strong inverse correlation between two sig- nals; If the result of correlation is equal or close to zero, it indicates no correlation among the signals compared; If the result of correlation is equal or close to 1, it in- dicates a strong direct correlation among the signals compared. The system will identify the diagnosis as the signal from the database that receives the highest correlation with the assessed signal. The calculation of correlation between two signals can be obtained by expression (6) [11]: x y x y n (6) where, ρ—is the correlation value; x—is calculated according to expression (7). x XMX (7) X—is the set of points of the sampled signal; MX—is the arithmetic mean of these sampled points, given as (8): X MX n (8) y—is given by equation (9): y YMY (9) Y—is the set of points of the signal pattern to be com- pared; MY—is the arithmetic mean of these sampled points, given as (10): Y MY n (10) n—is the number of points for X and Y; σx—is the standard deviation of x; σy—is the standard deviation of y. According to the correlation calculation presented by equation (6), it can be observed that by using the fuzzy clustering process of the number of points to be proc- essed in the correlation are smaller, thus the processing time becomes shorter. 5. Validation System In order to demonstrate the effectiveness of the tech- niques previously described, a system was created to validate the proposed method. The validation system receives the electrocardiogram signal samples to be di- agnosed. The signal is filtered and the most important features of the signal are obtained by the clustering proc- ess. The diagnostics can be obtained from the smaller set by correlation. The proposed system was simulated on MATLAB®. The electrocardiogram signals used to create the database and to perform the tests were obtained from PhysioNet database [1]. After the simulation, the system was vali- dated in an FPGA implementation on a XILINX Spar- tan®-3A Starter FPGA. Figure 4 shows a summary of the validation system used [1]. The Physionet Data presented in Figure 4 represents the electrocardiogram signal acquisition. Each signal is represented by 2,500 samples at a sampling frequency of 333 Hz. In the first block, the sampled signal is digitally fil- tered by a third–order Butterworth low-pass filter. The main feature of the filter is a flat frequency response in its bandwidth and a zero response outside its bandwidth. The magnitude of the N–order function with a bandwidth cutoff frequency p w is given by expression (11). 2 2 1 1 N p Tjw w ew (11) Figure 5 shows the Butterworth filter response. It was calculated the arithmetic average of the signal in order and them subtracted from the signal on each sam- ple in order to eliminate the DC offset. In the second block, 20 samples are separated to be processed by the fuzzy clustering process. The input sig- nal samples are processed according to expression 1. The block outputs the 20 samples, obtained by the clustering system. In the third block, the 20 samples are correlated with the database signal samples, as described in Section IV. It outputs the generated correlation values. Implementation in FPGA Physionet Data Block 1 Block 2 Block 4 Block 3 Leads of ECG signals samples Digital Filter and eliminate DC level Clustering process Corre lat ion Probable Diagnosis Figure 4. Block diagram of the validation system. Copyright © 2011 SciRes. JSEA 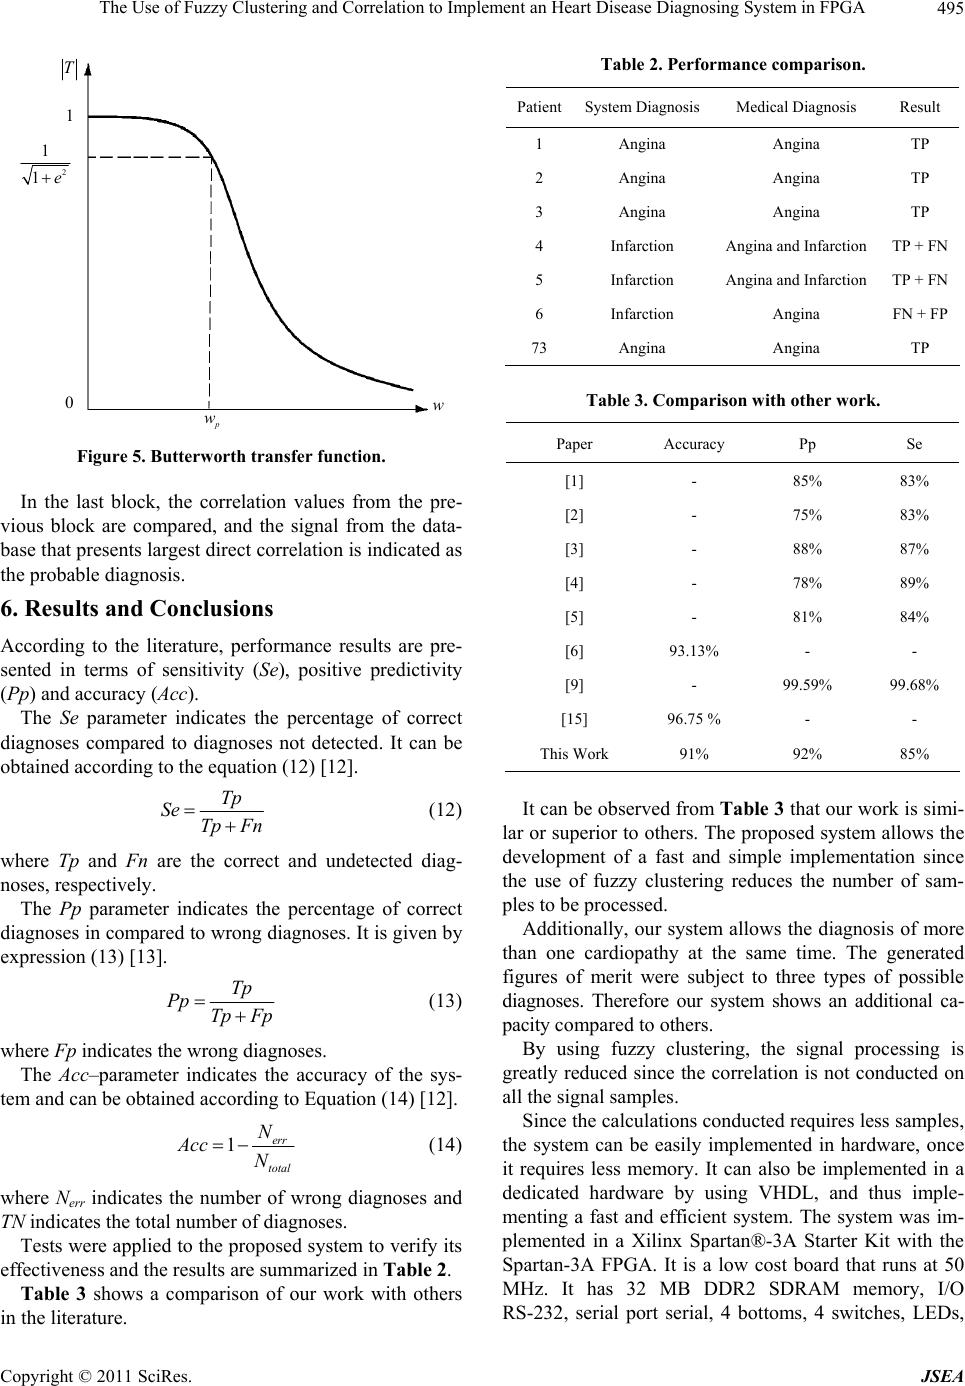 The Use of Fuzzy Clustering and Correlation to Implement an Heart Disease Diagnosing System in FPGA495 2 1 1e 1 0 p w w T Figure 5. Butterworth transfer function. In the last block, the correlation values from the pre- vious block are compared, and the signal from the data- base that presents largest direct correlation is indicated as the probable diagnosis. 6. Results and Conclusions According to the literature, performance results are pre- sented in terms of sensitivity (Se), positive predictivity (Pp) and accuracy (Acc). The Se parameter indicates the percentage of correct diagnoses compared to diagnoses not detected. It can be obtained according to the equation (12) [12]. Tp Se Tp Fn (12) where Tp and Fn are the correct and undetected diag- noses, respectively. The Pp parameter indicates the percentage of correct diagnoses in compared to wrong diagnoses. It is given by expression (13) [13]. Tp Pp Tp Fp (13) where Fp indicates the wrong diagnoses. The Acc–parameter indicates the accuracy of the sys- tem and can be obtained according to Equation (14) [12]. 1err total N Acc N (14) where Nerr indicates the number of wrong diagnoses and TN indicates the total number of diagnoses. Tests were applied to the proposed system to verify its effectiveness and the results are summarized in Table 2. Table 3 shows a comparison of our work with others in the literature. Table 2. Performance comparison. PatientSystem DiagnosisMedical Diagnosis Result 1 Angina Angina TP 2 Angina Angina TP 3 Angina Angina TP 4 Infarction Angina and Infarction TP + FN 5 Infarction Angina and Infarction TP + FN 6 Infarction Angina FN + FP 73 Angina Angina TP Table 3. Comparison with other work. Paper Accuracy Pp Se [1] - 85% 83% [2] - 75% 83% [3] - 88% 87% [4] - 78% 89% [5] - 81% 84% [6] 93.13% - - [9] - 99.59% 99.68% [15] 96.75 % - - This Work 91% 92% 85% It can be observed from Table 3 that our work is simi- lar or superior to others. The proposed system allows the development of a fast and simple implementation since the use of fuzzy clustering reduces the number of sam- ples to be processed. Additionally, our system allows the diagnosis of more than one cardiopathy at the same time. The generated figures of merit were subject to three types of possible diagnoses. Therefore our system shows an additional ca- pacity compared to others. By using fuzzy clustering, the signal processing is greatly reduced since the correlation is not conducted on all the signal samples. Since the calculations conducted requires less samples, the system can be easily implemented in hardware, once it requires less memory. It can also be implemented in a dedicated hardware by using VHDL, and thus imple- menting a fast and efficient system. The system was im- plemented in a Xilinx Spartan®-3A Starter Kit with the Spartan-3A FPGA. It is a low cost board that runs at 50 MHz. It has 32 MB DDR2 SDRAM memory, I/O RS-232, serial port serial, 4 bottoms, 4 switches, LEDs, Copyright © 2011 SciRes. JSEA 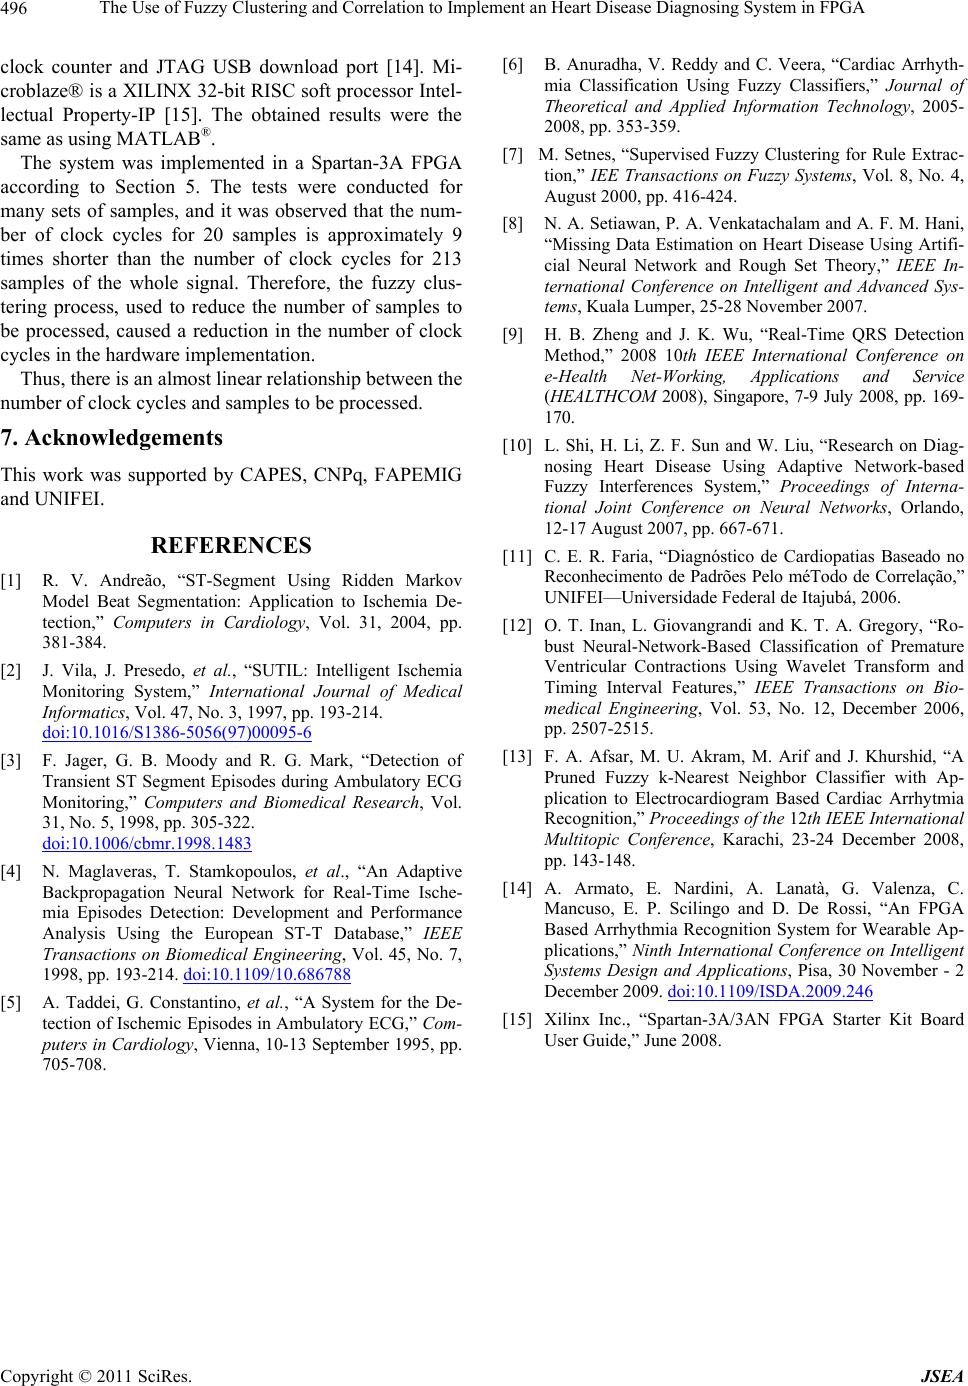 The Use of Fuzzy Clustering and Correlation to Implement an Heart Disease Diagnosing System in FPGA Copyright © 2011 SciRes. JSEA 496 clock counter and JTAG USB download port [14]. Mi- croblaze® is a XILINX 32-bit RISC soft processor Intel- lectual Property-IP [15]. The obtained results were the same as using MATLAB®. The system was implemented in a Spartan-3A FPGA according to Section 5. The tests were conducted for many sets of samples, and it was observed that the num- ber of clock cycles for 20 samples is approximately 9 times shorter than the number of clock cycles for 213 samples of the whole signal. Therefore, the fuzzy clus- tering process, used to reduce the number of samples to be processed, caused a reduction in the number of clock cycles in the hardware implementation. Thus, there is an almost linear relationship between the number of clock cycles and samples to be processed. 7. Acknowledgements This work was supported by CAPES, CNPq, FAPEMIG and UNIFEI. REFERENCES [1] R. V. Andreão, “ST-Segment Using Ridden Markov Model Beat Segmentation: Application to Ischemia De- tection,” Computers in Cardiology, Vol. 31, 2004, pp. 381-384. [2] J. Vila, J. Presedo, et al., “SUTIL: Intelligent Ischemia Monitoring System,” International Journal of Medical Informatics, Vol. 47, No. 3, 1997, pp. 193-214. doi:10.1016/S1386-5056(97)00095-6 [3] F. Jager, G. B. Moody and R. G. Mark, “Detection of Transient ST Segment Episodes during Ambulatory ECG Monitoring,” Computers and Biomedical Research, Vol. 31, No. 5, 1998, pp. 305-322. doi:10.1006/cbmr.1998.1483 [4] N. Maglaveras, T. Stamkopoulos, et al., “An Adaptive Backpropagation Neural Network for Real-Time Ische- mia Episodes Detection: Development and Performance Analysis Using the European ST-T Database,” IEEE Transactions on Biomedical Engineering, Vol. 45, No. 7, 1998, pp. 193-214. doi:10.1109/10.686788 [5] A. Taddei, G. Constantino, et al., “A System for the De- tection of Ischemic Episodes in Ambulatory ECG,” Com- puters in Cardiology, Vienna, 10-13 September 1995, pp. 705-708. [6] B. Anuradha, V. Reddy and C. Veera, “Cardiac Arrhyth- mia Classification Using Fuzzy Classifiers,” Journal of Theoretical and Applied Information Technology, 2005- 2008, pp. 353-359. [7] M. Setnes, “Supervised Fuzzy Clustering for Rule Extrac- tion,” IEE Transactions on Fuzzy Systems, Vol. 8, No. 4, August 2000, pp. 416-424. [8] N. A. Setiawan, P. A. Venkatachalam and A. F. M. Hani, “Missing Data Estimation on Heart Disease Using Artifi- cial Neural Network and Rough Set Theory,” IEEE In- ternational Conference on Intelligent and Advanced Sys- tems, Kuala Lumper, 25-28 November 2007. [9] H. B. Zheng and J. K. Wu, “Real-Time QRS Detection Method,” 2008 10th IEEE International Conference on e-Health Net-Working, Applications and Service (HEALTHCOM 2008), Singapore, 7-9 July 2008, pp. 169- 170. [10] L. Shi, H. Li, Z. F. Sun and W. Liu, “Research on Diag- nosing Heart Disease Using Adaptive Network-based Fuzzy Interferences System,” Proceedings of Interna- tional Joint Conference on Neural Networks, Orlando, 12-17 August 2007, pp. 667-671. [11] C. E. R. Faria, “Diagnóstico de Cardiopatias Baseado no Reconhecimento de Padrões Pelo méTodo de Correlação,” UNIFEI—Universidade Federal de Itajubá, 2006. [12] O. T. Inan, L. Giovangrandi and K. T. A. Gregory, “Ro- bust Neural-Network-Based Classification of Premature Ventricular Contractions Using Wavelet Transform and Timing Interval Features,” IEEE Transactions on Bio- medical Engineering, Vol. 53, No. 12, December 2006, pp. 2507-2515. [13] F. A. Afsar, M. U. Akram, M. Arif and J. Khurshid, “A Pruned Fuzzy k-Nearest Neighbor Classifier with Ap- plication to Electrocardiogram Based Cardiac Arrhytmia Recognition,” Proceedings of the 12th IEEE International Multitopic Conference, Karachi, 23-24 December 2008, pp. 143-148. [14] A. Armato, E. Nardini, A. Lanatà, G. Valenza, C. Mancuso, E. P. Scilingo and D. De Rossi, “An FPGA Based Arrhythmia Recognition System for Wearable Ap- plications,” Ninth International Conference on Intelligent Systems Design and Applications, Pisa, 30 November - 2 December 2009. doi:10.1109/ISDA.2009.246 [15] Xilinx Inc., “Spartan-3A/3AN FPGA Starter Kit Board User Guide,” June 2008. |