

Paper Menu >>
Journal Menu >>
 Materials Sciences and Applicatio n, 2011, 2, 940-945 doi:10.4236/msa.2011.27125 Published Online July 2011 (http://www.SciRP.org/journal/msa) Copyright © 2011 SciRes. MSA The Physical and Biological Properties of NanoTiO2 Material Xiao Feng Pang Institute of Life Science and Technology, University of Electronic Science and Technology of China, Chengdu; P.R.China and In- ternational Centre of Materials Physics, Chinese Academy of Sciences, Shengyang, P.R.China. Email: [email protected] Received May 28th, 2010; revised June 12th, 2010; accepted May 30th, 2011. ABSTRACT The physical and biological properties of TiO2 materials including NanoTiO2, micrometerTiO2 and NanoTiO2 tubes have been studied using scanning electron and infrared spectrometer, X-ray diffraction instrument as well as 3-(4,5- di- methylthiazol 2-yl)-2,5 diphenyltetrazo-lium bromide (MTT) colorimetric method, respectively. These materials are pre- pared by chemical deposition and anode oxidation methods, respectively. The sizes of NanoTiO2 are 80 nm and 1000 nm, respectively, their infra red properties of absorption are differen t, the characteristic peaks of the former are 1271, 1615, 2957 and 3422 cm–1, the latter are 1645 and 2356 cm–1. The NanoTiO2 tubes can be formed by anode oxidation method, its diameters are between 50 - 100 nm, different NanoTiO2 tubes contain different components of oxygen and titanium. In MTT experiment we discover the changes of properties of proliferation of the liver and chick embryo fibroblast cells un- der influences of NanoTiO2 relative to those of the controlled groups, when small NanoTiO2 suspension is added in these cultivated liquids of cell, but the influence of NanoTiO2 on the proliferation of the person’s liver cell is still very small, therefore, the toxicities of N anoTi O 2 co nt ai ni ng 80 nm and 1000 nm to these cells are still first score. Keywords: NanoTiO2, Micrometer TiO2, NanTiO2 Tube, Infrared and X-Diffraction Spectrum, MTT Method, Cell, Biological and Physical Property 1. Introduction At present, the Nanomaterials and Nanotechnology and Nanoinstrument have been greatly developed and applied extensively in the industry, agriculture, science and medicine as well as our living. A lot of Nanomaterials have been made in bulk in factory and were sold in mar- kets. In such a case it is very necessary to know whether these Nanomaterials are safe, or speaking, have toxicity to the person’s and animal’s health [1-4]. This problem attracts scientist’s and government’ attentions in the world. Thus studying the safety or toxicity of the Nano- materials has important significances in sciences and applications. In this paper we will study the physical and biological properties of NanoTiO2. TiO2 is a kind of crystal, in which one titanium (Ti) atom combines with six oxygen (O) atoms, one oxygen atom links again three titanium atoms to form an octagon. Thus, TiO2 belongs in the inclined crystalline system and is a semiconductor material. In this structure of crystal the width of forbidden band between the valence band and conductive band is between 3.0 eV - 3.2 eV. There- fore, TiO2 can easily absorb the ultraviolet light with wavelength of 387 nm and414nm. Just so, single crystal TiO2 can decompose water and other substances under action of the light. Hence TiO2 is a good material of photocatalytic materials. Its photocatalytic theorem can be described as follows. Under action of incident light the electrons in the valence band transit into the conduc- tive band (e–), then the holes (h+) occur in valence band in TiO2. This reaction is represented by –+ 22 TiO+ hνTiOe ,h. These electrons and holes occurred are shifted on the surface of TiO2 under action of an electric-field and can interact further with other materials through the following oxidation and reduction reactions: ++ 2 h+H OH+H + h+OH OH , –– 22 O+e O – 22 O+H OOOOH+OH, , 22 2 OOOHO+HO 2 –– 222 OOOH+H O+eH O+OH, –– 22 H O+eOH+OH,.  The Physical and Biological Properties of NanoTiO Material941 2 In these processes a great number of free radicals of ,and are generated, which have strong ability of oxidation and can interact and react with plenty of materials, such as chloroform, PCBS, organic compounds, formaldehyde. Therefore, the NanoTiO2 have extensively applications in medicine, agriculture and industry, containing chemical engineering, paint, paper, plastic, rubber, chemical fiber, electric-appliances, cosmetics and food packaging [4-7]. - OH - 2 OOOOH For the NanoTiO2, which is different from that of bulk TiO2due to its scale to become very small, such as, it has larger rate of surface area versus volume about 70 m2/g, its surface energy raises, the ratio of number of atom between the surface and interior increases, the number of the coordination of atoms in it is lowered, when com- pared with that in bulk [3-4]. Thus the physical and chemical activities as well as unstablities of NanoTiO2 are increased correspondingly. Meanwhile, it is also quite difficultly resolved in water, but when a lot of NanoTiO2 are collected together, they can combines and concretes each other to form gluey state in water. These gluey states of the NanoTiO2 are easily spitted, if some elec- trolytes are added into this solution, or the PH value of solution is changed. Meanwhile, it can also form some new bases or chemical compound, such as, TiOH, K2O-6 TiO2 or K2Ti6O13, etc., with water molecules or ions, involving OH, NH2, COOH, C = O, through attraction interaction between the particles with charges on the surface. Therefore, it is very necessary to investigate in-depth the physical and biological properties of Nano- TiO2. 2. Experimental Method We prepare three kinds of TiO2 materials containing the NanoscaleTiO2, microscale TiO2 and NanoTiO2 tubes by using chemical deposition and anode oxidation methods, respectively. Their features of structures are measured using Scanning Electron Spectrometer (SEM), respec- tively, its infrared properties of absorption and X-diffraction spectra are measured using a Nicolet Nexus 670-FT-IR spectrometer with resolution of 4 cm–1 and X-ray diffraction spectrometer, respectively. The prolif- eration and toxicity of NanoTiO2 to the person’s liver and chick embryo fibroblast (CEF) cells are determined by MTT colorimetric method [8]. So-called MTT colorimetric method [8] is just a very effective way checking the states of activity and prolif- eration of the cells. In this way the coloration substance used is MTT. The MTT is an abbreviation of 3-(4, 5-dimethylthiazol 2-yl)-2, 5 diphenyltetrazolium bromide, which is a sort of dye accepting hydrogen atom. In the mitochondrion of cell, the externally applied yellow te- trazolium salt 3-(4, 5-dimethylthiazol 2-yl)-2, 5 di- phenyl-tetrazolium bromide (MTT, Amersco) will be reduced and become further, under the action of dehy- drogenase of amber acid, as a blue insoluble formazan form, which is eventually deposited in the cell after this reaction. But the dead cell has not this function and effect. The dimethylsulfoxide (DMSO) added can resolve the blue insoluble formazan. The quantity of the blue insolu- ble formazan produced after the resolution is propor- tional with the number of cell participated in this process. Thus we can determine indirectly the number of the cells through measuring the strength of absorption of the light with determinate wavelengths in this case. The strength of light can be measured and collected by enzymic im- munoassay instrument and spectrophotometer. Then we can determine the number of proliferation and activity of cells or of biological factors in the cells, thus we can as- sess the safety or toxicity of NanoTiO2 to the cell, etc., according to the toxicology. The advantages of the me- thod measuring this security or toxicity is fast and accu- rate, and have higher sensitivity and very good repeat- ability. Therefore, we here utilize this method to assess the influences of NanoTiO2 on the proliferation states of person’s liver cell (L-20) after it interacts with the Nano- TiO2 by traditional biological technique. The experimen- tal process in this method is as follows. 2.1. Cell Growth The person’s liver and primary chick embryo fibroblast (CEF) cells are prepared, their secondary cultures are grown in the 5% CO2 enriched incubator with tempera- ture of 37˚C. The person’s liver and CEF cells were grown in RPMI1 640(Hyclone,American) supplemented with 5% fetal calf serum (FCS, Biological Industries, BaiAn, China). Microscopic inspection to them verifies that the cells are not contaminated from third passage, and so forth. 2.2. The Nanotio2 is Added into the Group Solutions In our experiments, 4 × 10⁵ cells per well are seeded in 60-well micro-culture plates and allowed to continually grow. The 60-well cells are added into the 100 μL/well foster liquids containing the fetal calf serum in which the 1 mL/250 mL insulin liquid is included. The NanoTiO2s are added into these wells to study the influences of the NanoTiO2 on the proliferation behavior of the person’s liver and CEF cells. In this experiment these cells are separated as controlled and experimental groups, which are all 30 well. The NanoTiO2s are assigned in the fol- lowing rule. (a) the first or controlled group is 30 wells, which the 15 mL/ well foster liquid without the fetal calf serum is added into; (b) the second or experiment group 1 has 10 wells, in which the 5 μL NanoTiO2 suspension Copyright © 2011 SciRes. MSA  The Physical and Biological Properties of NanoTiO Material 942 2 and 10 μL foster liquid without the fetal calf serum are added, the concentration of NanoTiO2 achieves 43 μg/mL; (c) the third or experiment group 2 contains 10 wells, in which there is 10 μL NanoTiO2 suspension and 5uL foster without fetal calf serum, the concentration of the NanoTiO2 achieves 86 ug/mL; (d) the fourth or ex- periment group 3 contains 10 wells, in which 15 uL NanoTiO2 suspension is added, the concentration of the NanoTiO2 achieves 129 μg/mL. The above four groups are all placed into the CO2 enriched incubator with 37˚C to develop about 24 hours. The cell proliferation was evaluated after 24 h. 2.3. Measurement of the Proliferation of the Person’s Liver Cell We observe and measure the proliferation of the person’s liver cell (L-20) in above conditions by the MTT method [8-10] and calculate the proliferation rate of cell by using these experimental data.. In the calculation we should firstly measure the increased values of mitochondrial dehydrogenase activity as the number of cells increases. In such a case, 100 uL/ well MTT solution is prepared in PBS (5 mg/mL) and further diluted (10%v/v) in RPMI 1640. The cell growth medium is aspirated. In this case the 100 μL of MTT solution are added into each well in the above four groups. The cells are then further incu- bated for 4 h at 37˚C Excess of MTT solution is removed, after this the 100 μL/well DMSO is added into dissolve the blue crystals formed in the cells. The absorption strength of the DMSO solution and values of optical density (OD) of each well to the incident light with wa- velength of 570 nm for the controlled and experimental groups are measured spectrophotometrically by DG3022 enzymicimmunoassay instrument, respectively. Finally we can find out the cell proliferation rate (CPR) for the person’s liver cell by using the experimental data and the formula: CPR = [(Fexp – Fcon)/Fcon] × 100%, here Fexp is the value of optical density of experimental group, Fcon is the value of optical density of controlled group. 3. Experimental Results and Discussion 3.1. Properties of Microscale TiO2 and NanoTiO2 Tubes The structures of two kind of TiO2 using SEM are shown in Figure 1(a) and (b), respectively. This figure shows that the NanoTiO2 is 80nm, other is 1000nm. We collect their spectra of infrared absorption by 670 FT-IR instru- ment, which is shown in Figure 2. We see from this fig- ure that their infrared absorptions are different not only the strengths and frequencies of peaks of absorption but also the amounts of peaks, the new peaks at 2422, 2956 and 1271 cm–1 occur in the NanoTiO2, they are the char- (a) (b) Figure 1. The images of SEM of TiO2 powder. (a)The image of NanoTiO2 powder; (b) The image of micrometerTiO2 powder. materal 2 2356 1271 1645 materal 1 2957 3422 0.4 0.6 0.8 1.0 1.2 1.4 1.6 1.8 2.0 Absorbance 1000 2000 3000 cm–1 Figure 2. The spectra of infrared absorption for NanoTiO2 (material1) and micro TiO2 (material 2). acteristic peaks of NanoTiO2. However, in micrometer TiO2 there is only a small new peak at 2355 cm–1. Only the peak at 1645 cm–1 is same for The NanoTiO2 and Copyright © 2011 SciRes. MSA  The Physical and Biological Properties of NanoTiO2 Material Copyright © 2011 SciRes. MSA 943 micrometerTiO2. Obviously, this is due to the changes of structure and sizes of molecules of TiO2, the new peaks in Figure 2 indicate that there are many new radicals or base groups in NanoTiO2. This is just the feature of Na- nomaterials. and titanium are shown in Figure 5, where Figure 5a is the result obtained from solution of phosphoric acid and hydrofluoric acid in which the weight ratio of oxygen and titanium are 17.54% and 82.46%, respectively, their volume ratios are 38.91% and 61.09%, respectively, Figure 5b is the result obtained from solution of hydro- fluoric acid in which the weight ratio of oxygen and titanium are 24.22% and 75.78%, respectively, their volume ratios are 48.90% and 51.10%, respectively. These results manifest that not only different NanoTiO2 tubes can be obtained by different conditions in the an- ode oxidation but also the products of NanoTiO2 tubes manufactured by this method are very pure and contain not impurities. We also use SEM to measure the feature and size of NanoTiO2 tubes formed by anode oxidation method, which are shown in Figures 3-4, which are born from the surface of titanium alloy in the solutions of hydrofluoric acid as well as phosphoric acid and hydrofluoric acid, respectively. From these figures we see clearly the oc- currences of a great number of Nanotubes, which are distributed densely and nonuniformly on the surface, their sizes of diameter are different and between 50 nm and 100 nm. On the other hand, we determine the solubility of the NanoTiO2 in some liquids . Experiments show that the NanoTiO2 is insoluble in the unorganic ( as D-Han’k liquid) and organic (as DMSO) solutions and alcohols (95%) and t1 640 foster liquid without fetal calf serum, etc. In the meanwhile, we measure the X-diffraction spec- trum of NanoTiO2 tubes using X-ray diffraction instru- ment. These results for different components of oxygen 3.2. The Biological Properties of the NanoTiO2 We measured the values of optical density (OD) in MTT experiment of liver cell and changes of prolifera- tion of CEF by MTT method [8]. a) The OD values for the controlled group (30 wells) obtained are as follows, 0.37, 0.31, 0.41, 0.46, 0.54, 0.45, 0.44, 0.45, 0.42, 0.43, 0.50, 0.43, 0.51, 0.54, 0.41, 0.39, 0.52, 0.47, 0.46, o.31, 0.54, 0.38, 0.42, 0.47, 0.34, 0.41, 0.42, 0.44, 0.46. Therefore, the average value of the OD of the con- trolled group is 0.43 + 0.05 b) The OD values for the experimental groups are as follows. The OD values of the experimental group 1 (10 wells) are 0.41, 0.44, 0.41, 0.62, 0.35, 0.42, 0.77, 0.49, 0.54, 0.45. Thus, its average value of OD is 0.49 + 0.09, its PRC value is +13.95%. Figure 3. The images of SEM of NanoTiO2 tube formed in the solution of hydrofluoric acid. The OD values of the experimental group 2 (10 wells) are 0.44, 0.59, 0.40, 0.56, 0.40, 0.46, 0.32, 0.20, 0.43, 0.35. Then its average value of OD is 0.42 + 0.08, its PRC value is –2.32%. The OD values of the experimental group 3 (10 wells) are 0.45, 0.44, 0.42, 0.46, 0.46, 0.40, 0.45, 0.58, 0.35, 0.32.Then its average value of OD is 0.43 + 0.05, its PRC value is 0.0%. 3.3. Discussion of the Results From above results we can find out the average value of OD for the experimental group which is 0.45 + 0.07, its CPR value is +0.02%. This shows that the NanoTiO2 in fluences not basically the proliferation of the person’s liver cell (L-20). Figure 4. The images of SEM of NanoTiO2 tube formed in the solution of phosphoric acid and hydrofluoric ac id. 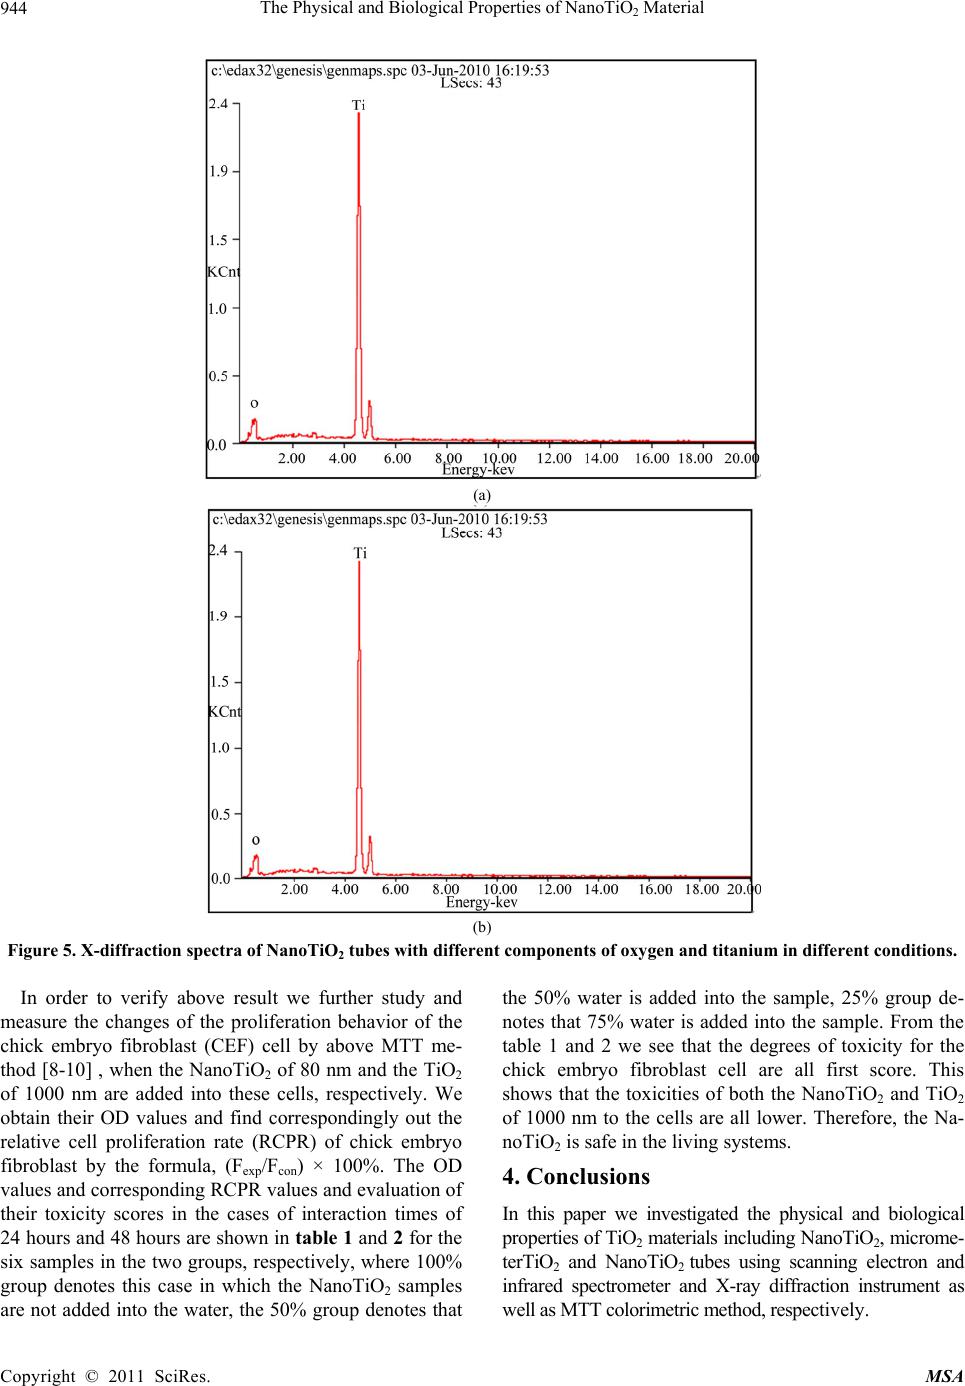 The Physical and Biological Properties of NanoTiO Material 944 2 (a) (b) Figure 5. X-diffraction spectra of NanoTiO2 tubes with different components of oxygen and titanium in different conditions. In order to verify above result we further study and measure the changes of the proliferation behavior of the chick embryo fibroblast (CEF) cell by above MTT me- thod [8-10] , when the NanoTiO2 of 80 nm and the TiO2 of 1000 nm are added into these cells, respectively. We obtain their OD values and find correspondingly out the relative cell proliferation rate (RCPR) of chick embryo fibroblast by the formula, (Fexp/Fcon) × 100%. The OD values and corresponding RCPR values and evaluation of their toxicity scores in the cases of interaction times of 24 hours and 48 hours are shown in table 1 and 2 for the six samples in the two groups, respectively, where 100% group denotes this case in which the NanoTiO2 samples are not added into the water, the 50% group denotes that the 50% water is added into the sample, 25% group de- notes that 75% water is added into the sample. From the table 1 and 2 we see that the degrees of toxicity for the chick embryo fibroblast cell are all first score. This shows that the toxicities of both the NanoTiO2 and TiO2 of 1000 nm to the cells are all lower. Therefore, the Na- noTiO2 is safe in the living systems. 4. Conclusions In this paper we investigated the physical and biological properties of TiO2 materials including NanoTiO2, microme- terTiO2 and NanoTiO2 tubes using scanning electron and infrared spectrometer and X-ray diffraction instrument as well as MTT colorimetric method, respectively. Copyright © 2011 SciRes. MSA 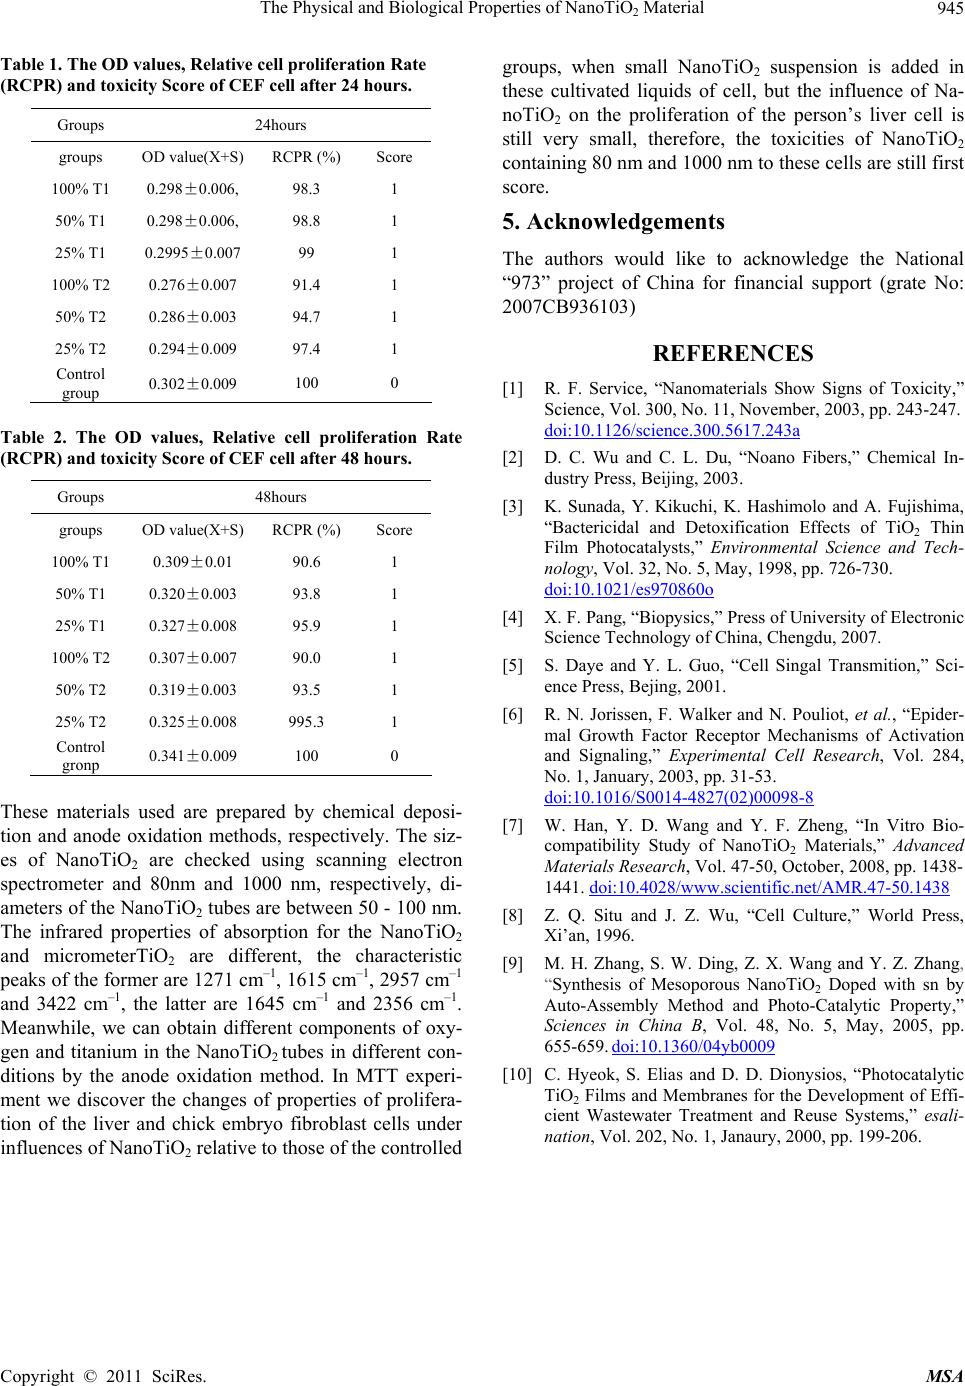 The Physical and Biological Properties of NanoTiO Material945 2 Table 1. The OD values, Relative cell proliferation Rate (RCPR) and toxicity Score of CEF cell after 24 hours. Groups 24hours groups OD value(X+S)RCPR (%) Score 100% T1 0.298±0.006, 98.3 1 50% T1 0.298±0.006, 98.8 1 25% T1 0.2995±0.007 99 1 100% T2 0.276±0.007 91.4 1 50% T2 0.286±0.003 94.7 1 25% T2 0.294±0.009 97.4 1 Control group 0.302±0.009 100 0 Table 2. The OD values, Relative cell proliferation Rate (RCPR) and toxicity Score of CEF cell after 48 hours. Groups 48hours groups OD value(X+S)RCPR (%) Score 100% T1 0.309±0.01 90.6 1 50% T1 0.320±0.003 93.8 1 25% T1 0.327±0.008 95.9 1 100% T2 0.307±0.007 90.0 1 50% T2 0.319±0.003 93.5 1 25% T2 0.325±0.008 995.3 1 Control gronp 0.341±0.009 100 0 These materials used are prepared by chemical deposi- tion and anode oxidation methods, respectively. The siz- es of NanoTiO2 are checked using scanning electron spectrometer and 80nm and 1000 nm, respectively, di- ameters of the NanoTiO2 tubes are between 50 - 100 nm. The infrared properties of absorption for the NanoTiO2 and micrometerTiO2 are different, the characteristic peaks of the former are 1271 cm–1, 1615 cm–1, 2957 cm–1 and 3422 cm–1, the latter are 1645 cm–1 and 2356 cm–1. Meanwhile, we can obtain different components of oxy- gen and titanium in the NanoTiO2 tubes in different con- ditions by the anode oxidation method. In MTT experi- ment we discover the changes of properties of prolifera- tion of the liver and chick embryo fibroblast cells under influences of NanoTiO2 relative to those of the controlled groups, when small NanoTiO2 suspension is added in these cultivated liquids of cell, but the influence of Na- noTiO2 on the proliferation of the person’s liver cell is still very small, therefore, the toxicities of NanoTiO2 containing 80 nm and 1000 nm to these cells are still first score. 5. Acknowledgements The authors would like to acknowledge the National “973” project of China for financial support (grate No: 2007CB936103) REFERENCES [1] R. F. Service, “Nanomaterials Show Signs of Toxicity,” Science, Vol. 300, No. 11, November, 2003, pp. 243-247. doi:10.1126/science.300.5617.243a [2] D. C. Wu and C. L. Du, “Noano Fibers,” Chemical In- dustry Press, Beijing, 2003. [3] K. Sunada, Y. Kikuchi, K. Hashimolo and A. Fujishima, “Bactericidal and Detoxification Effects of TiO2 Thin Film Photocatalysts,” Environmental Science and Tech- nology, Vol. 32, No. 5, May, 1998, pp. 726-730. doi:10.1021/es970860o [4] X. F. Pang, “Biopysics,” Press of University of Electronic Science Technology of China, Chengdu, 2007. [5] S. Daye and Y. L. Guo, “Cell Singal Transmition,” Sci- ence Press, Bejing, 2001. [6] R. N. Jorissen, F. Walker and N. Pouliot, et al., “Epider- mal Growth Factor Receptor Mechanisms of Activation and Signaling,” Experimental Cell Research, Vol. 284, No. 1, January, 2003, pp. 31-53. doi:10.1016/S0014-4827(02)00098-8 [7] W. Han, Y. D. Wang and Y. F. Zheng, “In Vitro Bio- compatibility Study of NanoTiO2 Materials,” Advanced Materials Research, Vol. 47-50, October, 2008, pp. 1438- 1441. doi:10.4028/www.scientific.net/AMR.47-50.1438 [8] Z. Q. Situ and J. Z. Wu, “Cell Culture,” World Press, Xi’an, 1996. [9] M. H. Zhang, S. W. Ding, Z. X. Wang and Y. Z. Zhang, “Synthesis of Mesoporous NanoTiO2 Doped with sn by Auto-Assembly Method and Photo-Catalytic Property,” Sciences in China B, Vol. 48, No. 5, May, 2005, pp. 655-659. doi:10.1360/04yb0009 [10] C. Hyeok, S. Elias and D. D. Dionysios, “Photocatalytic TiO2 Films and Membranes for the Development of Effi- cient Wastewater Treatment and Reuse Systems,” esali- nation, Vol. 202, No. 1, Janaury, 2000, pp. 199-206. Copyright © 2011 SciRes. MSA |