

Paper Menu >>
Journal Menu >>
 Journal of Geographic Information System, 2011, 3, 173-194 doi:10.4236/jgis.2011.33015 Published Online July 2011 (http://www.SciRP.org/journal/jgis) Copyright © 2011 SciRes. JGIS Land Use and Land Cover Changes in Arid Region: The Case New Urbanized Zone, Northeast Cairo, Egypt Rafat Zaki1, Abotalib Z aki 2, Saad Ahmed3 1Department of Ge o logy, Faculty of Scie nce, Minia University, Minia, Egypt 2Geological A ppl i c at ion s an d Mi neral Reso u rces Divisi o n , National Authority for Remote Sensing and Space Scienc e , Cairo, Egypt 3Department of Ge o logy, Faculty of Scie nce, Al-Azhar University, Cairo, Egypt E-mail: [email protected] Received January 21, 2011; revised March 15, 2011; accepted April 10, 2011 Abstract The spatial characteristics of land cover are useful for understanding the various impacts of human activity on the overall ecological conditions of the urban environment. The multi-temporal Landsat images (TM) between the years of 1990 and 2003 were used together with the Geographic Information System (GIS) techniques to evaluate the environmental changes in the area around Gabal El Hamza and the surrounding urban expansion in the new urban cities at the northeast side of the Greater Cairo by using the post classifi- cation change detection technique and field investigation. Five major units were determined including: urban, cultivated land, Holocene sand dunes, Oligocene basalt and Miocene–Pleistocene sediments. The cultivated cover changed from 89.6 to 150.4 km2 for the years of 1990 and 2003 respectively. The urban area increased from 49.5 to 120.9 km2 with a great value of change reached 71.3 km2. The basaltic exposures changed from 3 to 3.75 km2. The sandy cover decreased from 68.9 to 60.1 km2 and the exposures of the rock units changed from 904.8 to 780.8 km2 with removing 124 km2 in 13 years. The total accuracy of the Landsat-derived land cover data was 95 and 92% for the years 1990 and 2003 respectively. Landsat TM thermal infrared data in- dicated that the surface temperature was strongly affected by the land cover changes. Keywords: Land Cover Changes, Accuracy Assessment, TM Images, Land Surface Temperature, Egypt 1. Introduction In 1984, the first spark of the urban invasion to the desert in Egypt was flared-up with the establishment of the Tenth of Ramadan as a new urban center. Since this time, new settlements were erected in different parts of the country from the extreme north (as New Borg El-Arab near Alexandria) to the south (as El-Minia El-Gedida). The zone surrounding the Greater Cairo area had the highest share in urban encroachment in the Egyptian deserts. This is due to the high population density in Cairo and is particularly relevant as a result of the ex- pectation of an increase of population to almost the dou- ble of its present status by 2050 [1]. Cairo also provides the highest chances of increase of job opportu- nities in Egypt as a result of the installation of new factories and farms around the city, but away from its center. This necessitates the establishment of dwelling places for the qualified workin g forces which are generally to be found near and within the city. The above mentioned reasons, together with the suitable topographic and geologic set- ting of the area, make the surroundings of Cairo suitable for urban e xp ansion. The northeastern part of Cairo, in which several new urban settlements were erected, such as the Tenth of Ramadan, Badr, El-Obour, El-Shorouq and other cities has suffered from noticeable changes, especially in the last few decades. These changes were essentially caused by man-made interference. Therefore, the present study is particularly important as it will throw light on the im- pact of human activities on the overall ecological condi- tions of the urban environment [2]. Land cover change due to human activities is currently pro- ceeding more quickly in developing countries than in the developed world, and this situation will be projected into the year 2020, most of the world’s mega cities will appear in de- veloping countries [3]. Increasing population in devel- oping cities has caused rapid changes in land cover and 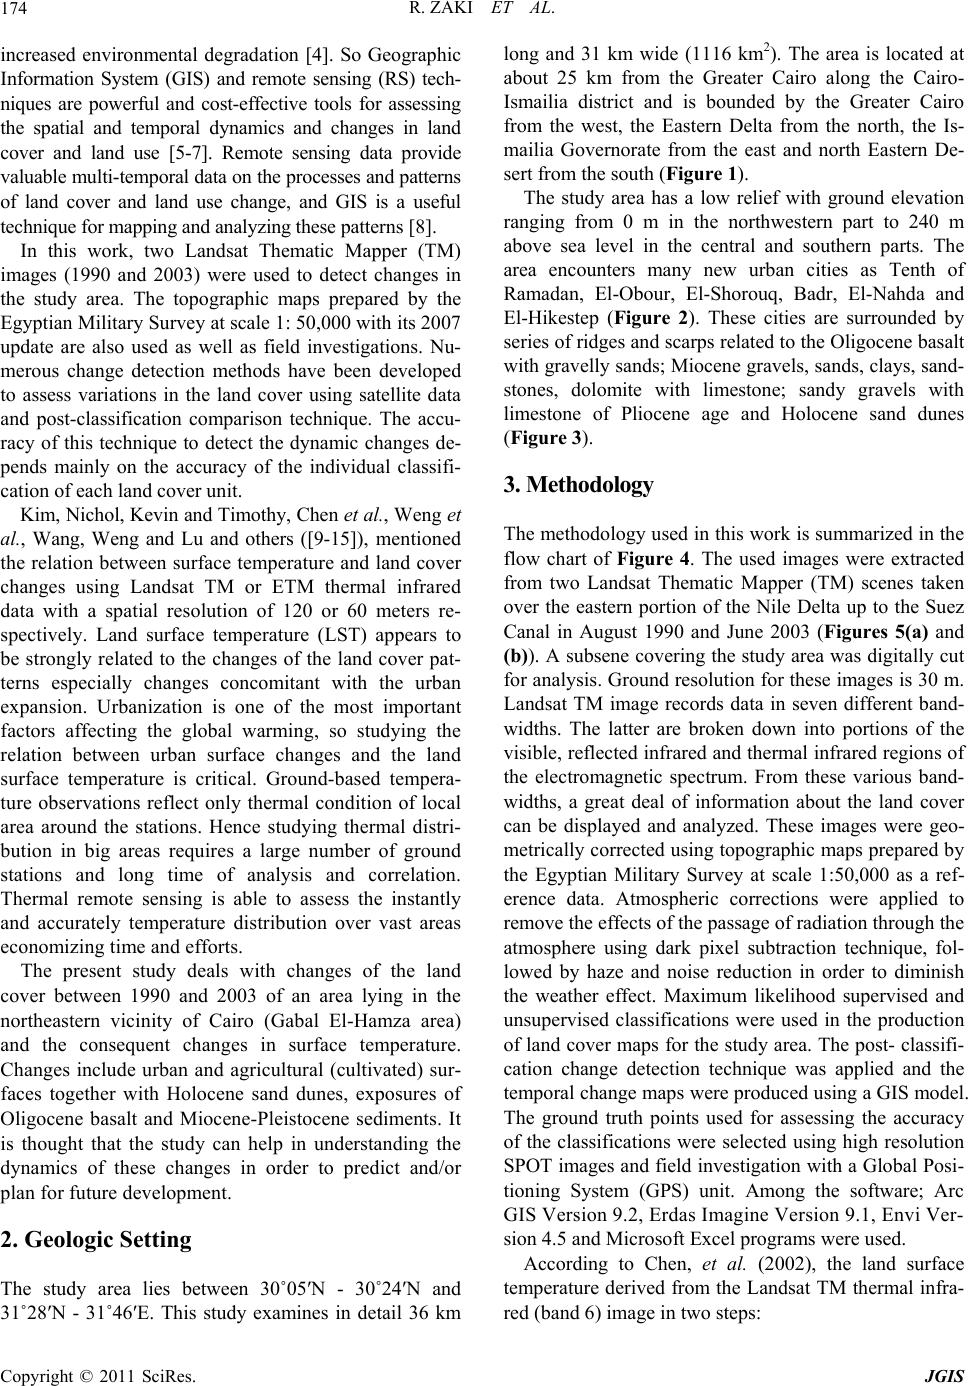 R. ZAKI ET AL. 174 increased environmental degradation [4]. So Geographic Information System (GIS) and remote sensing (RS) tech- niques are powerful and cost-effective tools for assessing the spatial and temporal dynamics and changes in land cover and land use [5-7]. Remote sensing data provide valuable multi- te mpor al data o n the p rocesses and patterns of land cover and land use change, and GIS is a useful technique for mapping and anal yzing these patterns [8]. In this work, two Landsat Thematic Mapper (TM) images (1990 and 2003) were used to detect changes in the study area. The topographic maps prepared by the Egyptian Military Surv ey at scale 1: 50,000 with its 2007 update are also used as well as field investigations. Nu- merous change detection methods have been developed to assess variations in the land cover using satellite data and post-classification comparison technique. The accu- racy of this technique to detect the dynamic changes de- pends mainly on the accuracy of the individual classifi- cation of each land cover unit. Kim, Nichol, Kevin and Timothy, Chen et al., Weng et al., Wang, Weng and Lu and others ([9-15]), mentioned the relation between surface temperature and land cover changes using Landsat TM or ETM thermal infrared data with a spatial resolution of 120 or 60 meters re- spectively. Land surface temperature (LST) appears to be strongly related to the changes of the land cover pat- terns especially changes concomitant with the urban expansion. Urbanization is one of the most important factors affecting the global warming, so studying the relation between urban surface changes and the land surface temperature is critical. Ground-based tempera- ture observations reflect only thermal condition of local area around the stations. Hence studying thermal distri- bution in big areas requires a large number of ground stations and long time of analysis and correlation. Thermal remote sensing is able to assess the instantly and accurately temperature distribution over vast areas economizing time and efforts. The present study deals with changes of the land cover between 1990 and 2003 of an area lying in the northeastern vicinity of Cairo (Gabal El-Hamza area) and the consequent changes in surface temperature. Changes include urban and agricultural (cultivated) sur- faces together with Holocene sand dunes, exposures of Oligocene basalt and Miocene-Pleistocene sediments. It is thought that the study can help in understanding the dynamics of these changes in order to predict and/or plan for future development. 2. Geologic Setting The study area lies between 30˚05′N - 30˚24′N and 31˚28′N - 31˚46′E. This study examines in detail 36 km long and 31 km wide (1116 km2). The area is located at about 25 km from the Greater Cairo along the Cairo- Ismailia district and is bounded by the Greater Cairo from the west, the Eastern Delta from the north, the Is- mailia Governorate from the east and north Eastern De- sert from the south (Figure 1). The study area has a low relief with ground elevation ranging from 0 m in the northwestern part to 240 m above sea level in the central and southern parts. The area encounters many new urban cities as Tenth of Ramadan, El-Obour, El-Shorouq, Badr, El-Nahda and El-Hikestep (Figure 2). These cities are surrounded by series of ridges and scarps related to the Oligocene basalt with gravelly sands; Miocene gravels, sands, clays, sand- stones, dolomite with limestone; sandy gravels with limestone of Pliocene age and Holocene sand dunes (Figure 3). 3. Methodology The methodology used in this work is summarized in the flow chart of Figure 4. The used images were extracted from two Landsat Thematic Mapper (TM) scenes taken over the eastern portion of the Nile Delta up to the Suez Canal in August 1990 and June 2003 (Figures 5(a) and (b)). A subsene covering the study area was digitally cut for analysis. Ground resolution for these images is 30 m. Landsat TM image records data in seven different band- widths. The latter are broken down into portions of the visible, reflected infrared and thermal infrared regions of the electromagnetic spectrum. From these various band- widths, a great deal of information about the land cover can be displayed and analyzed. These images were geo- metrically corrected using topographic maps prepared by the Egyptian Military Survey at scale 1:50,000 as a ref- erence data. Atmospheric corrections were applied to remove the effects of the passage of radiation through the atmosphere using dark pixel subtraction technique, fol- lowed by haze and noise reduction in order to diminish the weather effect. Maximum likelihood supervised and unsupervised classifications were used in the production of land cover maps for the study area. The post- classifi- cation change detection technique was applied and the temporal change maps were produced using a GIS model. The ground truth points used for assessing the accuracy of the classifications were selected using high resolution SPOT images and field investigation with a Global Posi- tioning System (GPS) unit. Among the software; Arc GIS Version 9.2, Erdas Imagine Version 9.1, Envi Ver- sion 4.5 and Microsoft Excel programs were used. According to Chen, et al. (2002), the land surface temperature derived from the Landsat TM thermal infra- red (band 6) image in two steps: Copyright © 2011 SciRes. JGIS 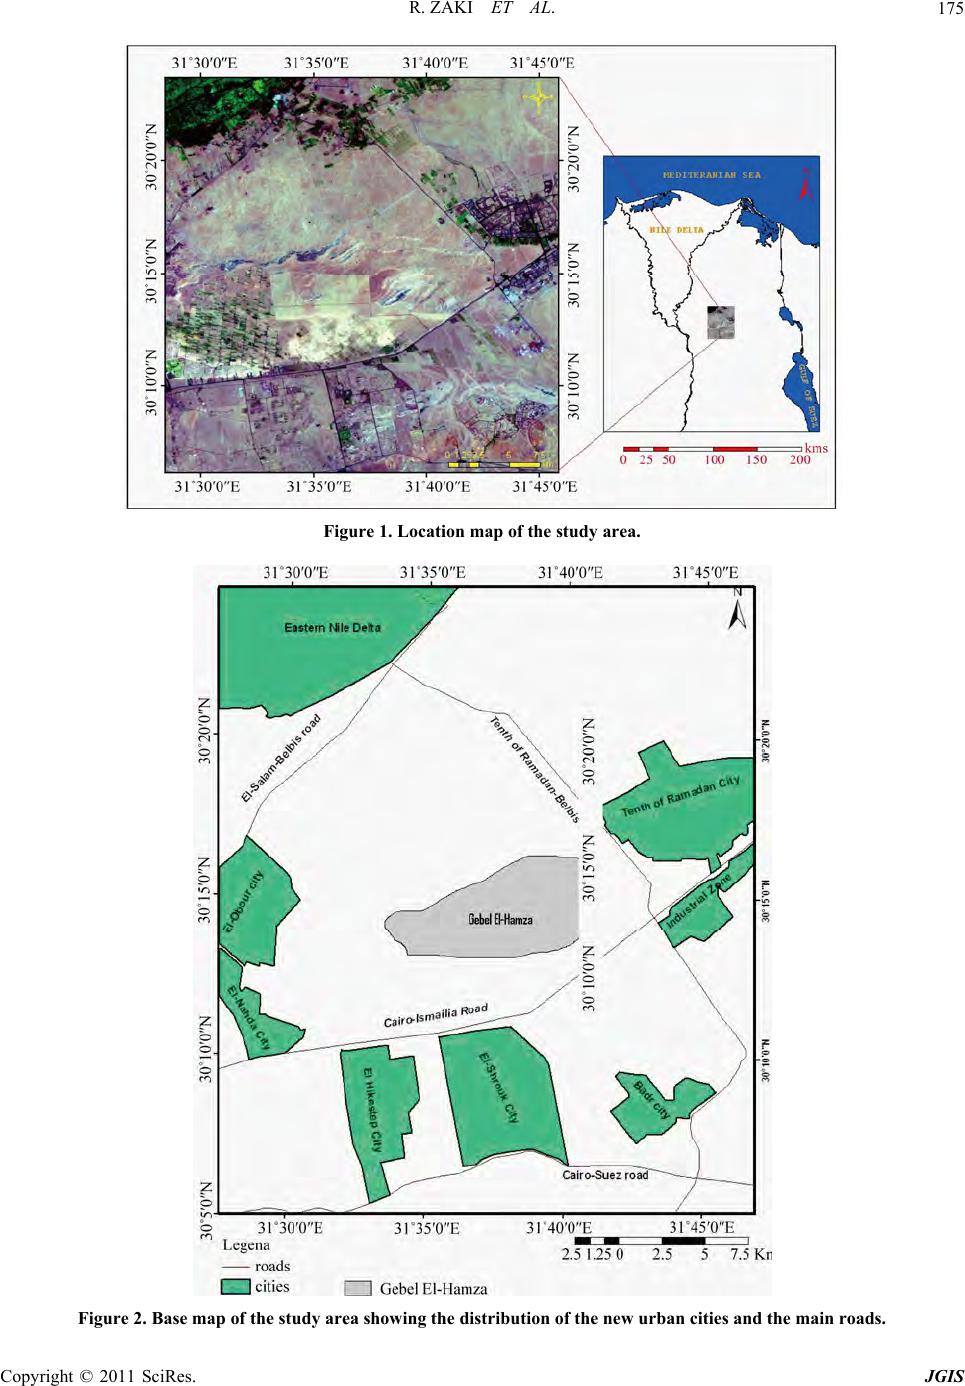 R. ZAKI ET AL. Copyright © 2011 SciRes. JGIS 175 Figure 1. Location map of the study area. Figure 2. Base map of the study area showing the distribution of the new urban cities and the main roads. 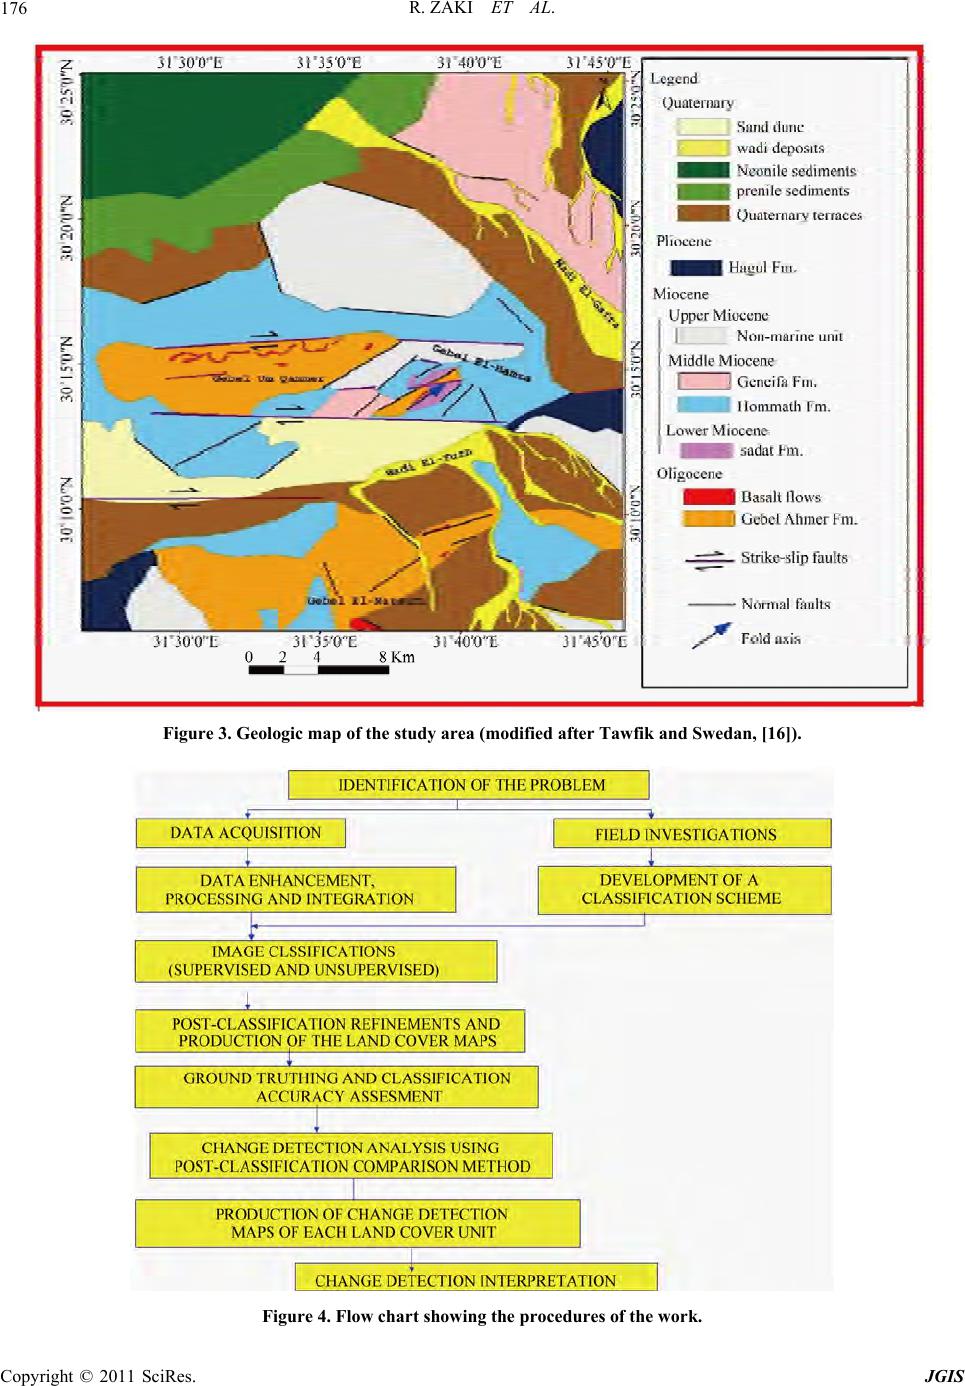 R. ZAKI ET AL. 176 Figure 3. Geologic map of the study area (modified after Tawfik and Swedan, [16]). Figure 4. Flow chart showing the procedures of the work. Copyright © 2011 SciRes. JGIS 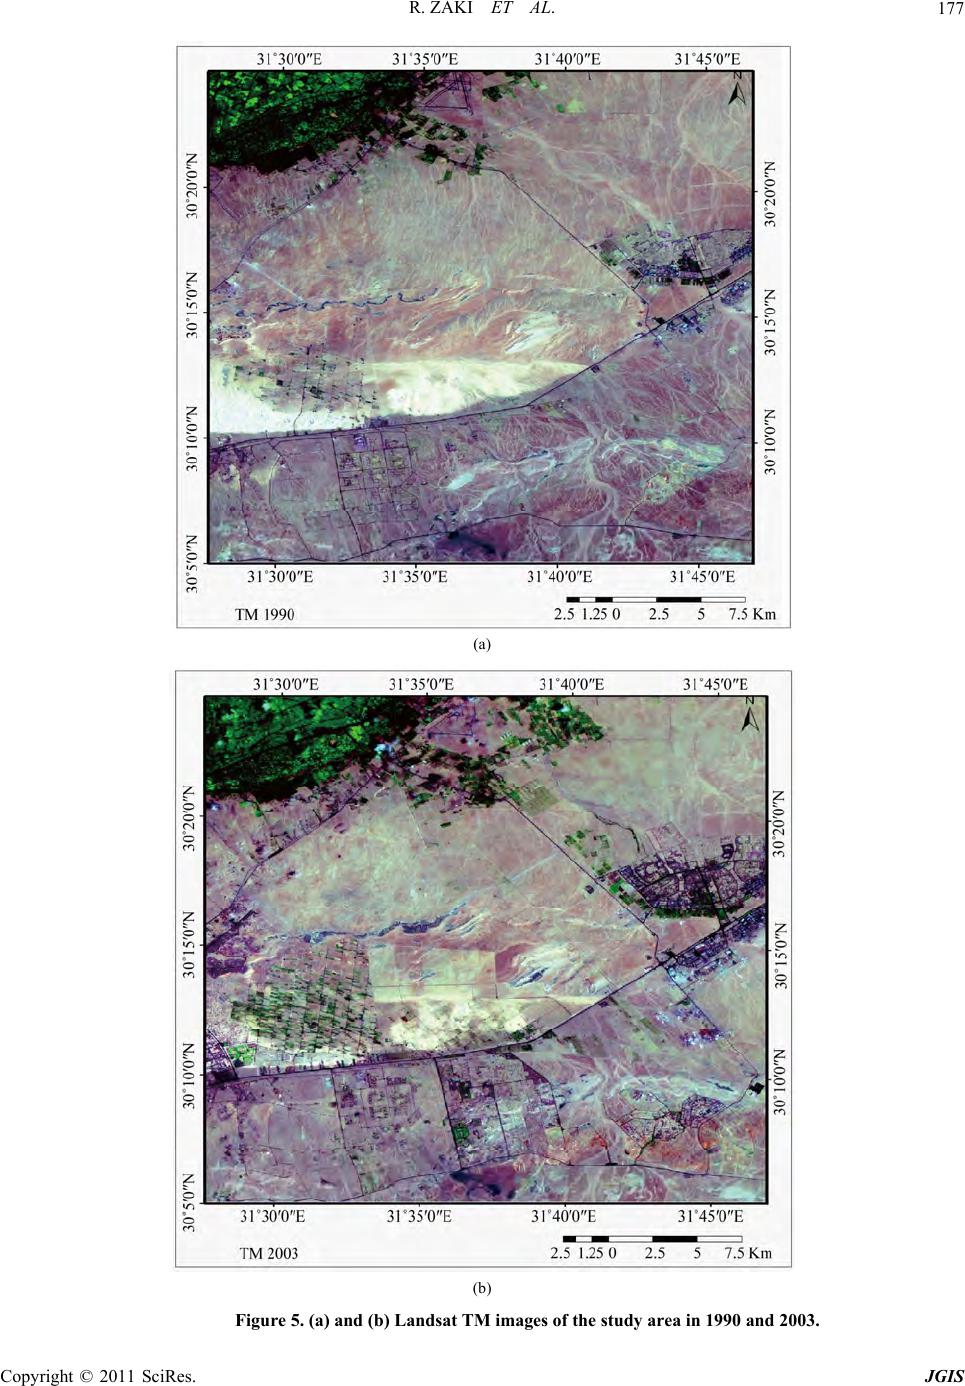 R. ZAKI ET AL.177 (a) (b) Figure 5. (a) and (b) Landsat TM images of the study area in 1990 and 2003. Copyright © 2011 SciRes. JGIS 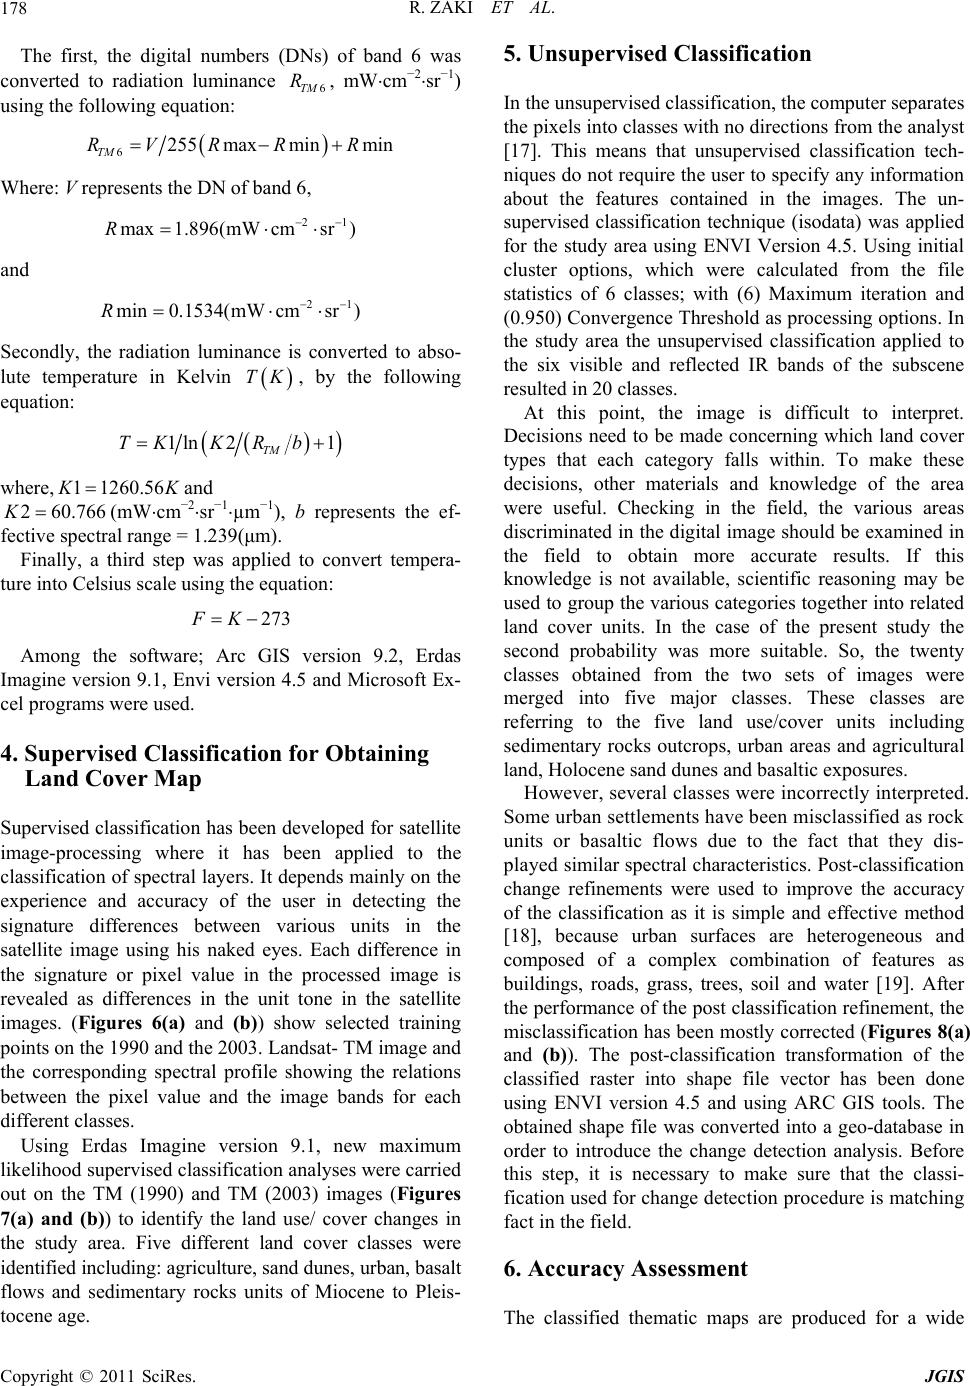 R. ZAKI ET AL. Copyright © 2011 SciRes. JGIS 178 5. Unsupervised Classification The first, the digital numbers (DNs) of band 6 was converted to radiation luminance , mWcm−2sr−1) using the following equation: 6TM R In the unsupervised classification, the computer separates the pixels into classes with no direction s from the analyst [17]. This means that unsupervised classification tech- niques do not require the user to specify any information about the features contained in the images. The un- supervised classification technique (isodata) was applied for the study area using ENVI Version 4.5. Using initial cluster options, which were calculated from the file statistics of 6 classes; with (6) Maximum iteration and (0.950) Converg ence Thresh old as processing option s. In the study area the unsupervised classification applied to the six visible and reflected IR bands of the subscene resulted in 20 classes. 6255 maxminmin TM RV RRR Where: V represents the DN of ban d 6, 21 max1.896(mW cmsr)R and 21 min0.1534(mW cmsr)R Secondly, the radiation luminance is converted to abso- lute temperature in Kelvin , by the following equation: TK At this point, the image is difficult to interpret. Decisions need to be made concerning which land cover types that each category falls within. To make these decisions, other materials and knowledge of the area were useful. Checking in the field, the various areas discriminated in the digital image should be examined in the field to obtain more accurate results. If this knowledge is not available, scientific reasoning may be used to group the various categories together in to related land cover units. In the case of the present study the second probability was more suitable. So, the twenty classes obtained from the two sets of images were merged into five major classes. These classes are referring to the five land use/cover units including sedimentary rocks outcrops, urban areas and agricultural land, Holocene sand dun e s and basaltic exposures. 1ln 21 TM TKK R b where, 1 1260.56 K K 60.766 and (mWcm−2sr−1µm−1), b represents the ef- fective spectral range = 1.239(μm). 2K Finally, a third step was applied to convert tempera- ture into Celsius scale using the equation: 273FK Among the software; Arc GIS version 9.2, Erdas Imagine version 9.1, Envi version 4.5 and Microsoft Ex- cel programs were used. 4. Supervised Classification for Obtaining Land Cover Map However, s everal class es were incorr ectly in terpreted . Some urban settlements have been misclassified as rock units or basaltic flows due to the fact that they dis- pl ayed similar spectral characteristics. Post-classification change refinements were used to improve the accuracy of the classification as it is simple and effective method [18], because urban surfaces are heterogeneous and composed of a complex combination of features as buildings, roads, grass, trees, soil and water [19]. After the performance of the po st classification refinement, the misclassification has been mostly corrected (Figures 8(a) and (b)). The post-classification transformation of the classified raster into shape file vector has been done using ENVI version 4.5 and using ARC GIS tools. The obtained shape file was converted into a geo-database in order to introduce the change detection analysis. Before this step, it is necessary to make sure that the classi- fication used for change detection procedu re is matching fact in the field. Supervised classification has been developed for satellite image-processing where it has been applied to the classification of spectral layers. It depends mainly on th e experience and accuracy of the user in detecting the signature differences between various units in the satellite image using his naked eyes. Each difference in the signature or pixel value in the processed image is revealed as differences in the unit tone in the satellite images. (Figures 6(a) and (b)) show selected training points on the 1990 and th e 2003. Landsat- TM i mage and the corresponding spectral profile showing the relations between the pixel value and the image bands for each different classes. Using Erdas Imagine version 9.1, new maximum likelihood supervised classification analyses were carried out on the TM (1990) and TM (2003) images (Figures 7(a) and (b)) to identify the land use/ cover changes in the study area. Five different land cover classes were identified including: agriculture, sand dunes, urban, basalt flows and sedimentary rocks units of Miocene to Pleis- tocene age. 6. Accuracy Assessment The classified thematic maps are produced for a wide 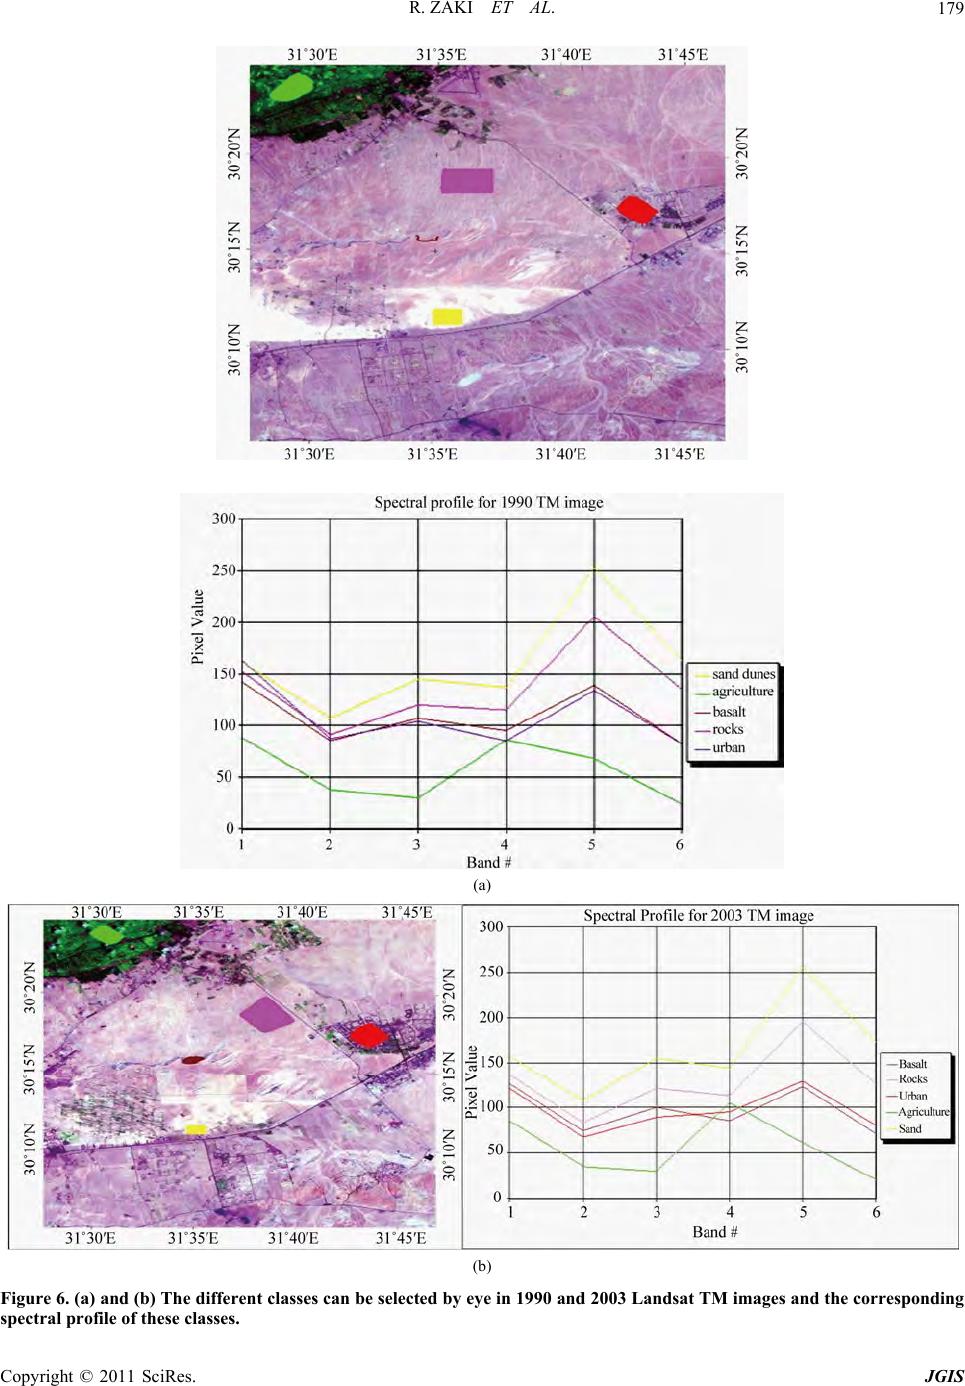 R. ZAKI ET AL.179 (a) (b) Figure 6. (a) and (b) The different classes can be selected by eye in 1990 and 2003 Landsat TM images and the corresponding spectral profile of these classes. Copyright © 2011 SciRes. JGIS 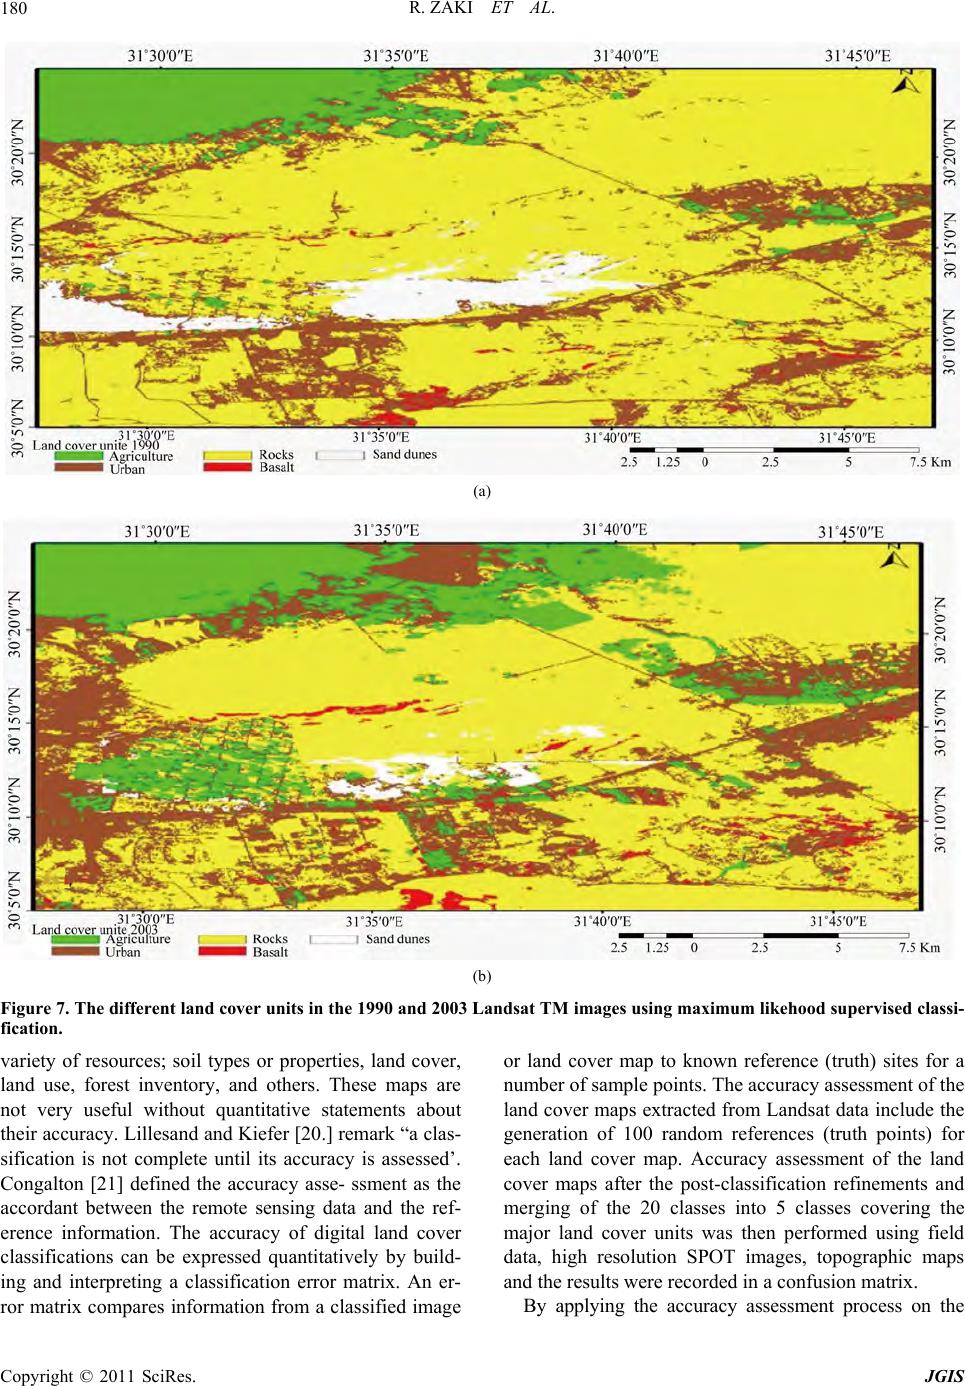 R. ZAKI ET AL. Copyright © 2011 SciRes. JGIS 180 (a) (b) Figure 7. The different land cover units in the 1990 and 2003 Landsat TM images using maximum likehood supervised classi- fication. variety of resources; soil types or properties, land cover, land use, forest inventory, and others. These maps are not very useful without quantitative statements about their accuracy. Lillesand and Kiefer [20.] remark “a clas- sification is not complete until its accuracy is assessed’. Congalton [21] defined the accuracy asse- ssment as the accordant between the remote sensing data and the ref- erence information. The accuracy of digital land cover classifications can be expressed quantitatively by build- ing and interpreting a classification error matrix. An er- ror matrix compares information from a classified image or land cover map to known reference (truth) sites for a number of sample points. The accuracy assessment of the land cover maps extracted from Landsat data include the generation of 100 random references (truth points) for each land cover map. Accuracy assessment of the land cover maps after the post-classification refinements and merging of the 20 classes into 5 classes covering the major land cover units was then performed using field data, high resolution SPOT images, topographic maps and the results were recorded in a confusion matrix. By applying the accuracy assessment process on the  R. ZAKI ET AL.181 (a) (b) Figure 8. (a) and (b) The unsupervised classifications of the years 1990 and 2003 Landsat TM images after the enhancements and post-classification refinements. Copyright © 2011 SciRes. JGIS  R. ZAKI ET AL. Copyright © 2011 SciRes. JGIS 182 land cover maps before and after the refinement processes. It is found to be that the rule-based post-classification refinements were effective and improved accuracy by 8% - 13%. The total accuracy of the Landsat-derived land cover data was 95 and 92% for the years 1990 and 2003 respectively. According to Anderson et al. [22], the standard ac- curacy for (land use/land cover) mapping studies ranging from 85% - 90%. From the accuracy reports, it is easily noticeable that the accuracy of the land cover map de- rived from the 1990 Landsat TM image is higher than the accuracy of the land cover map derived from the 2003 Landsat -TM image due to the vast urban expansion at the 2003 image which result in the increasing of the spectral confusion between pixels contain the urban signature and pixels contain the argillaceous or basaltic signature. 7. Change Detection Techniques Many remote sensing change detection techniques have been developed, and the advantages and disadvantages of each have been reviewed by a number of authors ([23]). However, the new digital change detection tech- niques are continuing to be developed primarily in-response to the range of social and environmental chal- lenges posed by human transformation of the Earth’s surface ([24,25]) and the potential of remote sensing in monitoring related processes ([26-28]). All change detection techniques rely on the basic idea that changes in the spectral and/or textural characteristics of geometrically, atmospherically and topographically cor- rected remote ly sensed imagery r epresen t change s of the Earth’s surface. In this study, the post-classifi cation comparison change detection technique is the most preferable. The mag- nitude and location of change (from to change detection matrix, [29]) were determined for the entire studied years (1990-2003). The major land cover changes were colour coded. These changes were from rocky land to urban, from rocky land to agricultural areas, from sand to agri- cultural areas and from sand to urban areas. Also the exposed basaltic extrusions have been found to cover different spaces in the two dates. Table 1 shows the ob- served major land cover changes and the area of each land cover class has been given in m2 with the yearly average change in each type (each class). Using Arc Toolbox in ARC GIS Version 9.2 a new model has been developed to map the change through the thirteen years between the 1990 and 2003 images. The data obtained are also shown in a chart form to be easier to understand for the normal observer and the de- cision maker, so a diagrammatic view displaying a com- parison between the same land cover classes in both dates (Figure 9), and the average ratio of each class that was occupying the surface area between 1990 and 2003 (Figure 10) were d es igned. 8. Interpretation of the Detection of Change Analysis The detection of change analysis is concerned with the environmental changes and the human impact. These changes have been detected and identified as the fol- lowing: a) Changes concerning agricultural (cultivated) lands The surface of cultivated lands shows big changes through the urban development of the new cities (as Tenth of Ramadan, El-Shorouq, Badr and El-Obour cit- ies), or through new cultivation around El-Obour and El-Nahda cities and on the edges of the Eastern Delta at Belbis city. Figures 11(a)-(c) show the steps of changes of the green cover at various dates. The agricultural cover increased from 89.6 to150.4 km² between the years 1990 and 2003. This means that the agricultural cover increased during th e last 13 years by 60.7 km² (Table 1). b) The urban development Urban development in the study area plays a very im- portant role through the environmental changes either through the en largement of the Tenth of Ramadan city or through construction of the new urban cities such as El-Shorouq, El-Obour and Badr between the years of 1990 and 2003 (Figures 12(a)-(c)). The large deve- lopment of the new urban cities, where the urban area in 1990 was 49.5 km2 to reach 120.9 km2 in 2003 with a large value of chan g e reached 71.3 km2 (Table 1). c) The bed rock exposures Bedrock exposures in the year of 1990 were covering the bulk of the area of study, amounting to about 904.8 km². But this area was largely covered by new elements related to the urban development and cultivation of new surfaces. It reached 780.8 km2 in 2003 (Table 1). This amounts to a decrease in the exposed bed rock surface of 124 km² in 13 years. The remarkable dynamic change is shown in Figures 13(a)-(c). Table 1. The land cover changes in m2 in 1990 and 2003 and the average of change der year. Classes 1990 Area (m2) 2003 Area (m2) Total change (m2) Difference per year Agriculture89696700 150453900 60757200 4673630.769 Urban 49591800 120913200 71321400 5486261.538 Rock 904880700780877800 –124002900 –9538684.615 Sand 68918400 60105600 –8812800 –677907.6923 Basalt 3020400 3757500 737100 56700 Sum. 11161080001116108000  R. ZAKI ET AL.183 Figure 9. Each class area in m² at the time of analysis. Figsure 10. The proportions of each class to the whole studied area at 1990 and 2003. Copyright © 2011 SciRes. JGIS  R. ZAKI ET AL. 184 (a) (b) Copyright © 2011 SciRes. JGIS 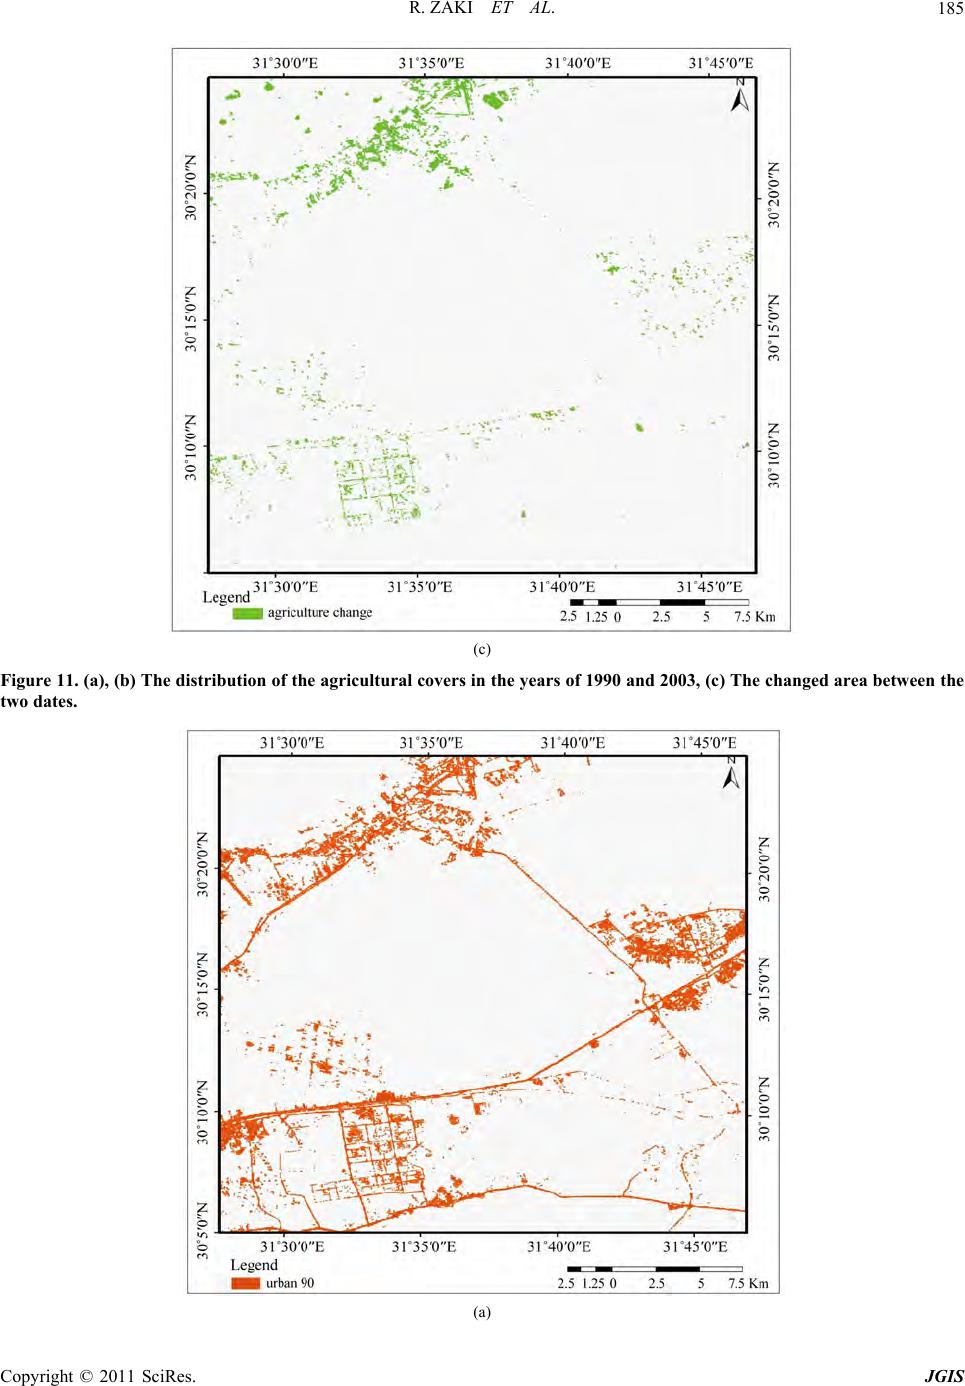 R. ZAKI ET AL.185 (c) Figure 11. (a), (b) The distribution of the agricultural covers in the years of 1990 and 2003, (c) The changed area between the two dates. (a) Copyright © 2011 SciRes. JGIS 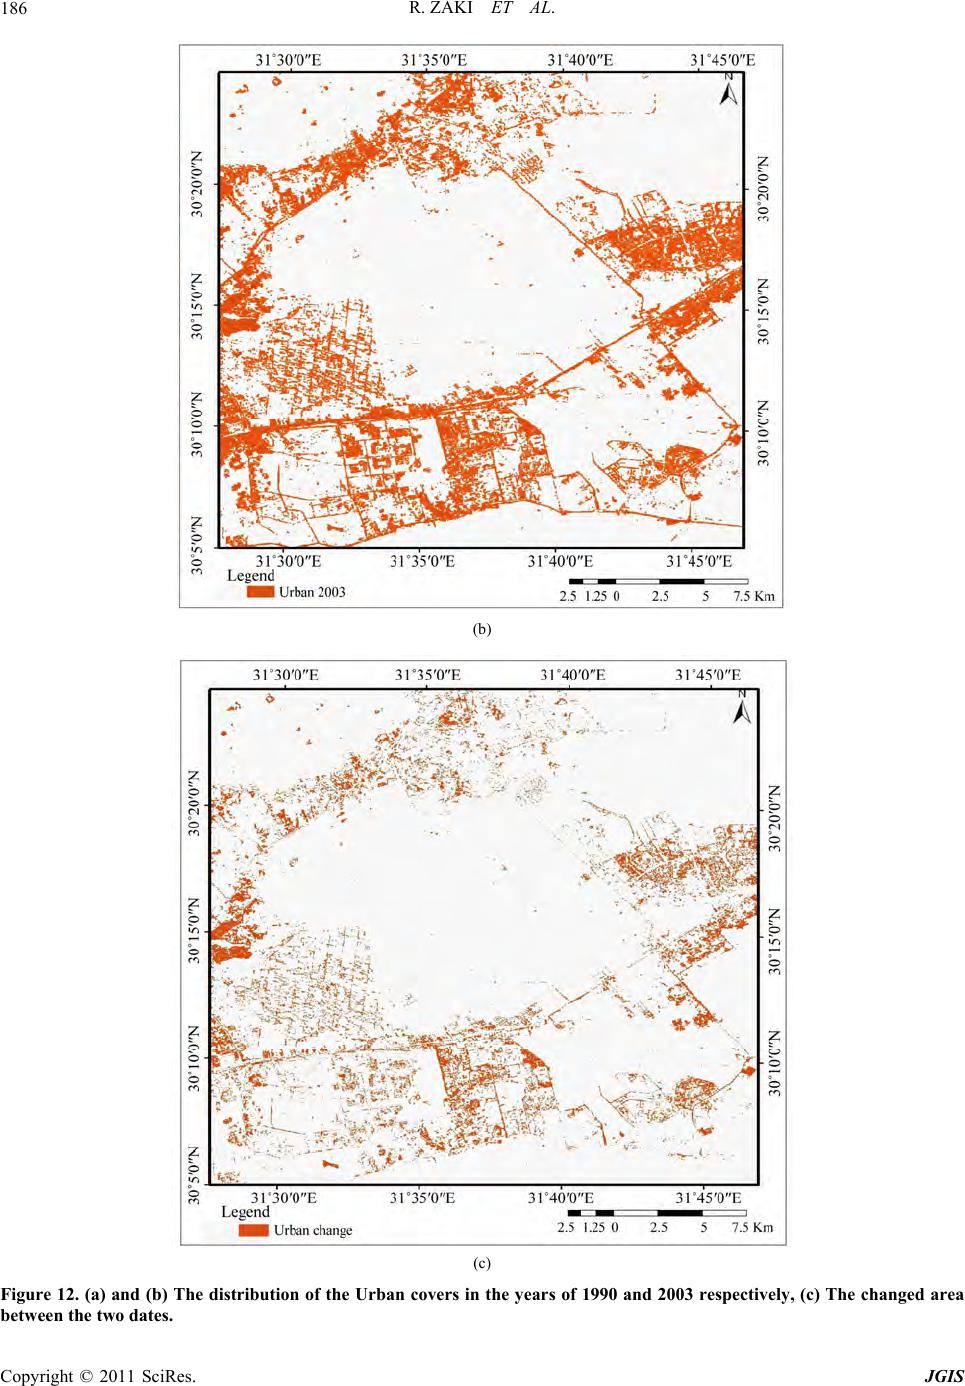 R. ZAKI ET AL. 186 (b) (c) Figure 12. (a) and (b) The distribution of the Urban covers in the years of 1990 and 2003 respectively, (c) The changed area between the two date s. Copyright © 2011 SciRes. JGIS 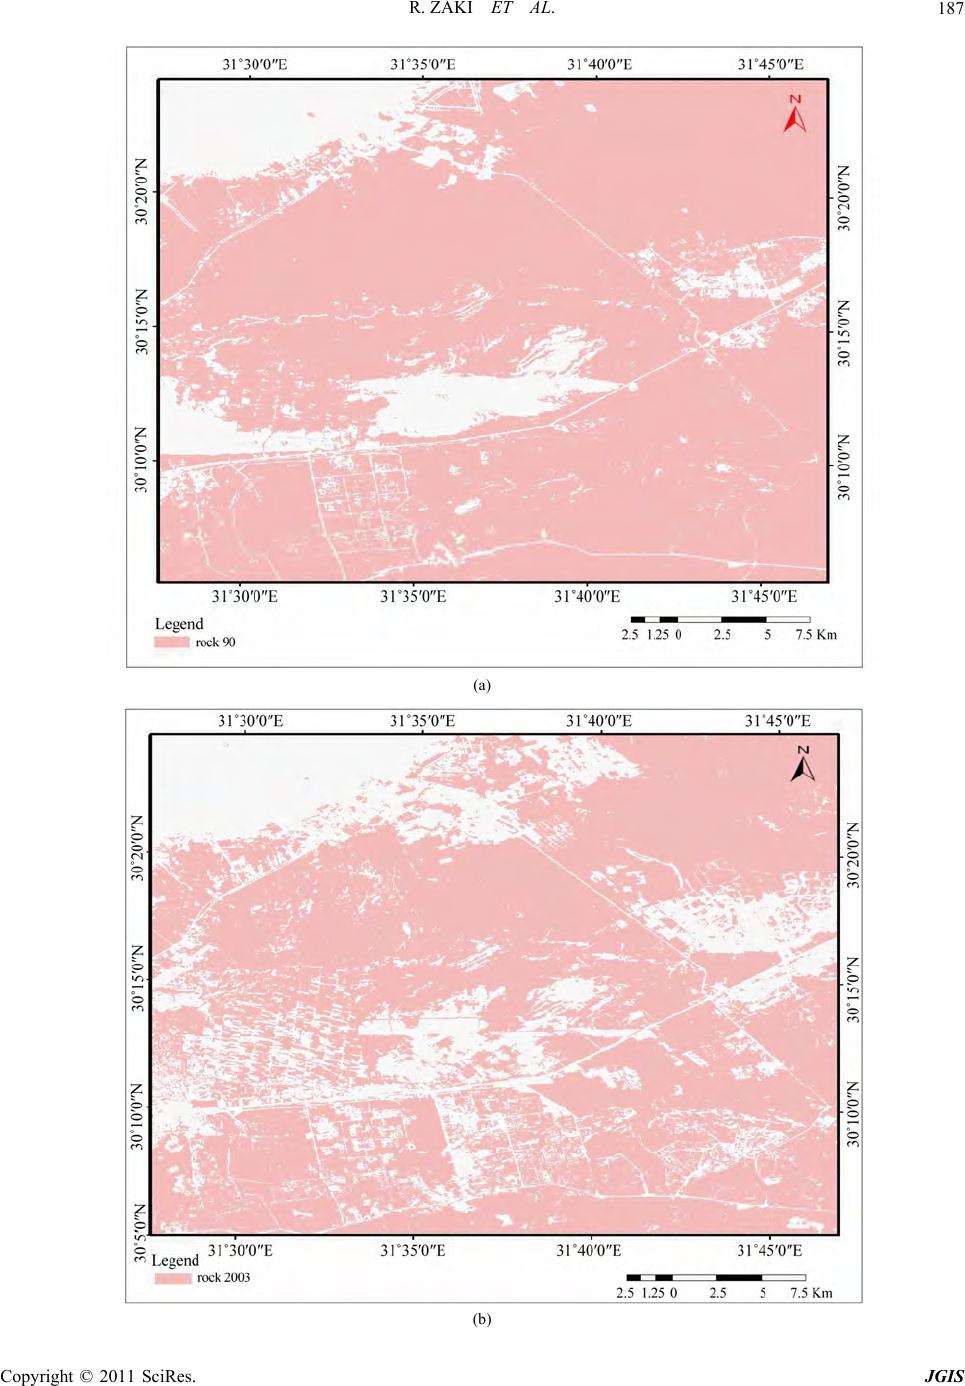 R. ZAKI ET AL.187 (a) (b) Copyright © 2011 SciRes. JGIS 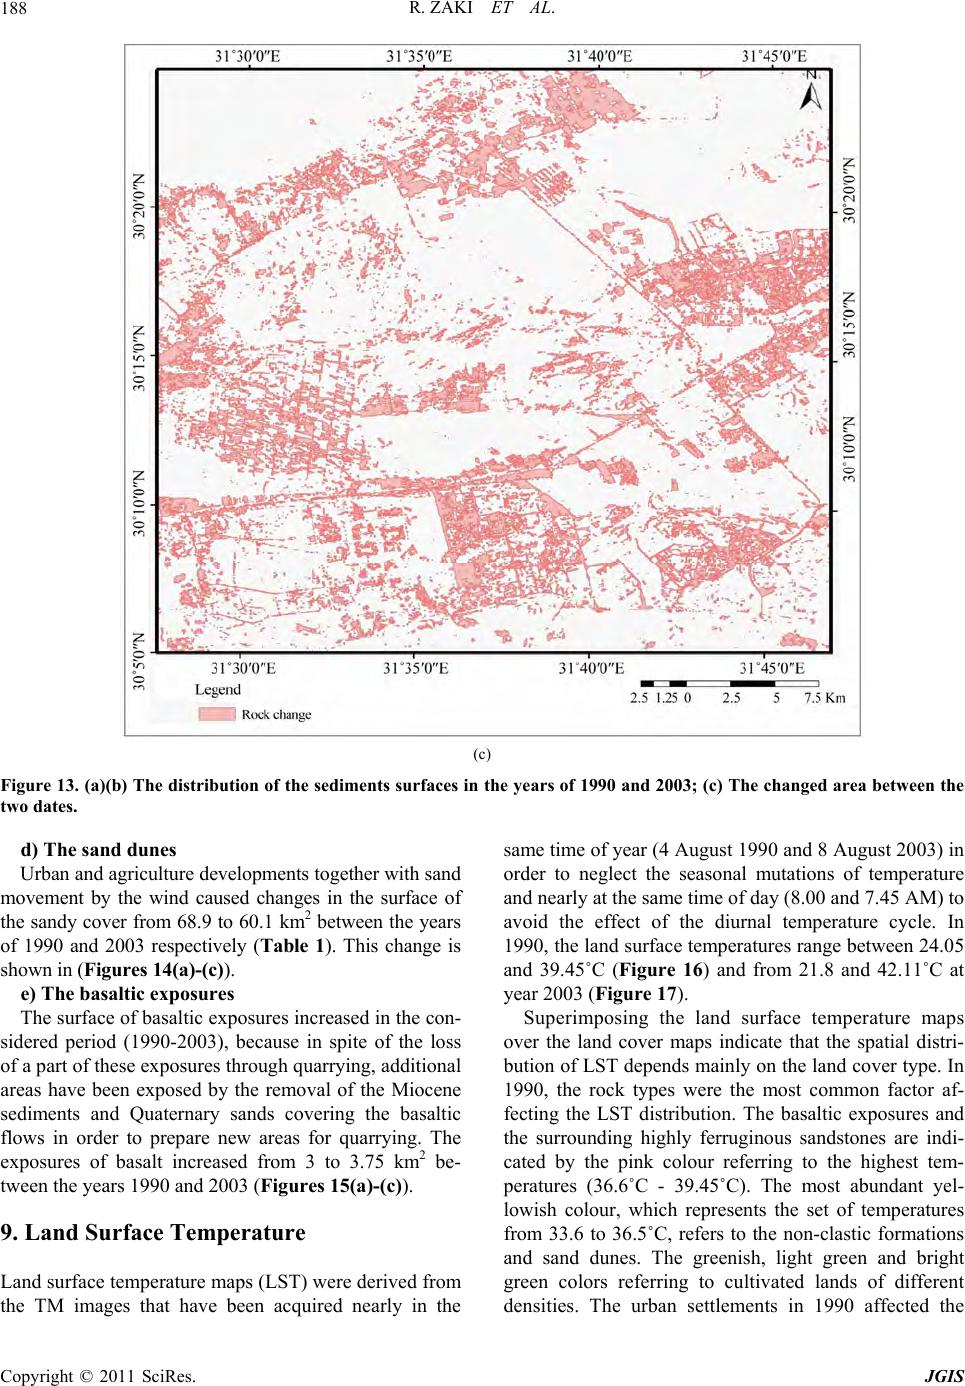 R. ZAKI ET AL. Copyright © 2011 SciRes. JGIS 188 (c) Figure 13. (a)(b) The distribution of the sediments surfaces in the years of 1990 and 2003; (c) The changed area between the two dates. d) The sand dunes Urban and agriculture developments to gether with san d movement by the wind caused changes in the surface of the sandy cover from 68.9 to 60.1 km2 between the years of 1990 and 2003 respectively (Table 1). This change is shown in (Figu res 14( a)- (c)). e) The basaltic exposures The surface of basaltic exposures increased in the con- sidered period (1990-2003), because in spite of the loss of a part of these exposu res throug h qu arrying, ad d itional areas have been exposed by the removal of the Miocene sediments and Quaternary sands covering the basaltic flows in order to prepare new areas for quarrying. The exposures of basalt increased from 3 to 3.75 km2 be- tween the years 1990 and 2003 (Figures 15( a) -(c)). 9. Land Surface Temperature Land surface temperature maps (LST) were derived from the TM images that have been acquired nearly in the same time of year (4 August 1990 and 8 August 2003) in order to neglect the seasonal mutations of temperature and nearly at the same time of day (8.00 and 7.45 AM) to avoid the effect of the diurnal temperature cycle. In 1990, the land surface temperatures range between 24.05 and 39.45˚C (Figure 16) and from 21.8 and 42.11˚C at year 2003 (Figure 17). Superimposing the land surface temperature maps over the land cover maps indicate that the spatial distri- bution of LST depends mainly on the land co ver type. In 1990, the rock types were the most common factor af- fecting the LST distribution. The basaltic exposures and the surrounding highly ferruginous sandstones are indi- cated by the pink colour referring to the highest tem- peratures (36.6˚C - 39.45˚C). The most abundant yel- lowish colour, which represents the set of temperatures from 33.6 to 36.5˚C, refers to the non-clastic formations and sand dunes. The greenish, light green and bright green colors referring to cultivated lands of different densities. The urban settlements in 1990 affected the  R. ZAKI ET AL.189 (a) (b) Copyright © 2011 SciRes. JGIS  R. ZAKI ET AL. 190 (c) Figure 14. (a)(b) The distribution of the sand cover in the years of 1990 and 2003; (c) The changed area between the two dates. (a) Copyright © 2011 SciRes. JGIS  R. ZAKI ET AL.191 (b) (c) Figure 15. (a)(b) The distribution of the basaltic flow in the years of 1990 and 2003; (c) The changed area between the two dates. Copyright © 2011 SciRes. JGIS  R. ZAKI ET AL. 192 Figure 16. The distribution of the land surfaces temperature of the year 1990. Figure 17. The distribution of the land surfaces temperature of the year 2003. Copyright © 2011 SciRes. JGIS  R. ZAKI ET AL. Copyright © 2011 SciRes. JGIS 193 LST to some extent; along the Cairo-Ismailia, Cairo- Suez high roads and through the urban built up spaces of the Tenth of Ramadan city. These urban settlement were characterized by the highest temperature range (36.6˚C - 39.45˚C) as discordant with the surroundings. In 2003, the spatial distribution of the land cover units has suffered much change with the urban invasion. Con- sequently LST patterns were changed and their distribu- tions were mostly controlled by the urban distributions. There is no change in land cover area (the rural culti- vated lands) at the northwestern part of the study area corresponds to no change LST values with exiguous de- crease in temperatures in some parts (from 24.5˚C - 27.8˚C to 21.8˚C - 24.4˚C and from 27.9˚C - 30.7˚C to 24.5˚C - 27.8˚C) give indication that the colder weather conditions of this day corresponding to the day of 1990. On the other hand, the central and southern parts that involved the bulk urban expansion have been covered by the higher temperature set (36.5 - 39.4). The wind movement has the north- east direction, so the hot spots (with the red color) at the southern part may be carried out the wind from the industrial settlements at the desert back of Nasr city, which located at the south- west of the study area. 10. Conclusions Using remote sensing data in conjunction with Geogra- phic Information System analytical tools, the present study enables to monitor sp atial and temporal land cover changes in the region around Gabal El-Hamza and to evaluate the dynamics of urban expansion in the new urban cities at the northeastern side of the Greater Cairo area. This study was conducted using two Landsat The- matic Mapper (TM) images acquired in the years 1990 and 2003. The acquisition time of th e two images was in the same season to keep the weather factor as constant as possible. The images were taken in August 1990 and June 2003 respectively. Different procedures of image enhancement have been performed on the two images to obtain the land cover maps at the two dates using likely- hood supervised and unsupervised classifications. The maps obtained revealed that the unsupervised classi- fi- cation are more accurate in distinguishing the land cover units because of human error in digitizing, lack of knowledge of study area, and other factors generally contribute to give inaccurate results in the supervised classification method. These drawbacks are not affecting the unsupervised classification method. After refinement of the unsupervised classification, accuracy assessment analysis had been performed to determine the accuracy of the classification. The total accuracy of the Landsat- derived land cover data was 92 and 95% for the years 1990 and 2003 respectively. The obtained results indi- cate that the accuracy decreased with the increasing of the urban expansion because the expansion results in the increasing of spectral confusion between some pixels of the urban signature and pixels including of argillaceous, rocky or basaltic exposures. In order to determine the change in the land cover units through the thirteen years between the two acquisitio n dates, the post-classification comparison technique were used. The agricultural cover changed from 89.6 to 150.4 km2 for the years of 1990 and 2003 respectively. The urban areas show a large in- creased from 49.5 to 120.9 km2. The basaltic flows cover changed from 3 to 3.75 km2. The sandy cover decreased from 68.9 to 60.1 km2 and the exposures of the rocks decreased from 904.8 to 780.8 km² (i.e., a decrease of 124 km2 in 13 years). This study shows that an integrated use of GIS and Remote Sensing data can be effectively used to under- stand spatial and temporal dynamics of land cover changes. The interpretation and classification of remote sensing data could also be useful for estimating the rate and spatial pattern of the urban expansion around old cities that have a desert back-ground as Greater Cairo, Alexandria, El Minia and others. The land cover maps produced in this study could contribute to both the de- velopment of sustainable urban land use planning deci- sions and also for forecasting possible future changes in growth patterns by using the Polychotomous Regression modeling and predicting the land cover in the future. Landsat TM thermal infrared data indicated that the sur- face temperature is strongly affected by the land cover changes and needs further research to correlate with Me- teorology. 11. References [1] United Nation, “Report of the Meeting-Urbanization: A Global Perspective,” Proceedings of the Expert Group Meeting on Population Distribution, Urbanization, Inter- nal Migration and Development, New York, 21-23 Janu- ary, 2008. [2] A. Yeh and X. Li, “Economic Development and Agri- Cultural Land Loss in the Pearl River Delta, China,” Habitat International, Vol. 23, No. 3, 1999, pp. 373-390. doi:10.1016/S0197-3975(99)00013-2 [3] World Bank, “World Development Indicators,” Washing- ton, D.C., 2007. [4] M. W. Holdgate, “The Sustainable Use of Tourism: A Key Conservation Issue,” Ambio, Vol. 22, 1993, pp. 481-484. [5] S., Hathout, “The Use of GIS for Monitoring and Pre- dicting Urban Growth in East and West St. Paul, Winni- peg, Manitoba, Canada,” Journal of Environmental Management, Vol. 66, No. 3, 2002, pp. 229-238.  R. ZAKI ET AL. 194 [6] M. Herold, N. C. Goldstein and K. C. Clarke, “The Spa- tiotemporal form of Urban Growth: Measurement, Analysis and Modeling,” Remote Sensing of Environment, Vol. 86, No. 3, 2003, pp. 286-302. doi:10.1016/S0034-4257(03)00075-0 [7] P. Serra, X. Pons and D. Sauri, “Land-Cover and Land-Use Change in a Mediterranean Landscape: A Spa- tial Analysis of Driving Forces Integrating Biophysical And Human Factors,” Applied Geography, Vol. 28, No. 3, 2008, pp. 189-209. doi:10.1016/j.apgeog.2008.02.001 [8] B. P. Zhang, Y. H. Yao, W. M. Cheng, C. H. Zhou, Z. Lu, and X. D. Chen, “Human-induced changes to biodiversity and alpine pastureland in the Bayanbulak Region of the East Tianshan Mountains,” Mountain Research and Development, Vol. 22, No. 4, 2002, pp. 1-7. doi:10.1659/0276-4741(2002)022[0383:HICTBA]2.0.CO ;2 [9] H. H., Kim, “Urban Heat Island,” International Journal of Remote Sensing, Vol.13, No. 12, 1992, pp. 319-336. [10] J. E. Nichol, “Visualization of Urban Surface Tempera- tures Derived from Satellite Images,” International Journal of Remote Sensing, Vol. 19, No. 9, 1998, pp. 1639-1649. doi:10.1080/014311698215153 [11] P. Kevin and W. Timothy, “Satellite-Based Adjustments for the Urban Heat Island Temperature Bias,” Journal of Applied Meteorology, Vol. 38, No. 6, 1999, pp. 806-813. doi:10.1175/1520-0450(1999)038<0806:SBAFTU>2.0.C O;2 [12] Y. Chen, J. Wang and X. Li, “A Study on Urban Thermal Field in Summer Based on Satellite Remote Sensing,” Remote Sensing for Land and Resources, Vol. 4, 2002, pp. 55-59. [13] Q. Weng, D. Lu and J. Schubring, “Estimation of Land Surface Temperature-Vegetation Abundance Relationship for Urban Heat Island Studies,” Remote Sensing of Envi- ronment, Vol. 89, No. 4, 2004, pp. 467-483. doi:10.1016/j.rse.2003.11.005 [14] Y. Q. Wang, “Estimation of Land Surface Temperature using Landsat-7 ETM+ Thermal Infrared and Weather Data,” Department of Natural Resources Science, Uni- versity of Rhode Island Kingston, RI 02881, USA, 2005. [15] Q. Weng and D. Lu, “A Sub-Pixel Analysis of Urbaniza- tion Effect on Land Surface Temperature and Its Inter- play with Impervious Surface and Vegetation Coverage in Indianapolis, United States,” International Journal of Applied Earth Observation and Geoinformation, Vol. 10 No. 1, 2008, pp. 68-83. doi:10.1016/j.jag.2007.05.002 [16] E. Tawfik and A. Swedan, “Geology of Cairo-Suez dis- trict, Western Part of the N. Eastern Desert,” Geological Survey, Egypt, 1992, report No. 34/92. [17] F. F. Sabins, “Remote Sensing, Principles and In- ter-pretation,” Freeman, New York, 1997. [18] P. M. Harris and S. J. Ventura, “The Integration of Geogra- Phic Data with Remotely Sensed Imagery to Im- prove Classification in an Urban Area,” Photogrammetric Engineering and Remote Sensing, Vol. 61, No. 8, 1995, pp. 993-998. [19] R. J. Jensen, “Remote Sensing of the Environment: An earth Resource Perspective,” 2nd Edition, Prentice-Hall, Upper Saddle River, 2007. [20] T. M. Lillesand and R. W. Kiefer, “Remote Sensing and Image Interpretation,” John Wiley & Sons, Inc., NewYork, 1994. [21] R. G. Congalton, “A Review of Assessing the Accuracy of Classifications of Remotely Sensed Data,” Remote Sensing of Environment, Vol. 37, No. 1, 1991, pp. 35-46. [22] R. Anderson, E. Hardy, J. Roach and R. Witmer, “A Land Use and Land Cover Classification System for Use with Remote Sensor Data,” USGS Professional Paper, Wash- ington, D.C., 1976. [23] D. Lu, P. Mausel, E. Brondízio and E. Moran, “Change Detection Techniques,” International Journal of Remote Sensing, Vol. 25, No. 12, 2004, pp. 2365-2407. doi:10.1080/0143116031000139863 [24] A. S. Goudie, “Land Transformation. In The Challenge for Geography: A Changing World, A Changing Dis-cipline, In: R. J. Johnston Ed., Blackwell, Cambridge, 1993, pp. 117-137. [25] R. M. Turner, “Long-Term Vegetation Change at a Fully Protected Sonoran Desert Site,” Ecology, Vol. 71, No. 2, 1990, pp. 464-477. doi:10.2307/1940301 [26] G. Gutman, “Land Change Science. In: Monitoring and Understanding Trajectories of Change on the Earth’s Surface,” Dordrecht Kluwer Academic Publishers, Netherlands, 2004, pp. 329-350. [27] S. I. Rasool, “Potential of Remote Sensing for the Study of Global Change,” COSPAR Report to the International Council of Scientific Unions, Advances in Space Re- search, Pergamon Press, Oxford, Vol. 7, No. 1, 1987. [28] S. Ustin, “Manual of Remote Sensing: Remote Sensing for Natural Resource Management and Environmental Monitoring,” John Wiley & Sons, Chichester, 2004. [29] R. J. Jensen, “Introductory Digital Image Processing,” Prentice-Hall, Upper Saddle River, 1995, pp. 467-475. Copyright © 2011 SciRes. JGIS |