

Paper Menu >>
Journal Menu >>
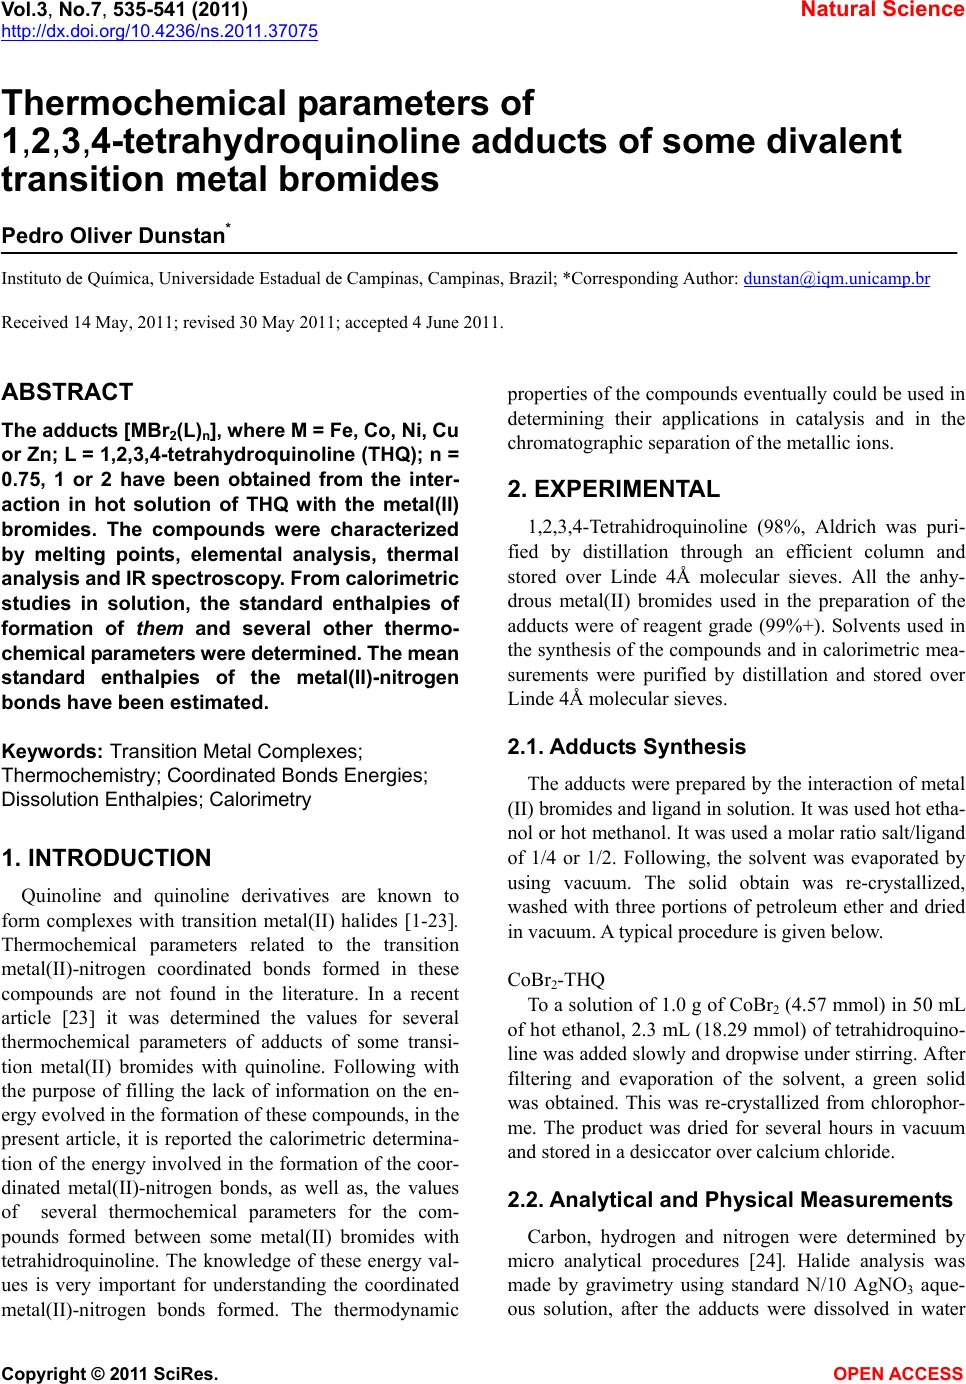 Vol.3, No.7, 535-541 (2011) Natural Science http://dx.doi.org/10.4236/ns.2011.37075 Copyright © 2011 SciRes. OPEN ACCESS Thermochemical parameters of 1,2,3,4-tetrahydroquinoline adducts of some divalent transition metal bromides Pedro Oliver Dunstan* Instituto de Química, Universidade Estadual de Campinas, Campinas, Brazil; *Corresponding Author: [email protected] Received 14 May, 2011; revised 30 May 2011; accepted 4 June 2011. ABSTRACT The adducts [MBr2(L)n], where M = Fe, Co, Ni, Cu or Zn; L = 1,2,3,4-tetrahydroquinoline (THQ); n = 0.75, 1 or 2 have been obtained from the inter- action in hot solution of THQ with the metal(II) bromides. The compounds were characterized by melting points, elemental analysis, thermal analysis and IR spectroscopy. From calorimetric studies in solution, the standard enthalpies of formation of them and several other thermo- chemical parameters were determined. The mean standard enthalpies of the metal(II)-nitrogen bonds have been estimated. Keywords: Transition Metal Complexes; Thermochemistry; Coordinated Bonds Energies; Dissolution Enthalpies; Calorimetry 1. INTRODUCTION Quinoline and quinoline derivatives are known to form complexes with transition metal(II) halides [1-23]. Thermochemical parameters related to the transition metal(II)-nitrogen coordinated bonds formed in these compounds are not found in the literature. In a recent article [23] it was determined the values for several thermochemical parameters of adducts of some transi- tion metal(II) bromides with quinoline. Following with the purpose of filling the lack of information on the en- ergy evolved in the formation of these compounds, in the present article, it is reported the calorimetric determina- tion of the energy involved in the formation of the coor- dinated metal(II)-nitrogen bonds, as well as, the values of several thermochemical parameters for the com- pounds formed between some metal(II) bromides with tetrahidroquinoline. The knowledge of these energy val- ues is very important for understanding the coordinated metal(II)-nitrogen bonds formed. The thermodynamic properties of the compounds eventually could be used in determining their applications in catalysis and in the chromatographic separation of the metallic ions. 2. EXPERIMENTAL 1,2,3,4-Tetrahidroquinoline (98%, Aldrich was puri- fied by distillation through an efficient column and stored over Linde 4Å molecular sieves. All the anhy- drous metal(II) bromides used in the preparation of the adducts were of reagent grade (99%+). Solvents used in the synthesis of the compounds and in calorimetric mea- surements were purified by distillation and stored over Linde 4Å molecular sieves. 2.1. Adducts Synthesis The adducts were prepared by the interaction of metal (II) bromides and ligand in solution. It was used hot etha- nol or hot methanol. It was used a molar ratio salt/ligand of 1/4 or 1/2. Following, the solvent was evaporated by using vacuum. The solid obtain was re-crystallized, washed with three portions of petroleum ether and dried in vacuum. A typical procedure is given below. CoBr2-THQ To a solution of 1.0 g of CoBr2 (4.57 mmol) in 50 mL of hot ethanol, 2.3 mL (18.29 mmol) of tetrahidroquino- line was added slowly and dropwise under stirring. After filtering and evaporation of the solvent, a green solid was obtained. This was re-crystallized from chlorophor- me. The product was dried for several hours in vacuum and stored in a desiccator over calcium chloride. 2.2. Analytical and Physical Measurements Carbon, hydrogen and nitrogen were determined by micro analytical procedures [24]. Halide analysis was made by gravimetry using standard N/10 AgNO3 aque- ous solution, after the adducts were dissolved in water 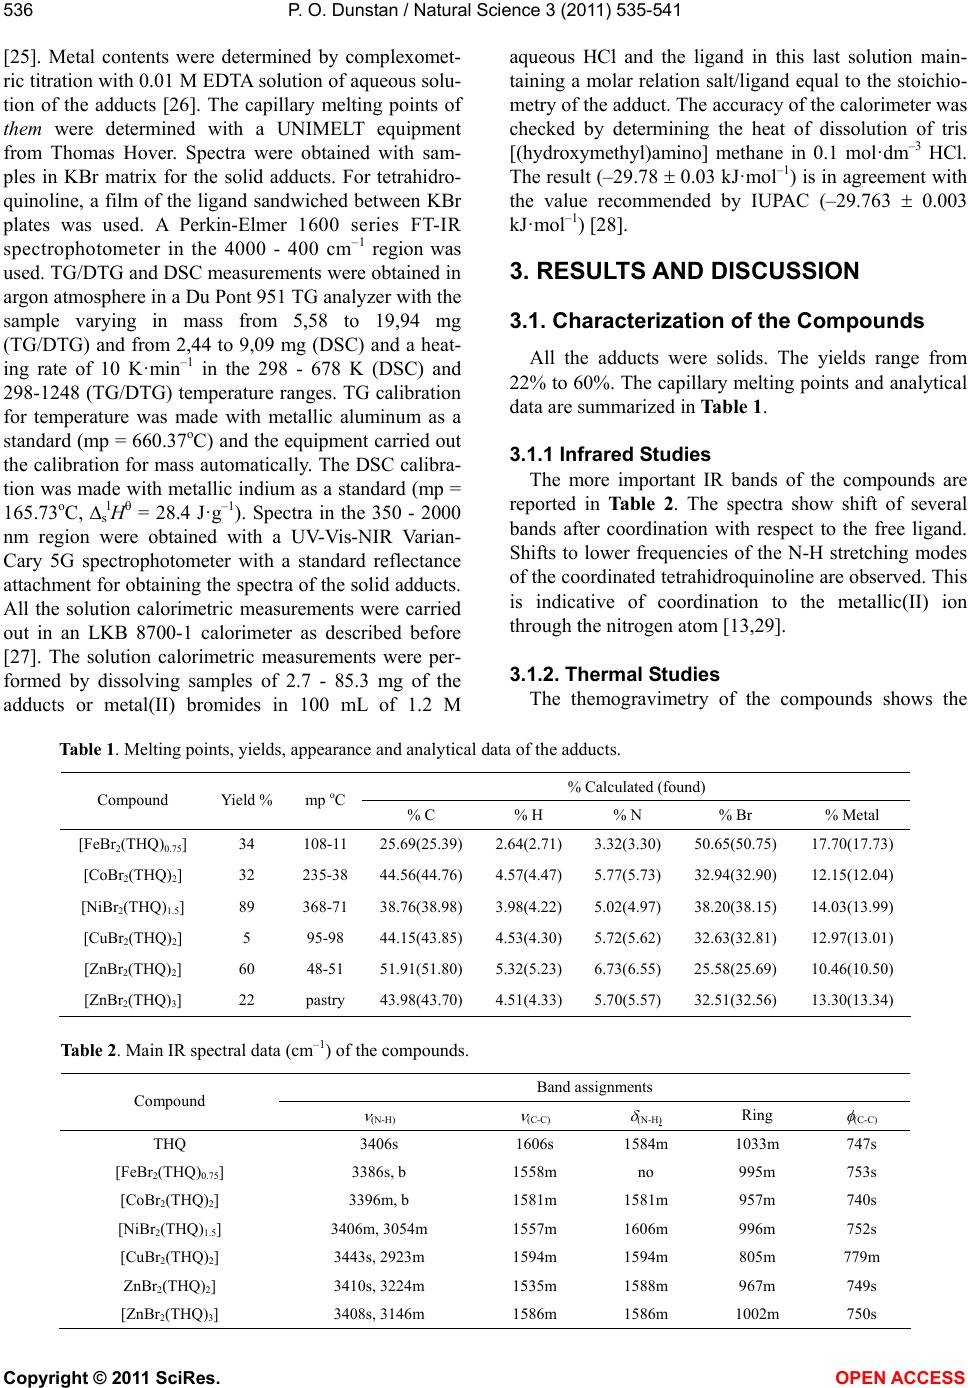 P. O. Dunstan / Natural Science 3 (2011) 535-541 Copyright © 2011 SciRes. OPEN ACCESS 536 [25]. Metal contents were determined by complexomet- ric titration with 0.01 M EDTA solution of aqueous solu- tion of the adducts [26]. The capillary melting points of them were determined with a UNIMELT equipment from Thomas Hover. Spectra were obtained with sam- ples in KBr matrix for the solid adducts. For tetrahidro- quinoline, a film of the ligand sandwiched between KBr plates was used. A Perkin-Elmer 1600 series FT-IR spectrophotometer in the 4000 - 400 cm–1 region was used. TG/DTG and DSC measurements were obtained in argon atmosphere in a Du Pont 951 TG analyzer with the sample varying in mass from 5,58 to 19,94 mg (TG/DTG) and from 2,44 to 9,09 mg (DSC) and a heat- ing rate of 10 K·min–1 in the 298 - 678 K (DSC) and 298-1248 (TG/DTG) temperature ranges. TG calibration for temperature was made with metallic aluminum as a standard (mp = 660.37oC) and the equipment carried out the calibration for mass automatically. The DSC calibra- tion was made with metallic indium as a standard (mp = 165.73oC, slH = 28.4 J·g–1). Spectra in the 350 - 2000 nm region were obtained with a UV-Vis-NIR Varian- Cary 5G spectrophotometer with a standard reflectance attachment for obtaining the spectra of the solid adducts. All the solution calorimetric measurements were carried out in an LKB 8700-1 calorimeter as described before [27]. The solution calorimetric measurements were per- formed by dissolving samples of 2.7 - 85.3 mg of the adducts or metal(II) bromides in 100 mL of 1.2 M aqueous HCl and the ligand in this last solution main- taining a molar relation salt/ligand equal to the stoichio- metry of the adduct. The accuracy of the calorimeter was checked by determining the heat of dissolution of tris [(hydroxymethyl)amino] methane in 0.1 mol·dm–3 HCl. The result (–29.78 0.03 kJ·mol–1) is in agreement with the value recommended by IUPAC (–29.763 0.003 kJ·mol–1) [28]. 3. RESULTS AND DISCUSSION 3.1. Characterization of the Compounds All the adducts were solids. The yields range from 22% to 60%. The capillary melting points and analytical data are summarized in Table 1. 3.1.1 Infrared Studies The more important IR bands of the compounds are reported in Table 2. The spectra show shift of several bands after coordination with respect to the free ligand. Shifts to lower frequencies of the N-H stretching modes of the coordinated tetrahidroquinoline are observed. This is indicative of coordination to the metallic(II) ion through the nitrogen atom [13,29]. 3.1.2. Thermal Studies The themogravimetry of the compounds shows the Table 1. Melting points, yields, appearance and analytical data of the adducts. % Calculated (found) Compound Yield % mp oC % C % H % N % Br % Metal [FeBr2(THQ)0.75] 34 108-11 25.69(25.39) 2.64(2.71) 3.32(3.30) 50.65(50.75) 17.70(17.73) [CoBr2(THQ)2] 32 235-38 44.56(44.76) 4.57(4.47) 5.77(5.73) 32.94(32.90) 12.15(12.04) [NiBr2(THQ)1.5] 89 368-71 38.76(38.98) 3.98(4.22) 5.02(4.97) 38.20(38.15) 14.03(13.99) [CuBr2(THQ)2] 5 95-98 44.15(43.85) 4.53(4.30) 5.72(5.62) 32.63(32.81) 12.97(13.01) [ZnBr2(THQ)2] 60 48-51 51.91(51.80) 5.32(5.23) 6.73(6.55) 25.58(25.69) 10.46(10.50) [ZnBr2(THQ)3] 22 pastry 43.98(43.70) 4.51(4.33) 5.70(5.57) 32.51(32.56) 13.30(13.34) Table 2. Main IR spectral data (cm–1) of the compounds. Band assignments Compound (N-H) (C-C) (N-H) Ring (C-C) THQ 3406s 1606s 1584m 1033m 747s [FeBr2(THQ)0.75] 3386s, b 1558m no 995m 753s [CoBr2(THQ)2] 3396m, b 1581m 1581m 957m 740s [NiBr2(THQ)1.5] 3406m, 3054m 1557m 1606m 996m 752s [CuBr2(THQ)2] 3443s, 2923m 1594m 1594m 805m 779m ZnBr2(THQ)2] 3410s, 3224m 1535m 1588m 967m 749s [ZnBr2(THQ)3] 3408s, 3146m 1586m 1586m 1002m 750s 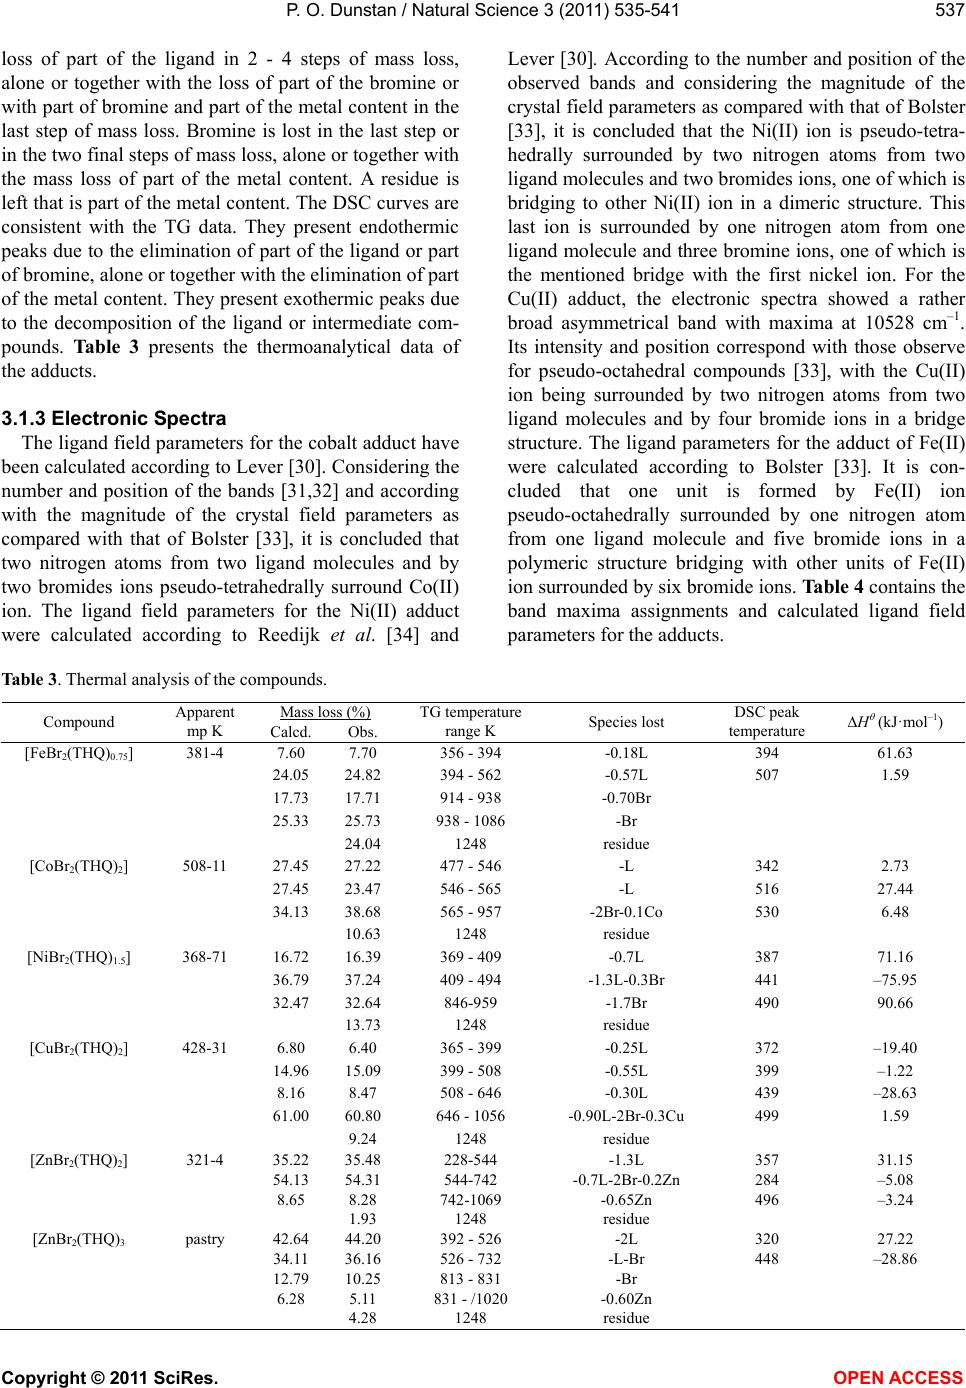 P. O. Dunstan / Natural Science 3 (2011) 535-541 Copyright © 2011 SciRes. OPEN ACCESS 537 loss of part of the ligand in 2 - 4 steps of mass loss, alone or together with the loss of part of the bromine or with part of bromine and part of the metal content in the last step of mass loss. Bromine is lost in the last step or in the two final steps of mass loss, alone or together with the mass loss of part of the metal content. A residue is left that is part of the metal content. The DSC curves are consistent with the TG data. They present endothermic peaks due to the elimination of part of the ligand or part of bromine, alone or together with the elimination of part of the metal content. They present exothermic peaks due to the decomposition of the ligand or intermediate com- pounds. Table 3 presents the thermoanalytical data of the adducts. 3.1.3 Electronic Spectra The ligand field parameters for the cobalt adduct have been calculated according to Lever [30]. Considering the number and position of the bands [31,32] and according with the magnitude of the crystal field parameters as compared with that of Bolster [33], it is concluded that two nitrogen atoms from two ligand molecules and by two bromides ions pseudo-tetrahedrally surround Co(II) ion. The ligand field parameters for the Ni(II) adduct were calculated according to Reedijk et al. [34] and Lever [30]. According to the number and position of the observed bands and considering the magnitude of the crystal field parameters as compared with that of Bolster [33], it is concluded that the Ni(II) ion is pseudo-tetra- hedrally surrounded by two nitrogen atoms from two ligand molecules and two bromides ions, one of which is bridging to other Ni(II) ion in a dimeric structure. This last ion is surrounded by one nitrogen atom from one ligand molecule and three bromine ions, one of which is the mentioned bridge with the first nickel ion. For the Cu(II) adduct, the electronic spectra showed a rather broad asymmetrical band with maxima at 10528 cm–1. Its intensity and position correspond with those observe for pseudo-octahedral compounds [33], with the Cu(II) ion being surrounded by two nitrogen atoms from two ligand molecules and by four bromide ions in a bridge structure. The ligand parameters for the adduct of Fe(II) were calculated according to Bolster [33]. It is con- cluded that one unit is formed by Fe(II) ion pseudo-octahedrally surrounded by one nitrogen atom from one ligand molecule and five bromide ions in a polymeric structure bridging with other units of Fe(II) ion surrounded by six bromide ions. Table 4 contains the band maxima assignments and calculated ligand field parameters for the adducts. Table 3. Thermal analysis of the compounds. Mass loss (%) Compound Apparent mp K Calcd. Obs. TG temperature range K Species lost DSC peak temperature H (kJ·mol–1) [FeBr2(THQ)0.75] 381-4 7.60 7.70 356 - 394 -0.18L 394 61.63 24.05 24.82 394 - 562 -0.57L 507 1.59 17.73 17.71 914 - 938 -0.70Br 25.33 25.73 938 - 1086 -Br 24.04 1248 residue [CoBr2(THQ)2] 508-11 27.45 27.22 477 - 546 -L 342 2.73 27.45 23.47 546 - 565 -L 516 27.44 34.13 38.68 565 - 957 -2Br-0.1Co 530 6.48 10.63 1248 residue [NiBr2(THQ)1.5] 368-71 16.72 16.39 369 - 409 -0.7L 387 71.16 36.79 37.24 409 - 494 -1.3L-0.3Br 441 –75.95 32.47 32.64 846-959 -1.7Br 490 90.66 13.73 1248 residue [CuBr2(THQ)2] 428-31 6.80 6.40 365 - 399 -0.25L 372 –19.40 14.96 15.09 399 - 508 -0.55L 399 –1.22 8.16 8.47 508 - 646 -0.30L 439 –28.63 61.00 60.80 646 - 1056 -0.90L-2Br-0.3Cu 499 1.59 9.24 1248 residue [ZnBr2(THQ)2] 321-4 35.22 35.48 228-544 -1.3L 357 31.15 54.13 54.31 544-742 -0.7L-2Br-0.2Zn 284 –5.08 8.65 8.28 742-1069 -0.65Zn 496 –3.24 1.93 1248 residue [ZnBr2(THQ)3 pastry 42.64 44.20 392 - 526 -2L 320 27.22 34.11 36.16 526 - 732 -L-Br 448 –28.86 12.79 10.25 813 - 831 -Br 6.28 5.11 831 - /1020 -0.60Zn 4.28 1248 residue 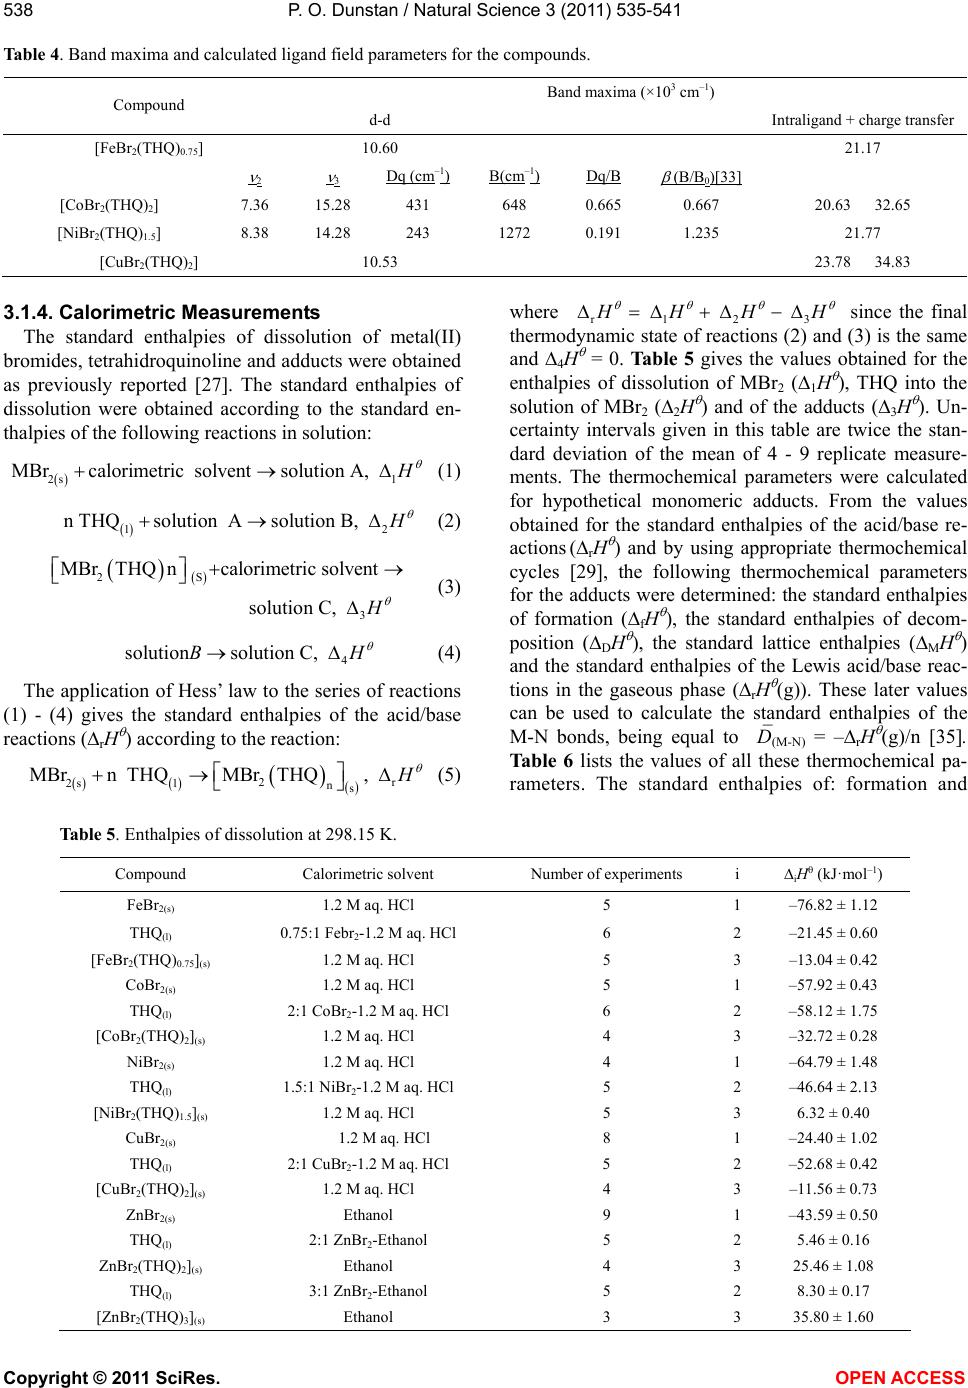 P. O. Dunstan / Natural Science 3 (2011) 535-541 Copyright © 2011 SciRes. OPEN ACCESS 538 Table 4. Band maxima and calculated ligand field parameters for the compounds. Band maxima (×103 cm–1) Compound d-d Intraligand + charge transfer [FeBr2(THQ)0.75] 10.60 21.17 2 3 Dq (cm–1) B(cm–1) Dq/B (B/B0)[33] [CoBr2(THQ)2] 7.36 15.28 431 648 0.665 0.667 20.63 32.65 [NiBr2(THQ)1.5] 8.38 14.28 243 1272 0.191 1.235 21.77 [CuBr2(THQ)2] 10.53 23.78 34.83 3.1.4. Calorimetric Measurements The standard enthalpies of dissolution of metal(II) bromides, tetrahidroquinoline and adducts were obtained as previously reported [27]. The standard enthalpies of dissolution were obtained according to the standard en- thalpies of the following reactions in solution: 1 2s MBrcalorimetric solventsolution A, H (1) 2 1 n THQsolution Asolution B, H (2) 2S 3 MBrTHQncalorimetric solvent solution C, H (3) 4 solutionsolution C, BH (4) The application of Hess’ law to the series of reactions (1) - (4) gives the standard enthalpies of the acid/base reactions (rH ) according to the reaction: 2r 2s 1ns MBrn THQMBrTHQ, H (5) where r123 H HHH since the final thermodynamic state of reactions (2) and (3) is the same and 4H = 0. Ta b l e 5 gives the values obtained for the enthalpies of dissolution of MBr2 (1H ), THQ into the solution of MBr2 (2H ) and of the adducts (3H ). Un- certainty intervals given in this table are twice the stan- dard deviation of the mean of 4 - 9 replicate measure- ments. The thermochemical parameters were calculated for hypothetical monomeric adducts. From the values obtained for the standard enthalpies of the acid/base re- actions (rH ) and by using appropriate thermochemical cycles [29], the following thermochemical parameters for the adducts were determined: the standard enthalpies of formation (fH ), the standard enthalpies of decom- position (DH ), the standard lattice enthalpies (MH ) and the standard enthalpies of the Lewis acid/base reac- tions in the gaseous phase (rH (g)). These later values can be used to calculate the standard enthalpies of the M-N bonds, being equal to D(M-N) = –rH (g)/n [35]. Table 6 lists the values of all these thermochemical pa- rameters. The standard enthalpies of: formation and Table 5. Enthalpies of dissolution at 298.15 K. Compound Calorimetric solvent Number of experiments i iH (kJ·mol–1) FeBr2(s) 1.2 M aq. HCl 5 1 –76.82 ± 1.12 THQ(l) 0.75:1 Febr2-1.2 M aq. HCl 6 2 –21.45 ± 0.60 [FeBr2(THQ)0.75](s) 1.2 M aq. HCl 5 3 –13.04 ± 0.42 CoBr2(s) 1.2 M aq. HCl 5 1 –57.92 ± 0.43 THQ(l) 2:1 CoBr2-1.2 M aq. HCl 6 2 –58.12 ± 1.75 [CoBr2(THQ)2](s) 1.2 M aq. HCl 4 3 –32.72 ± 0.28 NiBr2(s) 1.2 M aq. HCl 4 1 –64.79 ± 1.48 THQ(l) 1.5:1 NiBr2-1.2 M aq. HCl 5 2 –46.64 ± 2.13 [NiBr2(THQ)1.5](s) 1.2 M aq. HCl 5 3 6.32 ± 0.40 CuBr2(s) 1.2 M aq. HCl 8 1 –24.40 ± 1.02 THQ(l) 2:1 CuBr2-1.2 M aq. HCl 5 2 –52.68 ± 0.42 [CuBr2(THQ)2](s) 1.2 M aq. HCl 4 3 –11.56 ± 0.73 ZnBr2(s) Ethanol 9 1 –43.59 ± 0.50 THQ(l) 2:1 ZnBr2-Ethanol 5 2 5.46 ± 0.16 ZnBr2(THQ)2](s) Ethanol 4 3 25.46 ± 1.08 THQ(l) 3:1 ZnBr2-Ethanol 5 2 8.30 ± 0.17 [ZnBr2(THQ)3](s) Ethanol 3 3 35.80 ± 1.60 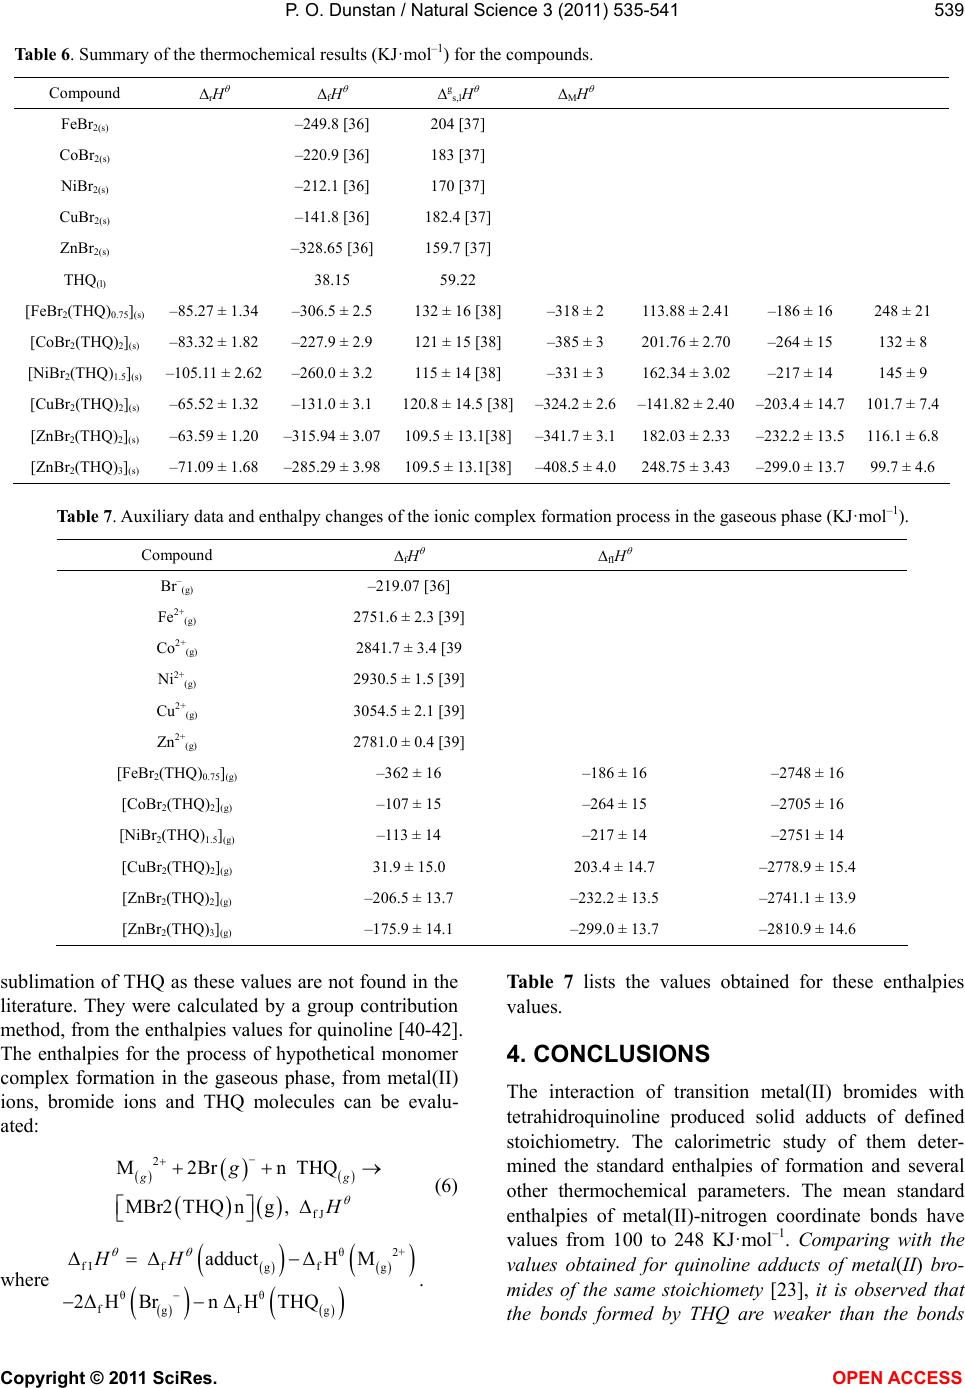 P. O. Dunstan / Natural Science 3 (2011) 535-541 Copyright © 2011 SciRes. OPEN ACCESS 539 Table 6. Summary of the thermochemical results (KJ·mol–1) for the compounds. Compound rH fH gs,lH MH FeBr2(s) –249.8 [36] 204 [37] CoBr2(s) –220.9 [36] 183 [37] NiBr2(s) –212.1 [36] 170 [37] CuBr2(s) –141.8 [36] 182.4 [37] ZnBr2(s) –328.65 [36] 159.7 [37] THQ(l) 38.15 59.22 [FeBr2(THQ)0.75](s) –85.27 ± 1.34 –306.5 ± 2.5 132 ± 16 [38] –318 ± 2 113.88 ± 2.41 –186 ± 16 248 ± 21 [CoBr2(THQ)2](s) –83.32 ± 1.82 –227.9 ± 2.9 121 ± 15 [38] –385 ± 3 201.76 ± 2.70 –264 ± 15 132 ± 8 [NiBr2(THQ)1.5](s) –105.11 ± 2.62 –260.0 ± 3.2 115 ± 14 [38] –331 ± 3 162.34 ± 3.02 –217 ± 14 145 ± 9 [CuBr2(THQ)2](s) –65.52 ± 1.32 –131.0 ± 3.1 120.8 ± 14.5 [38]–324.2 ± 2.6–141.82 ± 2.40 –203.4 ± 14.7 101.7 ± 7.4 [ZnBr2(THQ)2](s) –63.59 ± 1.20 –315.94 ± 3.07109.5 ± 13.1[38]–341.7 ± 3.1182.03 ± 2.33 –232.2 ± 13.5 116.1 ± 6.8 [ZnBr2(THQ)3](s) –71.09 ± 1.68 –285.29 ± 3.98109.5 ± 13.1[38]–408.5 ± 4.0248.75 ± 3.43 –299.0 ± 13.7 99.7 ± 4.6 Table 7. Auxiliary data and enthalpy changes of the ionic complex formation process in the gaseous phase (KJ·mol–1). Compound fH fIH Br–(g) –219.07 [36] Fe2+(g) 2751.6 ± 2.3 [39] Co2+(g) 2841.7 ± 3.4 [39 Ni2+(g) 2930.5 ± 1.5 [39] Cu2+(g) 3054.5 ± 2.1 [39] Zn2+(g) 2781.0 ± 0.4 [39] [FeBr2(THQ)0.75](g) –362 ± 16 –186 ± 16 –2748 ± 16 [CoBr2(THQ)2](g) –107 ± 15 –264 ± 15 –2705 ± 16 [NiBr2(THQ)1.5](g) –113 ± 14 –217 ± 14 –2751 ± 14 [CuBr2(THQ)2](g) 31.9 ± 15.0 203.4 ± 14.7 –2778.9 ± 15.4 [ZnBr2(THQ)2](g) –206.5 ± 13.7 –232.2 ± 13.5 –2741.1 ± 13.9 [ZnBr2(THQ)3](g) –175.9 ± 14.1 –299.0 ± 13.7 –2810.9 ± 14.6 sublimation of THQ as these values are not found in the literature. They were calculated by a group contribution method, from the enthalpies values for quinoline [40-42]. The enthalpies for the process of hypothetical monomer complex formation in the gaseous phase, from metal(II) ions, bromide ions and THQ molecules can be evalu- ated: 2 fJ M2Br n THQ MBr2THQng, gg g H (6) where θ2+ fI ff gg θθ ff gg adductΔHM 2ΔHBrn ΔHTHQ HH . Table 7 lists the values obtained for these enthalpies values. 4. CONCLUSIONS The interaction of transition metal(II) bromides with tetrahidroquinoline produced solid adducts of defined stoichiometry. The calorimetric study of them deter- mined the standard enthalpies of formation and several other thermochemical parameters. The mean standard enthalpies of metal(II)-nitrogen coordinate bonds have values from 100 to 248 KJ·mol–1. Comparing with the values obtained for quinoline adducts of metal(II) bro- mides of the same stoichiomety [23], it is observed that the bonds formed by THQ are weaker than the bonds 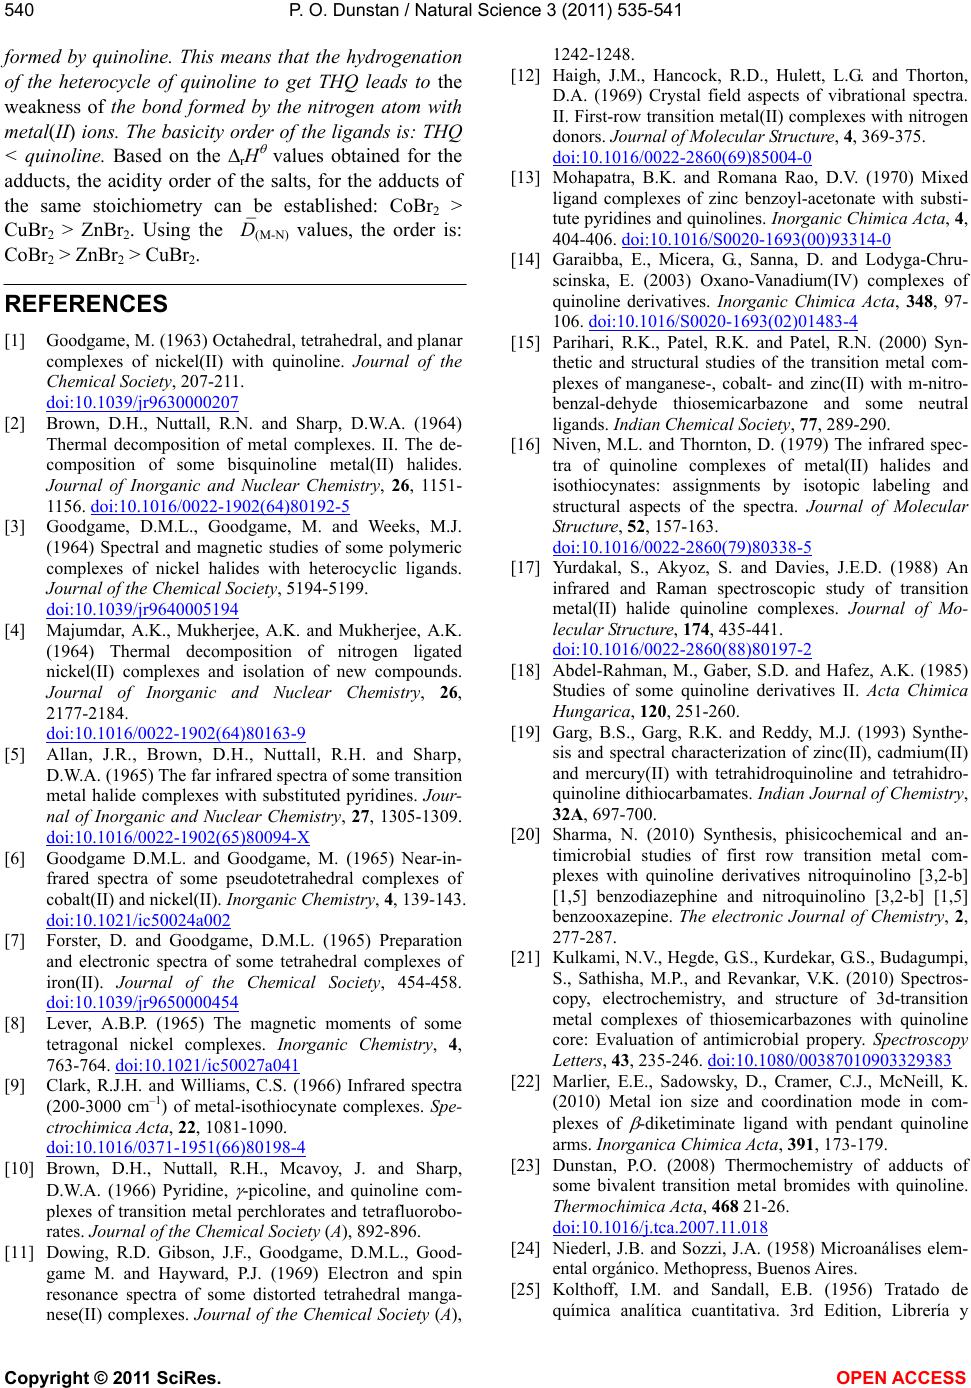 P. O. Dunstan / Natural Science 3 (2011) 535-541 Copyright © 2011 SciRes. OPEN ACCESS 540 formed by quinoline. This means that the hydrogenation of the heterocycle of quinoline to get THQ leads to the weakness of the bond formed by the nitrogen atom with metal(II) ions. The basicity order of the ligands is: THQ < quinoline. Based on the rH values obtained for the adducts, the acidity order of the salts, for the adducts of the same stoichiometry can be established: CoBr2 > CuBr2 > ZnBr2. Using the D(M-N) values, the order is: CoBr2 > ZnBr2 > CuBr2. REFERENCES [1] Goodgame, M. (1963) Octahedral, tetrahedral, and planar complexes of nickel(II) with quinoline. Journal of the Chemical Society, 207-211. doi:10.1039/jr9630000207 [2] Brown, D.H., Nuttall, R.N. and Sharp, D.W.A. (1964) Thermal decomposition of metal complexes. II. The de- composition of some bisquinoline metal(II) halides. Journal of Inorganic and Nuclear Chemistry, 26, 1151- 1156. doi:10.1016/0022-1902(64)80192-5 [3] Goodgame, D.M.L., Goodgame, M. and Weeks, M.J. (1964) Spectral and magnetic studies of some polymeric complexes of nickel halides with heterocyclic ligands. Journal of the Chemical Society, 5194-5199. doi:10.1039/jr9640005194 [4] Majumdar, A.K., Mukherjee, A.K. and Mukherjee, A.K. (1964) Thermal decomposition of nitrogen ligated nickel(II) complexes and isolation of new compounds. Journal of Inorganic and Nuclear Chemistry, 26, 2177-2184. doi:10.1016/0022-1902(64)80163-9 [5] Allan, J.R., Brown, D.H., Nuttall, R.H. and Sharp, D.W.A. (1965) The far infrared spectra of some transition metal halide complexes with substituted pyridines. Jour- nal of Inorganic and Nuclear Chemistry, 27, 1305-1309. doi:10.1016/0022-1902(65)80094-X [6] Goodgame D.M.L. and Goodgame, M. (1965) Near-in- frared spectra of some pseudotetrahedral complexes of cobalt(II) and nickel(II). Inorganic Chemistry, 4, 139-143. doi:10.1021/ic50024a002 [7] Forster, D. and Goodgame, D.M.L. (1965) Preparation and electronic spectra of some tetrahedral complexes of iron(II). Journal of the Chemical Society, 454-458. doi:10.1039/jr9650000454 [8] Lever, A.B.P. (1965) The magnetic moments of some tetragonal nickel complexes. Inorganic Chemistry, 4, 763-764. doi:10.1021/ic50027a041 [9] Clark, R.J.H. and Williams, C.S. (1966) Infrared spectra (200-3000 cm–1) of metal-isothiocynate complexes. Spe- ctrochimica Acta, 22, 1081-1090. doi:10.1016/0371-1951(66)80198-4 [10] Brown, D.H., Nuttall, R.H., Mcavoy, J. and Sharp, D.W.A. (1966) Pyridine, -picoline, and quinoline com- plexes of transition metal perchlorates and tetrafluorobo- rates. Journal of the Chemical Society (A), 892-896. [11] Dowing, R.D. Gibson, J.F., Goodgame, D.M.L., Good- game M. and Hayward, P.J. (1969) Electron and spin resonance spectra of some distorted tetrahedral manga- nese(II) complexes. Journal of the Chemical Society (A), 1242-1248. [12] Haigh, J.M., Hancock, R.D., Hulett, L.G. and Thorton, D.A. (1969) Crystal field aspects of vibrational spectra. II. First-row transition metal(II) complexes with nitrogen donors. Journal of Molecular Structure, 4, 369-375. doi:10.1016/0022-2860(69)85004-0 [13] Mohapatra, B.K. and Romana Rao, D.V. (1970) Mixed ligand complexes of zinc benzoyl-acetonate with substi- tute pyridines and quinolines. Inorganic Chimica Acta, 4, 404-406. doi:10.1016/S0020-1693(00)93314-0 [14] Garaibba, E., Micera, G., Sanna, D. and Lodyga-Chru- scinska, E. (2003) Oxano-Vanadium(IV) complexes of quinoline derivatives. Inorganic Chimica Acta, 348, 97- 106. doi:10.1016/S0020-1693(02)01483-4 [15] Parihari, R.K., Patel, R.K. and Patel, R.N. (2000) Syn- thetic and structural studies of the transition metal com- plexes of manganese-, cobalt- and zinc(II) with m-nitro- benzal-dehyde thiosemicarbazone and some neutral ligands. Indian Chemical Society, 77, 289-290. [16] Niven, M.L. and Thornton, D. (1979) The infrared spec- tra of quinoline complexes of metal(II) halides and isothiocynates: assignments by isotopic labeling and structural aspects of the spectra. Journal of Molecular Structure, 52, 157-163. doi:10.1016/0022-2860(79)80338-5 [17] Yurdakal, S., Akyoz, S. and Davies, J.E.D. (1988) An infrared and Raman spectroscopic study of transition metal(II) halide quinoline complexes. Journal of Mo- lecular Structure, 174, 435-441. doi:10.1016/0022-2860(88)80197-2 [18] Abdel-Rahman, M., Gaber, S.D. and Hafez, A.K. (1985) Studies of some quinoline derivatives II. Acta Chimica Hungarica, 120, 251-260. [19] Garg, B.S., Garg, R.K. and Reddy, M.J. (1993) Synthe- sis and spectral characterization of zinc(II), cadmium(II) and mercury(II) with tetrahidroquinoline and tetrahidro- quinoline dithiocarbamates. Indian Journal of Chemistry, 32A, 697-700. [20] Sharma, N. (2010) Synthesis, phisicochemical and an- timicrobial studies of first row transition metal com- plexes with quinoline derivatives nitroquinolino [3,2-b] [1,5] benzodiazephine and nitroquinolino [3,2-b] [1,5] benzooxazepine. The electronic Journal of Chemistry, 2, 277-287. [21] Kulkami, N.V., Hegde, G.S., Kurdekar, G.S., Budagumpi, S., Sathisha, M.P., and Revankar, V.K. (2010) Spectros- copy, electrochemistry, and structure of 3d-transition metal complexes of thiosemicarbazones with quinoline core: Evaluation of antimicrobial propery. Spectroscopy Letters, 43, 235-246. doi:10.1080/00387010903329383 [22] Marlier, E.E., Sadowsky, D., Cramer, C.J., McNeill, K. (2010) Metal ion size and coordination mode in com- plexes of -diketiminate ligand with pendant quinoline arms. Inorganica Chimica Acta, 391, 173-179. [23] Dunstan, P.O. (2008) Thermochemistry of adducts of some bivalent transition metal bromides with quinoline. Thermochimica Acta, 468 21-26. doi:10.1016/j.tca.2007.11.018 [24] Niederl, J.B. and Sozzi, J.A. (1958) Microanálises elem- ental orgánico. Methopress, Buenos Aires. [25] Kolthoff, I.M. and Sandall, E.B. (1956) Tratado de química analítica cuantitativa. 3rd Edition, Librería y  P. O. Dunstan / Natural Science 3 (2011) 535-541 Copyright © 2011 SciRes. OPEN ACCESS 541 Editorial Nigar S. R. L., Buenos Aires. [26] Flashka, H.A. (1964) Edta titrations: An introduction to theory and practice. 2th Edition, Pergamon Press, Lon- don. [27] Dunstan, P.O. (2005) Thermochemical parameters of -picoline N-oxide adducts of some divalent transition metal bromides. Journal of Thermal Analisis and Calo- rimetry, 79, 355-359. doi:10.1007/s10973-005-0064-4 [28] Henrington, E.F. (1974) Recommendation reference ma- terials for the realization of physicochemical properties (recommendation approved 1974). Pure and Applied Chemistry, 40, 391-450. doi:10.1351/pac197440030391 [29] Dunstan, P.O. (2010) Thermochemistry of quinoline and morpholine aducts of cadmium(II) halides. Journal of Chemical and Engineering Data, 55, 4995-4998. doi:10.1021/ed045p711 [30] Lever, A.B.P. (1968) Electronic spectra of some transi- tion metal complexes. Derivation of D (sub q) and B. Journal of Chemical Education, 45, 711-712. doi:10.1021/ed045p711 [31] West, D.X. and Severns, J.C. (1988) Cobalt(II) com- plexes of the 2-aminopicoline N-oxide and 2-amino-4, 6-lutidine N-oxide. Transition Metal Chemistry, 13, 45- 49. doi:10.1007/BF01041498 [32] Brown, D.H., Kenyon, D. and Sharp, D.W.A. (1969) Thermal decomposition of some pyridine N-oxide and substituted pyridine N-oxide complexes of manganese(II), cobalt(II), nickel(II), and zinc(II) halides. Journal of the Chemical Society (A), 1474-1477. [33] Bolster, M.W.G. (1972) The coordination chemistry of aminophosphinoxide and related compounds. Thesis, Leiden University, Leiden. [34] Reedijk, J., Van Lecuwen, P.W.N.M. and Groenveld, W.L. (1968) Semi-empirical energy-level diagram for octahe- dral nickel(II) complexes. Recueil des Travaux Chimi- ques des Pays-Bas, 87, 129-143. doi:10.1002/recl.19680870203 [35] Dunstan, P.O. and dos Santos, L.C.R. (1989) Thermo- chemistry of amide and thioamide complexes of arsenic trihalides. Thermochimica Acta, 156, 163-177. doi:10.1016/0040-6031(89)87182-5 [36] Wagmam, D.D., Evans, W.H. Parker, V.B., Schumn, R.H., Hallow, I., Churney, S. and Nuttall, R.L. (1982) The NBS table of chemical thermodynamic properties. Selected values for inorganic and C1 and C2 organic substances in SI units. Journal of Physical and Chemical Reference Data, 2, 50, 139, 155, 166, 171, 178. [37] Dunstan, P.O. (2004) Thermochemistry of adducts of some transition metal(II) bromides with pyridine N-oxide. Thermochimica Acta, 409, 19-24. doi:10.1016/S0040-6031(03)00333-2 [38] Davydova, E.I., Savastionova, J.N., Suvorov, A.V. and Timoshkin, A.Y. (2010) Molecular complexes formed by halides of group 4, 5, 13-14 elements and thermody- namic characterization of their vaporization and dissocia- tion found by static tensimetric method. Coordination Chemistry Reviews, 254, 2031-2077. doi:10.1016/j.ccr.2010.04.001 [39] Skinner, H.A. and Pilcher, G. (1963) Bond-energy-term values in hydrocarbons and related compounds. Quar- terly Reviews (London), 17, 264-288. [40] Cox, J.D. and Pilcher, G. (1970) Thermochemistry of organic and organo-metallic compounds. 2th Edition, Academic Press, London. [41] Ducros, M., Cruson, J.F. and Sannier, H. (1980) Esti- mation des enthalpies de vaporization des composes organiques liquedes parte 1. Applications aux alcanes, cyclo-alcanes, alcenes, hydrocarbures benzeniques, alc- ool, alcanes thiols et aldehys. Thermo-chimica Acta, 36, 39-65. doi:10.1016/0040-6031(80)80109-2 [42] Ducros, M., Cruson, J.F.and Sannier, H. (1981) Esti- mation dês enthalpies de vaporisa-tion des composes organiques liquides parte 2. Applicatins aux ethers- oxydes, thioalcanes, cetones et amines. Thermochimica Acta, 44, 131-140. doi:10.1016/0040-6031(81)80035-4 |