

Paper Menu >>
Journal Menu >>
 Vol.3, No.7, 617-621 (2011) Natural Science http://dx.doi.org/10.4236/ns.2011.37084 Copyright © 2011 SciRes. OPEN ACCESS X and -rays emission probabilities of 131I and 133Xe Paşa Yalçın1, Arif Baştuğ2 1Department of Science Education, Faculty of Education, Erzincan University, Erzincan, Türkiye; *Corresponding Author:[email protected] 2Department of Physics, Faculty of Arts and Sciences, Aksaray University, Aksaray, Türkiye. Received 18 May 2011; revised 4 June 2011; accepted 11 June 2011. ABSTRACT Radioactive nuclides as 131I and 133Xe are in- creasingly used for both clinical diagnosis and therapeutic treatment of the patient. For exam- ple, 131I is used for the treatment of thyroid gland cancer. Otherwise, 133Xe is used in ventilation studies to assess and evaluate pulmonary func- tion and to provide images of the lungs in both cardiac and pulmonary diseases, such as asthma, pulmonary emphysema, bronchiectasis, carci- noma of the lung, and pulmonary embolism 1,2. Furthermore, cerebral blood flow is measured using 133Xe inhalation. In this study, the X and -rays emission probabilities in the decay of 131I and 133Xe were precisely measured with a cali- brated Si(Li) detector. Results of this study were compared using available results in the litera- ture. Good agreement was observed between our results and available results in the literature. Keyw ords: 131I; 133Xe; X-Rays Emission Probabilities; -Rays Emission Probabilities 1. INTRODUCTION Radioactive decay occurs as a consequence of the rela- tive values of a number of basic nuclear parameters. De- cay data are defined as those parameters relating to the normal radioactive decay modes of a nuclide and include, such as: half-life; total decay energies and branching frac- tions; alpha-particle energies and emission probabilities; beta-particle energies, emission probabilities, and transi- tion types; electron-capture (and positron) energies, tran- sition probabilities and transition types; gamma-ray ener- gies, emission probabilities and internal conversion coef- ficients; Auger and conversion-electron energies and emi- ssion probabilities; X-ray energies and emission probabi- lities; characteristics of spontaneous fission; delayed-neu- tron energies and emission probabilities; delayed-proton energies and emission probabilities3. Beta decay is one process that unstable atoms can use to become more stable. There are two types of beta de- cay: beta-minus and beta-plus. During beta-minus decay, a neutron in an atom’s nucleus turns into a proton, an electron and an antineutrino (n p + e– + ῡe). The elec- tron and antineutrino fly away from the nucleus, which shares the momentum and energy of the decay and now has one more proton than it started with. Since an atom gains a proton during beta-minus decay, it changes from one element to another. For example, the radionuclides 131I (T1/2 = 8.020 d) and 133Xe (T1/2 = 5.243 d) undergo –-decay to the excited states of 131Xe and 133Cs respec- tively, which further de-excite by gamma emission and the competing internal conversion process leading to X-rays or Auger electron emission. Physicians and physicists must know the identity and amount of activity of each nuclide prior to administra- tion. The possible presence of radiochemical impurities also has to be considered, because they may compromise the quality of the clinical results and increase the ab- sorbed dose. Furthermore, the erroneous administration of a low amount activity in diagnostic studies may result in errors of diagnosis, whereas an excessively high ac- tivity leads to an unnecessary high dose to the patient. Both incorrect applications can delay adequate treatment, or cause discomfort and serious damage to the patient’s health 4. Separately, the emission probabilities of radionuclides with well-characterized - and X-rays have been used for the efficiency calibration of X-ray and gamma-ray de- tectors, elemental analysis, in environmental radioactive measurements, domestic computations and activity mea- surements 5. In view of the above, we thought worthwhile to measure the emission probabilities of different K and L X-rays together with the -rays emitted in the decays of 131I and 133Xe using a calibrated and high resolution semiconductor detector. 2. EXPERIMENTAL Emission probabilities of X and -rays following the decay of 131I and 133Xe were measured with the experi- mental arrangement shown in Figure 1. The -ray and 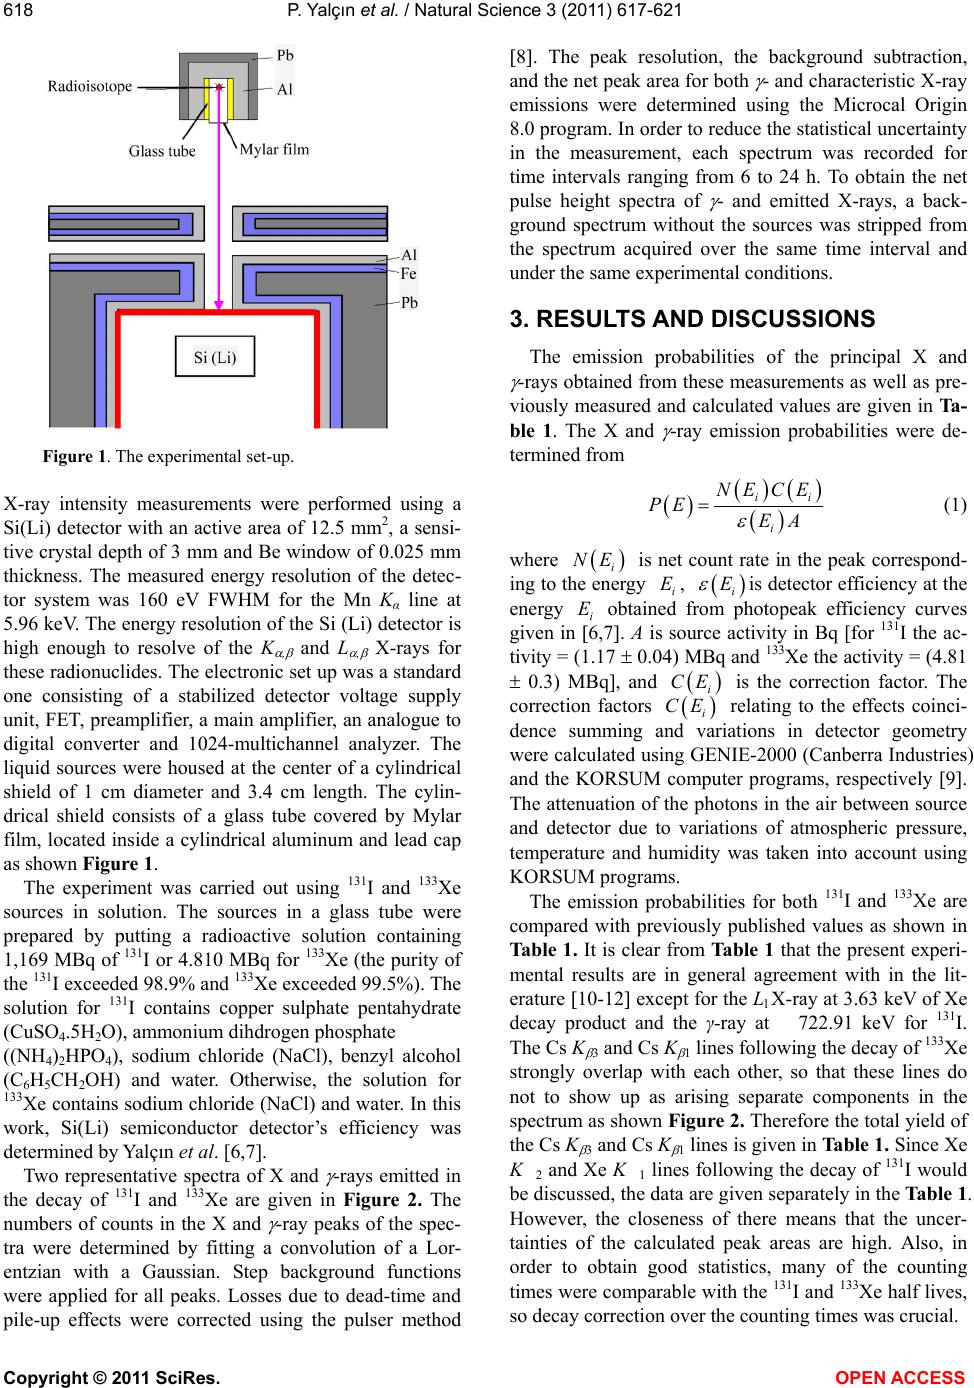 P. Yalçın et al. / Natural Science 3 (2011) 617-621 Copyright © 2011 SciRes. OPEN ACCESS 618 Figure 1. The experimental set-up. X-ray intensity measurements were performed using a Si(Li) detector with an active area of 12.5 mm2, a sensi- tive crystal depth of 3 mm and Be window of 0.025 mm thickness. The measured energy resolution of the detec- tor system was 160 eV FWHM for the Mn Kα line at 5.96 keV. The energy resolution of the Si (Li) detector is high enough to resolve of the K , and L , X-rays for these radionuclides. The electronic set up was a standard one consisting of a stabilized detector voltage supply unit, FET, preamplifier, a main amplifier, an analogue to digital converter and 1024-multichannel analyzer. The liquid sources were housed at the center of a cylindrical shield of 1 cm diameter and 3.4 cm length. The cylin- drical shield consists of a glass tube covered by Mylar film, located inside a cylindrical aluminum and lead cap as shown Figure 1. The experiment was carried out using 131I and 133Xe sources in solution. The sources in a glass tube were prepared by putting a radioactive solution containing 1,169 MBq of 131I or 4.810 MBq for 133Xe (the purity of the 131I exceeded 98.9% and 133Xe exceeded 99.5%). The solution for 131I contains copper sulphate pentahydrate (CuSO4.5H2O), ammonium dihdrogen phosphate ((NH4)2HPO4), sodium chloride (NaCl), benzyl alcohol (C6H5CH2OH) and water. Otherwise, the solution for 133Xe contains sodium chloride (NaCl) and water. In this work, Si(Li) semiconductor detector’s efficiency was determined by Yalçın et al. [6,7]. Two representative spectra of X and -rays emitted in the decay of 131I and 133Xe are given in Figure 2. The numbers of counts in the X and -ray peaks of the spec- tra were determined by fitting a convolution of a Lor- entzian with a Gaussian. Step background functions were applied for all peaks. Losses due to dead-time and pile-up effects were corrected using the pulser method 8. The peak resolution, the background subtraction, and the net peak area for both - and characteristic X-ray emissions were determined using the Microcal Origin 8.0 program. In order to reduce the statistical uncertainty in the measurement, each spectrum was recorded for time intervals ranging from 6 to 24 h. To obtain the net pulse height spectra of - and emitted X-rays, a back- ground spectrum without the sources was stripped from the spectrum acquired over the same time interval and under the same experimental conditions. 3. RESULTS AND DISCUSSIONS The emission probabilities of the principal X and -rays obtained from these measurements as well as pre- viously measured and calculated values are given in Ta- ble 1. The X and -ray emission probabilities were de- termined from ii i NE CE PE EA (1) where i NE is net count rate in the peak correspond- ing to the energy i E, i E is detector efficiency at the energy i E obtained from photopeak efficiency curves given in 6,7. A is source activity in Bq [for 131I the ac- tivity = (1.17 0.04) MBq and 133Xe the activity = (4.81 0.3) MBq], and i CE is the correction factor. The correction factors i CE relating to the effects coinci- dence summing and variations in detector geometry were calculated using GENIE-2000 (Canberra Industries) and the KORSUM computer programs, respectively 9. The attenuation of the photons in the air between source and detector due to variations of atmospheric pressure, temperature and humidity was taken into account using KORSUM programs. The emission probabilities for both 131I and 133Xe are compared with previously published values as shown in Table 1. It is clear from Table 1 that the present experi- mental results are in general agreement with in the lit- erature 10-12 except for the Ll X-ray at 3.63 keV of Xe decay product and the γ-ray at 722.91 keV for 131I. The Cs K 3 and Cs K 1 lines following the decay of 133Xe strongly overlap with each other, so that these lines do not to show up as arising separate components in the spectrum as shown Figure 2. Therefore the total yield of the Cs K 3 and Cs K 1 lines is given in Table 1. Since Xe K2 and Xe K1 lines following the decay of 131I would be discussed, the data are given separately in the Table 1. However, the closeness of there means that the uncer- tainties of the calculated peak areas are high. Also, in order to obtain good statistics, many of the counting times were comparable with the 131I and 133Xe half lives, so decay correction over the counting times was crucial. 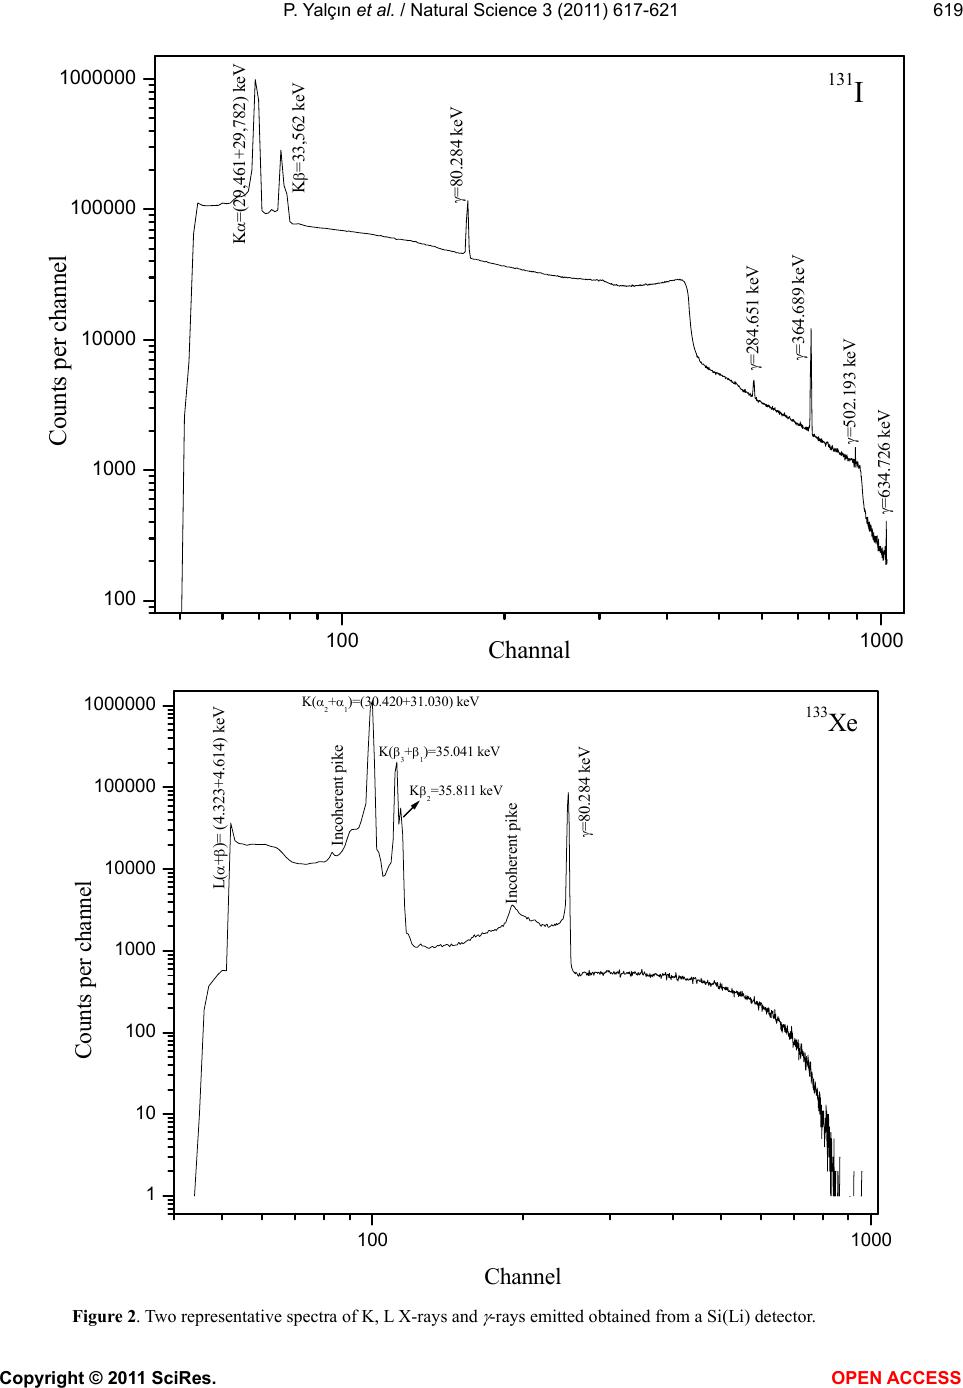 P. Yalçın et al. / Natural Science 3 (2011) 617-621 Copyright © 2011 SciRes. OPEN ACCESS 619 100 1000 100 1000 10000 100000 1000000 K =(29,461+29,782) keV =634.726 keV =502.193 keV =364.689 keV =284.651 keV =80.284 keV 131 I K =33,562 keV Counts per channel Channal 100 1000 1 10 100 1000 10000 100000 1000000 133Xe L( + )= (4.323+4.614) keV Incoherent pike Incoherent pike K =35.811 keV K( + )=(30.420+31.030) keV K( + )=35.041 keV =80.284 keV Counts per channel Channel Figure 2. Two representative spectra of K, L X-rays and -rays emitted obtained from a Si(Li) detector. 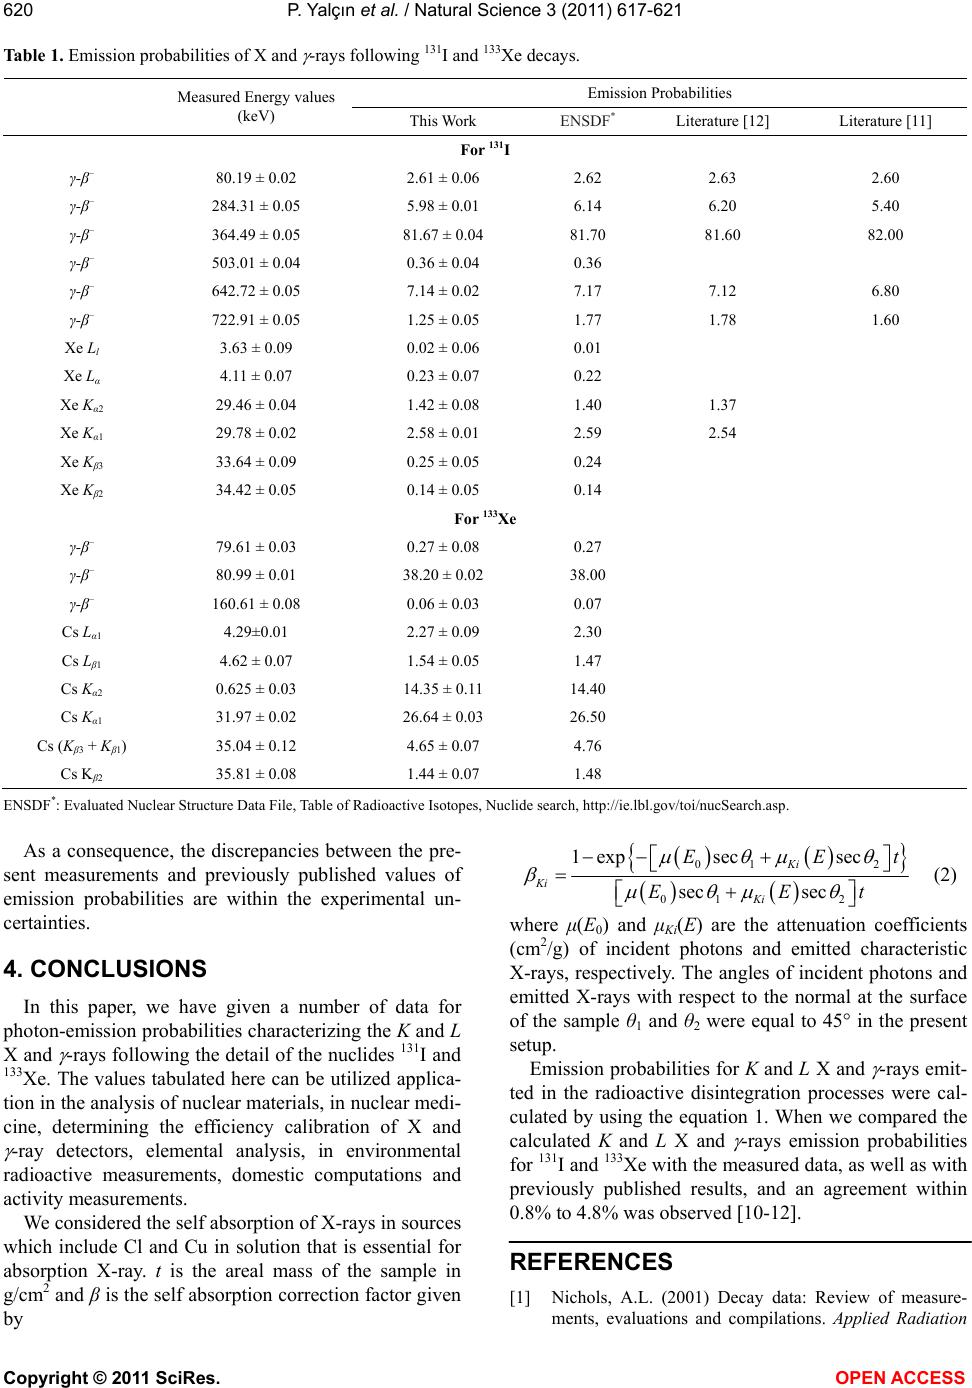 P. Yalçın et al. / Natural Science 3 (2011) 617-621 Copyright © 2011 SciRes. OPEN ACCESS 620 Table 1. Emission probabilities of X and -rays following 131I and 133Xe decays. Emission Probabilities Measured Energy values (keV) This Work ENSDF* Literature [12] Literature [11] For 131I γ-β– 80.19 ± 0.02 2.61 ± 0.06 2.62 2.63 2.60 γ-β– 284.31 ± 0.05 5.98 ± 0.01 6.14 6.20 5.40 γ-β– 364.49 ± 0.05 81.67 ± 0.04 81.70 81.60 82.00 γ-β– 503.01 ± 0.04 0.36 ± 0.04 0.36 γ-β– 642.72 ± 0.05 7.14 ± 0.02 7.17 7.12 6.80 γ-β– 722.91 ± 0.05 1.25 ± 0.05 1.77 1.78 1.60 Xe Ll 3.63 ± 0.09 0.02 ± 0.06 0.01 Xe Lα 4.11 ± 0.07 0.23 ± 0.07 0.22 Xe Kα2 29.46 ± 0.04 1.42 ± 0.08 1.40 1.37 Xe Kα1 29.78 ± 0.02 2.58 ± 0.01 2.59 2.54 Xe Kβ3 33.64 ± 0.09 0.25 ± 0.05 0.24 Xe Kβ2 34.42 ± 0.05 0.14 ± 0.05 0.14 For 133Xe γ-β– 79.61 ± 0.03 0.27 ± 0.08 0.27 γ-β– 80.99 ± 0.01 38.20 ± 0.02 38.00 γ-β– 160.61 ± 0.08 0.06 ± 0.03 0.07 Cs Lα1 4.29±0.01 2.27 ± 0.09 2.30 Cs Lβ1 4.62 ± 0.07 1.54 ± 0.05 1.47 Cs Kα2 0.625 ± 0.03 14.35 ± 0.11 14.40 Cs Kα1 31.97 ± 0.02 26.64 ± 0.03 26.50 Cs (Kβ3 + Kβ1) 35.04 ± 0.12 4.65 ± 0.07 4.76 Cs Kβ2 35.81 ± 0.08 1.44 ± 0.07 1.48 ENSDF*: Evaluated Nuclear Structure Data File, Table of Radioactive Isotopes, Nuclide search, http://ie.lbl.gov/toi/nucSearch.asp. As a consequence, the discrepancies between the pre- sent measurements and previously published values of emission probabilities are within the experimental un- certainties. 4. CONCLUSIONS In this paper, we have given a number of data for photon-emission probabilities characterizing the K and L X and -rays following the detail of the nuclides 131I and 133Xe. The values tabulated here can be utilized applica- tion in the analysis of nuclear materials, in nuclear medi- cine, determining the efficiency calibration of X and -ray detectors, elemental analysis, in environmental radioactive measurements, domestic computations and activity measurements. We considered the self absorption of X-rays in sources which include Cl and Cu in solution that is essential for absorption X-ray. t is the areal mass of the sample in g/cm2 and β is the self absorption correction factor given by 01 2 01 2 1exp secsec sec sec Ki Ki Ki EEt EEt (2) where μ(E0) and μKi(E) are the attenuation coefficients (cm2/g) of incident photons and emitted characteristic X-rays, respectively. The angles of incident photons and emitted X-rays with respect to the normal at the surface of the sample θ1 and θ2 were equal to 45° in the present setup. Emission probabilities for K and L X and -rays emit- ted in the radioactive disintegration processes were cal- culated by using the equation 1. When we compared the calculated K and L X and -rays emission probabilities for 131I and 133Xe with the measured data, as well as with previously published results, and an agreement within 0.8% to 4.8% was observed 10-12. REFERENCES [1] Nichols, A.L. (2001) Decay data: Review of measure- ments, evaluations and compilations. Applied Radiation  P. Yalçın et al. / Natural Science 3 (2011) 617-621 Copyright © 2011 SciRes. OPEN ACCESS 621 and Isotopes, 55, 23-70. doi:10.1016/S0969-8043(00)00382-1 [2] Birk, S., Kruuse, C., Petersen, K.A., Jonassen, O., Tfelt-Hansen, P. and Olesen, J. (2004) The phosphodi- esterase 3 inhibitor cilostazol dilates large cerebral arter- ies in humans without affecting regional cerebral blood flow. Journal of Cerebral Blood Flow & Metabolism, 24, 1352-1358. doi:10.1097/01.WCB.0000143536.22131.D7 [3] Miura, Y., Kanno, I., Miura, S., Hachiya, T., Hagami, E. and Uemura, K. (1981) Measurement of regional cerebral blood flow by 133Xe inhalation method-experimental system and its evaluation of data analysis by simulation study. Radioisotopes, 30, 92-98. [4] Monica, A.L., da Silva Maria, C.M., de Almeida Carlos, J. and da Silva Jose Delgado, U. (2004) Use of the refer- ence source method to determine the half-lives of ra- dionuclides of importance in nuclear medicine. Applied Radiation and Isotopes, 60, 301-305. doi:10.1016/j.apradiso.2003.11.032 [5] Sumithrarachchi, C.S., Rengan, K. and Griffin, H.C. (2003) Measurement of absolute gamma emission prob- abilities. Nuclear Instruments and Methods in Physics Research Section A, 505, 343-346. doi:10.1016/S0168-9002(03)01093-3 [6] Yalçın, P. and Kurucu, Y. (2005) Emission probabilities of K X- and g-rays following 51Cr and 67Ga decay. Ap- plied Radiation and Isotopes, 62, 63-67. doi:10.1016/j.apradiso.2004.05.078 [7] Yalçın, P., Sülün, A., Baştuğ, A., Kurucu, Y., Şahin, Y. (2005) The efficiency determination for Si(Li) detector in the 3-723 keV energy range. Canadian Journal of Ana- lytical Sciences and Spectroscopy, 50, 108-115. [8] Debertin, K. and Schötzig, U. (1977) Limitations of the pulser method for pile-up corrections in Ge(Li) spec- trometry. Nuclear Instruments and Methods in Physics Research Section A, 140, 337-344. doi:10.1016/0029-554X(77)90302-0 [9] Debertin, K. and Schötzig, U. (1979) Coincidence sum- ming corrections in Ge(Li) spectrometry at low source- -to-detector distances. Nuclear Instruments and Methods in Physics Research Section A, 158, 471-478. doi:10.1016/S0029-554X(79)94845-6 [10] Evaluated Nuclear Structure Data File (2011) http://ie.lbl.gov/toi/nucSearch.asp [11] Lederer, C.M., Hollander, J.M. and Primer, I. (1967) Table of isotopes. John Wiley & Sons, New-York. [12] Debertin, K. and Helmer, R.G. (1988) Gamma and X-ray spectrometry with semiconductor detectors. Elsevier Sci- ence, Amsterdam. |