

Paper Menu >>
Journal Menu >>
 American Journal of Molecular Biology, 2011, 1, 62-69 doi:10.4236/ajmb.2011.12008 Published Online July 2011 (http://www.SciRP.org/journal/ajmb/ AJMB ). Published Online July 2011 in SciRes. http://www.scirp.org/journal/AJMB Influence of anticancer drugs on DNA methylation in liver of female mice Shaden Muawia Hanafy1, Tarek Abd El-Raouf Salem1, Amal Ahmed Abd El-Aziz1, Bahgat Abd El-Ghafar El Fiky2, Mahmoud Abd El-Azeim Shokair1 1Molecular Biology Department, Genetic Engineering and Biotechnology Institute, Minufia University, Shibin El Kom, Egypt; 2Animal Biotechnology Department, Genetic Engineering and Biotechnology Institute, Minufia University, Shibin El Kom, Egypt. E-mail: [email protected] Received 18 March 2011; revised 16 May 2011; accepted 29 May 2011. ABSTRACT Epigenetic changes such as DNA methylation regu- late gene expression in normal development. Meth- otrexate and Adriamycine are antineoplastic drugs that target DNA and enzymes acting on DNA. We aimed to evaluate their cytotoxic effect on cell lines and on female mice to investigate the in vivo influ- ence of both drugs on the DNA methylation and sub- sequently the protein expression. The total level of DNA methylation showed a significant reduction from 62.2% to 36.7%, 36.6% as compared to control group, when using different doses of MTX and ADR. Hepatic protein pattern revealed five bands with low MW (16 - 6.1 KDa) in acute and LD50 doses. In con- clusion DNA methylation is influenced by anticancer drugs in a dose—dependent manner. Some specific protein fragments may be considered as a potential markers associated with high dose of anticancer drugs. Keywords: Epigenetic; DNA Methylation; Methotrexate (MTX); Adriamycine (ADR) 1. INTRODUCTION Cancer is uncontrolled growth of cells coupled with ma- lignant behavior; invasion and metastasis. It is thought to be caused by the interaction between genetic susceptibil- ity and environmental toxins. Most of chemotherapeutic drugs work by impairing mitosis and/or inducing apop- tosis. Several anticancer drugs target DNA or enzyme acting on the DNA [1]. The resistance of tumor cells to different antineoplastic agent is an obstacle for cancer chemotherapy. The main mechanism in drug resistance is the multi-drug resistance (MDR) phenomenon, which constitutes the reduction of intracellular drug level due to the P-glycoprotein pump function [2]. Drug develop- ment programs for identification of new cancer chemo- therapeutic agents involve extensive preclinical evalua- tion of vast numbers of chemicals for detection of anti- neoplastic activity. Animal models have always played an important role, and also cell culture systems have figured largely in the field of cancer chemotherapy, where the potential value of such systems for cytotoxic- ity and viability testing is now widely accepted [3]. Methotrexate (MTX)—is an antimetabolite and anti- folate drug which is used in treatment for many neoplas- tic disorders and some autoimmune diseases. It inhibits the synthesis of nucleic acids and subsequently proteins [4]. However, MTX, at certain dose, exhibited a toxic side effect to normal cells and organs in the body. Also, using of MTX for long period can increase the risk of toxicity [5]. Many studies proved the ability of MTX to inhibit dihydrofolate reductase enzyme (DHFR) which converts dihydrofolate to the active tetrahydrofolate compound which is essential for DNA methylation. [6]. Adryamycin (ADR) is an anthracycline isolated from streptomycin peucetius. It is commonly used in the treat- ment of a wide range of cancer including haematological malignancies, carcinomas, sarcomas and lymphomas. It prevents DNA replication by acting as topoisomerase inhibitor [7]. DNA methylation is a major biochemical modification, typically occurs at 5’-CpG (Cytosine-phosphate-guanine sites). They are regions have a higher GC content than the genome average and they may repress transcription [8]. In mammals, almost 60% of all promoters localize within CpG region. These regions are commonly devoid of methylation, while the rest have a methylation pattern and base composition indistinguishable from bulk DNA [9]. There is an inverse relationship between CpG me- thylation and transcriptional activity. Evidence that has  S. M. Hanafy et al. / American Journal of Molecular Biology 1 (2011) 62-69 63 accumulated in the past 10 years suggests that cancer cells usurp this physiologic mechanism and use it to their benefit by inactivating tumor suppressor genes leading to cancer progression. Hypomethylating agents or DNA methylation inhibitors could be used for the reversal of aberrant DNA methylation and therefore re- store the function of silenced genes in cancer causing growth arrest in tumor cells [10,11]. Upon these obser- vations, we designed this work to investigate the poten- tial activity of two common anticancer drugs, MTX and ADR as DNA hypomethylating agents that may lead to hyper expression of some genes associated with tumor suppression. 2. MATERIALS AND METHODES 2.1. Cell Lines and Cytotoxic Drugs Three different types of cell lines were used for in vitro study; human larynex carcinoma cell line (Hep2, ATCC No. CCL-23), human hepatocyte carcinoma cell line (HepG2, ATCC No. HB-8065) and monkey kidney cell line (Vero, ECACC No. 84113001). Cell lines were maintained and grown in RPMI culture medium supple- mented with 15% fetal bovine serum (FBS), 10 mmol/L HEPES, 1 mmol/L sodium pyruvate, 4.5 g/L glucose, 1.5 g/L sodium bicarbonate, and 5% penicillin/streptomycin (Reagents and chemicals were obtained from Sigma/Al- drich, USA). Two different chemotherapeutic drugs were used, methotrexate (10 mg/1ml; Ebewe Co. Italy) and adriamycin (2 mg/1ml; Pharmacia Co. Italy). Drugs were diluted in 0.9% physiological saline for 1X concentra- tion. 2.2. In-Vitro Cytotoxic Study Cells were seeded in 96-well flat-bottomed microtiter plates (100 µl/well) under complete aseptic condition and incubated in 5% CO2 incubator at 37˚C for 24 hr to reach complete monolayer. Serial dilutions of tested drugs were titrated in triplicate to the cells; in addition to the control wells that left without drugs. The plate was then incubated in 5% CO2 incubator at 37˚C for 24 hr and 72 hr to investigate the LD50 and cytopathic effect of the tested drugs. For recovery period bioassay, plates were incubated for 7 days in which growth medium was renewed every 2 days. 2.3. In-Vivo Cytotoxic Study The toxicity study was carried out using 70 female Balb/c mice weighing 20 - 25 g each. They were main- tained on animal cubes (Feeds Nigeria Ltd), provided with water ad libitum and were allowed to acclimatize to the laboratory conditions for seven days before the ex- periment. Three doses were selected for each drug ac- cording to LD50 determinaion on cell lines: For adria- mycine; 0.4, 0.04 and 0.004 mg/100g, BW for acute, LD50 and therapeutic dose, respectively. While, For metotrexate; 2, 0.2 and 0.02 mg/100g, BW for acute, LD50 and therapeutic dose, respectively. Animals were divided randomly into 7 groups (10 mice each), six groups of animals were injected subcutaneously with these dosese three times a week for 1 month. In addition, ten normal non-injected mice served as control. 2.4. Biochemical and Hematological Investingtions The serum activity of liver enzymes, ALT and AST, were determined according to the method of Reitman and Frankel [12]. Also, serum albumin [13], urea [14] and creatinine [15] were estimated. On the other hand, level of haemoglobin (Hb) and total leucocytic count [16] were determined. 2.5. Histopathological Examination At the end of experiment, animals were sacrificed by cervical dislocation. Liver, kidney and spleen were im- mediately excised and processed for histopathological examination. Briefly, paraffin sections of fixed tissues were cut in 5 µm thickness; stained with hematoxylin and eosin (H&E) and then examined microscopically. Histopathological changes were graded according to Portmann, et al. [17]. 2.6. SDS-PAGE for Hepatic Proteins Half gram of liver tissue was placed in ice-cold PBS, minced and homogenized by using Teflon-glass ho- mogenizer. The homogenates were spun and the clear supernatants were transferred into clean tube, the protein content was determined according to the method of Bradford [18]. Analysis of hepatic proteins was carried out by using SDS-polyacrylamide gel electrophoresis (SDS-PAGE) as described by Laemmli [19]. Briefly, total protein liver extracts (20 μg) from different groups of animals were loaded onto 15% polyacrylamide gel and subjected to 80 V for 30 minutes. At the end of mi- gration, gel was stained with Coomassie blue for 2 hr and then the excess of stain was removed by using gla- cial acetic acid for 4 hr. The gel was visualized by using white light and photographed. 2.7. Determination of Hepatic DNA Methylation Analysis Isolation of the mouse hepatic DNA was done by using DNeasy Tissue Kit (Qiagen, Germany). For restriction analysis, we used two enzymes—Msp I and Hpa II (Moraxella species and Haemophilus parainfluenzae, respectively, MBI, Fermentas, Lithuania). Both enzymes cut DNA in the sequence: C opyright © 2011 SciRes. AJMB 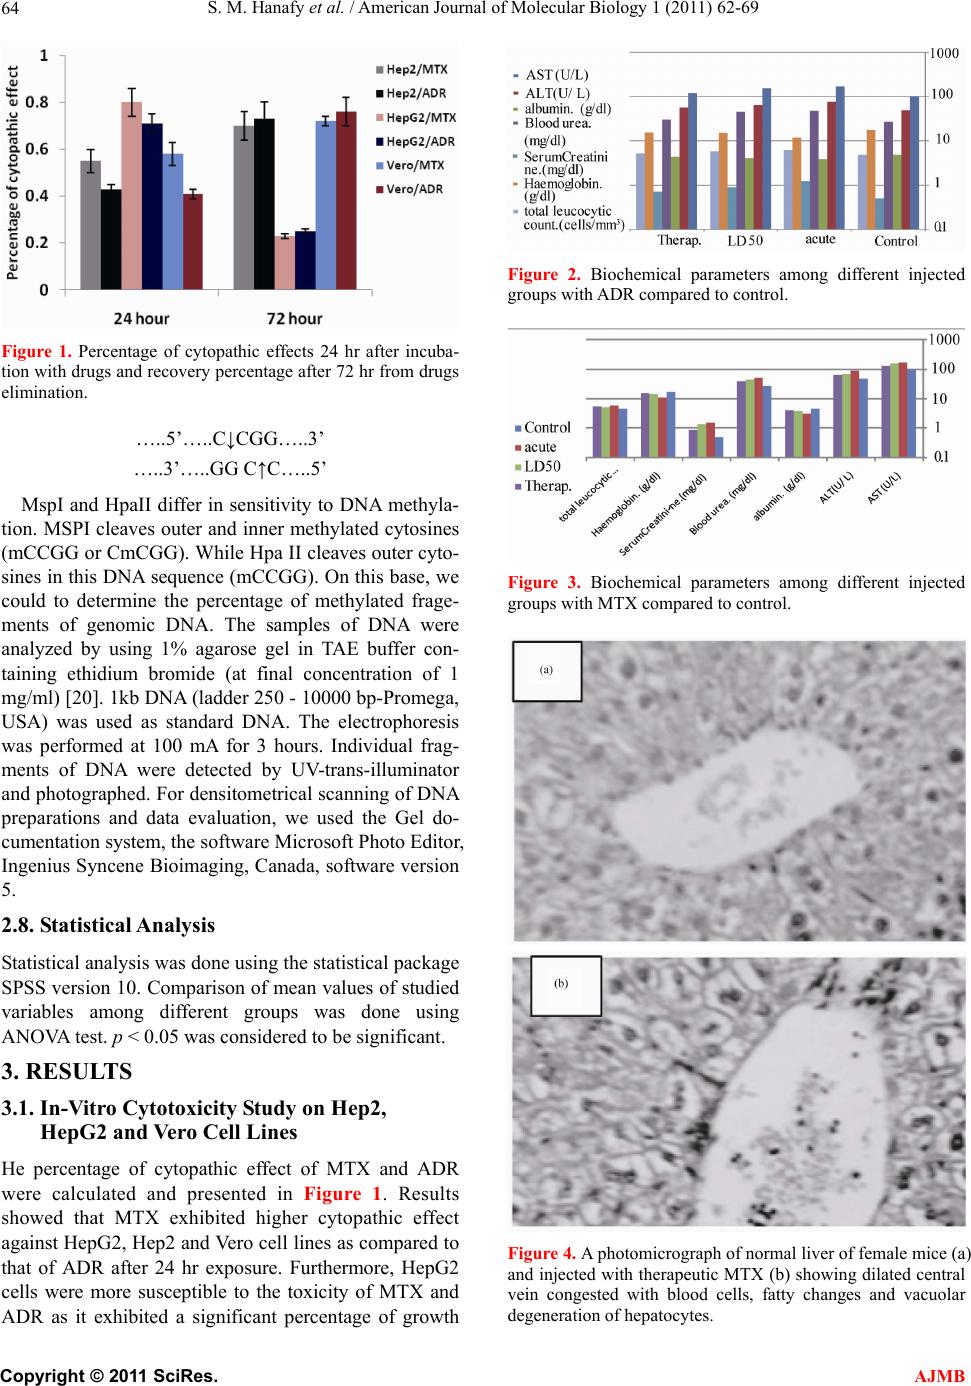 S. M. Hanafy et al. / American Journal of Molecular Biology 1 (2011) 62-69 64 Figure 1. Percentage of cytopathic effects 24 hr after incuba- tion with drugs and recovery percentage after 72 hr from drugs elimination. …..5’…..C↓CGG…..3’ …..3’…..GG C↑C…..5’ MspI and HpaII differ in sensitivity to DNA methyla- tion. MSPI cleaves outer and inner methylated cytosines (mCCGG or CmCGG). While Hpa II cleaves outer cyto- sines in this DNA sequence (mCCGG). On this base, we could to determine the percentage of methylated frage- ments of genomic DNA. The samples of DNA were analyzed by using 1% agarose gel in TAE buffer con- taining ethidium bromide (at final concentration of 1 mg/ml) [20]. 1kb DNA (ladder 250 - 10000 bp-Promega, USA) was used as standard DNA. The electrophoresis was performed at 100 mA for 3 hours. Individual frag- ments of DNA were detected by UV-trans-illuminator and photographed. For densitometrical scanning of DNA preparations and data evaluation, we used the Gel do- cumentation system, the software Microsoft Photo Editor, Ingenius Syncene Bioimaging, Canada, software version 5. 2.8. Statistical Analysis Statistical analysis was done using the statistical package SPSS version 10. Comparison of mean values of studied variables among different groups was done using ANOVA test. p < 0.05 was considered to be significant. 3. RESULTS 3.1. In-Vitro Cytotoxicity Study on Hep2, HepG2 and Vero Cell Lines He percentage of cytopathic effect of MTX and ADR were calculated and presented in Figure 1. Results showed that MTX exhibited higher cytopathic effect against HepG2, Hep2 and Vero cell lines as compared to that of ADR after 24 hr exposure. Furthermore, HepG2 cells were more susceptible to the toxicity of MTX and ADR as it exhibited a significant percentage of growth Figure 2. Biochemical parameters among different injected groups with ADR compared to control. Figure 3. Biochemical parameters among different injected groups with MTX compared to control. Figure 4. A photomicrograph of normal liver of female mice (a) and injected with therapeutic MTX (b) showing dilated central vein congested with blood cells, fatty changes and vacuolar degeneration of hepatocytes. C opyright © 2011 SciRes. AJMB 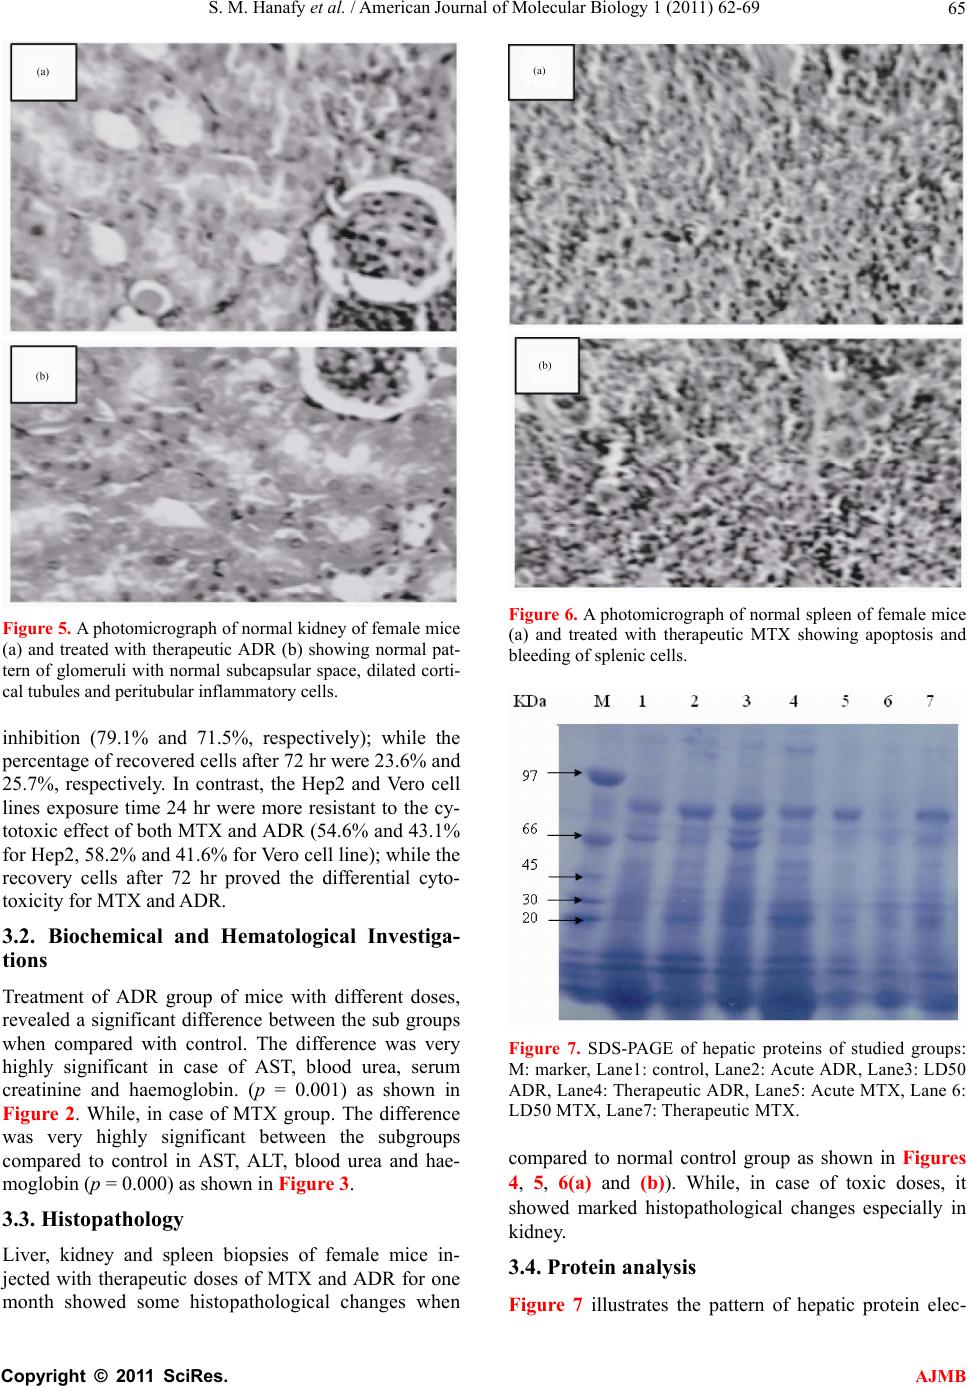 S. M. Hanafy et al. / American Journal of Molecular Biology 1 (2011) 62-69 65 Figure 5. A photomicrograph of normal kidney of female mice (a) and treated with therapeutic ADR (b) showing normal pat- tern of glomeruli with normal subcapsular space, dilated corti- cal tubules and peritubular inflammatory cells. inhibition (79.1% and 71.5%, respectively); while the percentage of recovered cells after 72 hr were 23.6% and 25.7%, respectively. In contrast, the Hep2 and Vero cell lines exposure time 24 hr were more resistant to the cy- totoxic effect of both MTX and ADR (54.6% and 43.1% for Hep2, 58.2% and 41.6% for Vero cell line); while the recovery cells after 72 hr proved the differential cyto- toxicity for MTX and ADR. 3.2. Biochemical and Hematological Investiga- tions Treatment of ADR group of mice with different doses, revealed a significant difference between the sub groups when compared with control. The difference was very highly significant in case of AST, blood urea, serum creatinine and haemoglobin. (p = 0.001) as shown in Figure 2. While, in case of MTX group. The difference was very highly significant between the subgroups compared to control in AST, ALT, blood urea and hae- moglobin (p = 0.000) as shown in Figure 3. 3.3. Histopathology Liver, kidney and spleen biopsies of female mice in- jected with therapeutic doses of MTX and ADR for one month showed some histopathological changes when Figure 6. A photomicrograph of normal spleen of female mice (a) and treated with therapeutic MTX showing apoptosis and bleeding of splenic cells. Figure 7. SDS-PAGE of hepatic proteins of studied groups: M: marker, Lane1: control, Lane2: Acute ADR, Lane3: LD50 ADR, Lane4: Therapeutic ADR, Lane5: Acute MTX, Lane 6: LD50 MTX, Lane7: Therapeutic MTX. compared to normal control group as shown in Figures 4, 5, 6(a) and (b)). While, in case of toxic doses, it showed marked histopathological changes especially in kidney. 3.4. Protein analysis Figure 7 illustrates the pattern of hepatic protein elec- C opyright © 2011 SciRes. AJMB 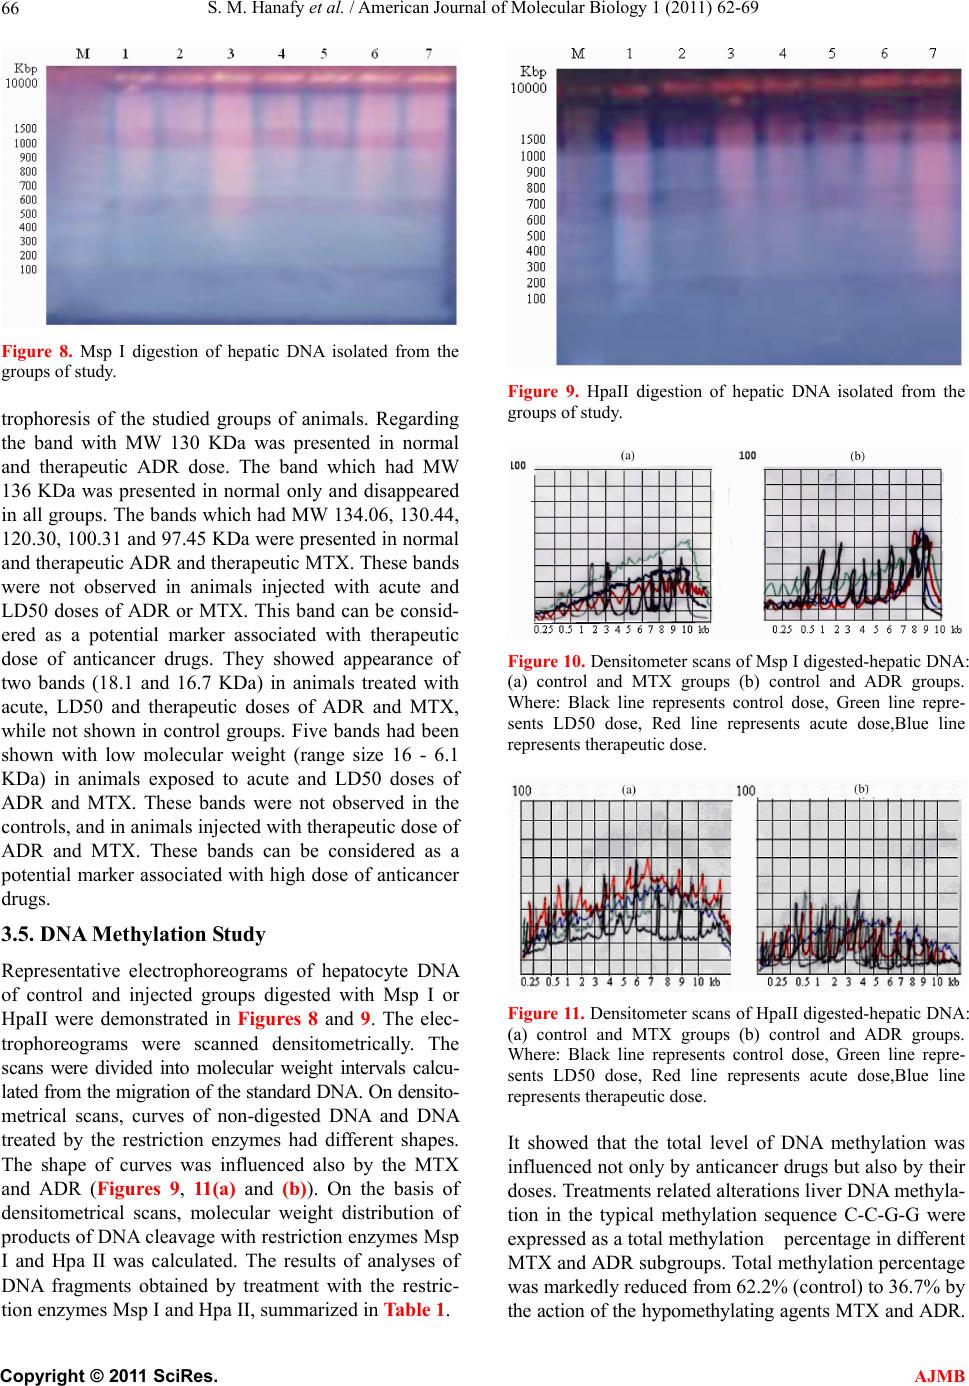 S. M. Hanafy et al. / American Journal of Molecular Biology 1 (2011) 62-69 66 Figure 8. Msp I digestion of hepatic DNA isolated from the groups of study. trophoresis of the studied groups of animals. Regarding the band with MW 130 KDa was presented in normal and therapeutic ADR dose. The band which had MW 136 KDa was presented in normal only and disappeared in all groups. The bands which had MW 134.06, 130.44, 120.30, 100.31 and 97.45 KDa were presented in normal and therapeutic ADR and therapeutic MTX. These bands were not observed in animals injected with acute and LD50 doses of ADR or MTX. This band can be consid- ered as a potential marker associated with therapeutic dose of anticancer drugs. They showed appearance of two bands (18.1 and 16.7 KDa) in animals treated with acute, LD50 and therapeutic doses of ADR and MTX, while not shown in control groups. Five bands had been shown with low molecular weight (range size 16 - 6.1 KDa) in animals exposed to acute and LD50 doses of ADR and MTX. These bands were not observed in the controls, and in animals injected with therapeutic dose of ADR and MTX. These bands can be considered as a potential marker associated with high dose of anticancer drugs. 3.5. DNA Methylation Study Representative electrophoreograms of hepatocyte DNA of control and injected groups digested with Msp I or HpaII were demonstrated in Figures 8 and 9. The elec- trophoreograms were scanned densitometrically. The scans were divided into molecular weight intervals calcu- lated from the migration of the standard DNA. On densito- metrical scans, curves of non-digested DNA and DNA treated by the restriction enzymes had different shapes. The shape of curves was influenced also by the MTX and ADR (Figures 9, 11(a) and (b)). On the basis of densitometrical scans, molecular weight distribution of products of DNA cleavage with restriction enzymes Msp I and Hpa II was calculated. The results of analyses of DNA fragments obtained by treatment with the restric- tion enzymes Msp I and Hpa II, summarized in Table 1. Figure 9. HpaII digestion of hepatic DNA isolated from the groups of study. Figure 10. Densitometer scans of Msp I digested-hepatic DNA: (a) control and MTX groups (b) control and ADR groups. Where: Black line represents control dose, Green line repre- sents LD50 dose, Red line represents acute dose,Blue line represents therapeutic dose. Figure 11. Densitometer scans of HpaII digested-hepatic DNA: (a) control and MTX groups (b) control and ADR groups. Where: Black line represents control dose, Green line repre- sents LD50 dose, Red line represents acute dose,Blue line represents therapeutic dose. It showed that the total level of DNA methylation was influenced not only by anticancer drugs but also by their doses. Treatments related alterations liver DNA methyla- tion in the typical methylation sequence C-C-G-G were expressed as a total methylation percentage in different MTX and ADR subgroups. Total methylation percentage was markedly reduced from 62.2% (control) to 36.7% by the action of the hypomethylating agents MTX and ADR. C opyright © 2011 SciRes. AJMB 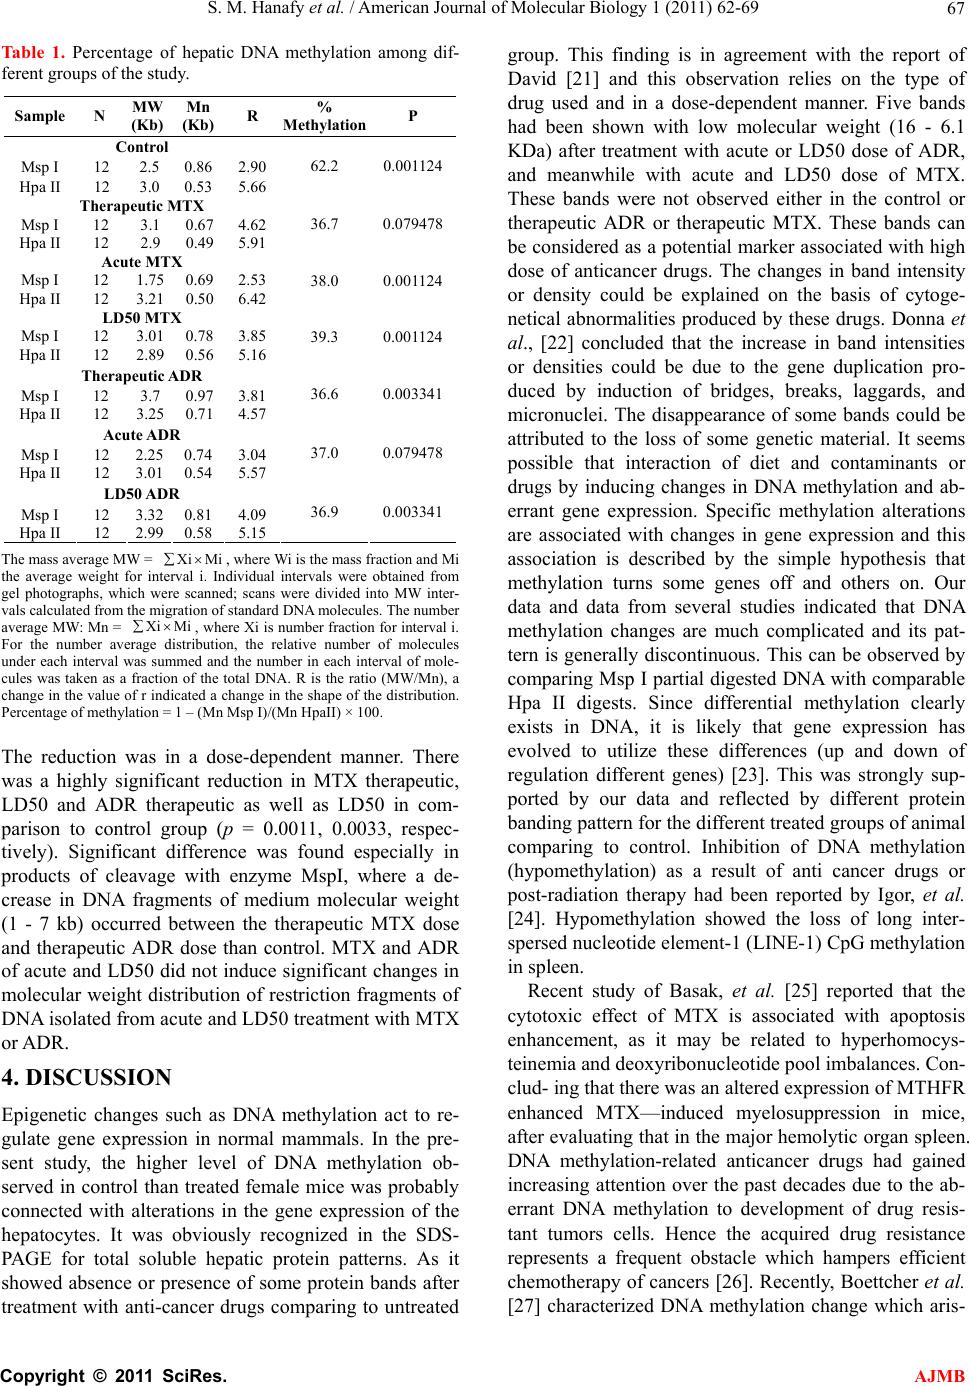 S. M. Hanafy et al. / American Journal of Molecular Biology 1 (2011) 62-69 67 Table 1. Percentage of hepatic DNA methylation among dif- ferent groups of the study. Sample N MW (Kb) Mn (Kb) R % Methylation P Control Msp I 12 2.5 0.86 2.90 Hpa II 12 3.0 0.53 5.66 62.2 0.001124 Therapeutic MTX Msp I 12 3.1 0.67 4.62 Hpa II 12 2.9 0.49 5.91 36.7 0.079478 Acute MTX Msp I 12 1.75 0.69 2.53 Hpa II 12 3.21 0.50 6.42 38.0 0.001124 LD50 MTX Msp I 12 3.01 0.78 3.85 Hpa II 12 2.89 0.56 5.16 39.3 0.001124 Therapeutic ADR Msp I 12 3.7 0.97 3.81 Hpa II 12 3.25 0.71 4.57 36.6 0.003341 Acute ADR Msp I 12 2.25 0.74 3.04 Hpa II 12 3.01 0.54 5.57 37.0 0.079478 LD50 ADR Msp I 12 3.32 0.81 4.09 Hpa II 12 2.99 0.58 5.15 36.9 0.003341 The mass average MW = , where Wi is the mass fraction and Mi the average weight for interval i. Individual intervals were obtained from gel photographs, which were scanned; scans were divided into MW inter- vals calculated from the migration of standard DNA molecules. The number average MW: Mn = , where Xi is number fraction for interval i. For the number average distribution, the relative number of molecules under each interval was summed and the number in each interval of mole- cules was taken as a fraction of the total DNA. R is the ratio (MW/Mn), a change in the value of r indicated a change in the shape of the distribution. Percentage of methylation = 1 – (Mn Msp I)/(Mn HpaII) × 100. Xi Mi Xi Mi The reduction was in a dose-dependent manner. There was a highly significant reduction in MTX therapeutic, LD50 and ADR therapeutic as well as LD50 in com- parison to control group (p = 0.0011, 0.0033, respec- tively). Significant difference was found especially in products of cleavage with enzyme MspI, where a de- crease in DNA fragments of medium molecular weight (1 - 7 kb) occurred between the therapeutic MTX dose and therapeutic ADR dose than control. MTX and ADR of acute and LD50 did not induce significant changes in molecular weight distribution of restriction fragments of DNA isolated from acute and LD50 treatment with MTX or ADR. 4. DISCUSSION Epigenetic changes such as DNA methylation act to re- gulate gene expression in normal mammals. In the pre- sent study, the higher level of DNA methylation ob- served in control than treated female mice was probably connected with alterations in the gene expression of the hepatocytes. It was obviously recognized in the SDS- PAGE for total soluble hepatic protein patterns. As it showed absence or presence of some protein bands after treatment with anti-cancer drugs comparing to untreated group. This finding is in agreement with the report of David [21] and this observation relies on the type of drug used and in a dose-dependent manner. Five bands had been shown with low molecular weight (16 - 6.1 KDa) after treatment with acute or LD50 dose of ADR, and meanwhile with acute and LD50 dose of MTX. These bands were not observed either in the control or therapeutic ADR or therapeutic MTX. These bands can be considered as a potential marker associated with high dose of anticancer drugs. The changes in band intensity or density could be explained on the basis of cytoge- netical abnormalities produced by these drugs. Donna et al., [22] concluded that the increase in band intensities or densities could be due to the gene duplication pro- duced by induction of bridges, breaks, laggards, and micronuclei. The disappearance of some bands could be attributed to the loss of some genetic material. It seems possible that interaction of diet and contaminants or drugs by inducing changes in DNA methylation and ab- errant gene expression. Specific methylation alterations are associated with changes in gene expression and this association is described by the simple hypothesis that methylation turns some genes off and others on. Our data and data from several studies indicated that DNA methylation changes are much complicated and its pat- tern is generally discontinuous. This can be observed by comparing Msp I partial digested DNA with comparable Hpa II digests. Since differential methylation clearly exists in DNA, it is likely that gene expression has evolved to utilize these differences (up and down of regulation different genes) [23]. This was strongly sup- ported by our data and reflected by different protein banding pattern for the different treated groups of animal comparing to control. Inhibition of DNA methylation (hypomethylation) as a result of anti cancer drugs or post-radiation therapy had been reported by Igor, et al. [24]. Hypomethylation showed the loss of long inter- spersed nucleotide element-1 (LINE-1) CpG methylation in spleen. Recent study of Basak, et al. [25] reported that the cytotoxic effect of MTX is associated with apoptosis enhancement, as it may be related to hyperhomocys- teinemia and deoxyribonucleotide pool imbalances. Con- clud- ing that there was an altered expression of MTHFR enhanced MTX—induced myelosuppression in mice, after evaluating that in the major hemolytic organ spleen. DNA methylation-related anticancer drugs had gained increasing attention over the past decades due to the ab- errant DNA methylation to development of drug resis- tant tumors cells. Hence the acquired drug resistance represents a frequent obstacle which hampers efficient chemotherapy of cancers [26]. Recently, Boettcher et al. [27] characterized DNA methylation change which aris- C opyright © 2011 SciRes. AJMB 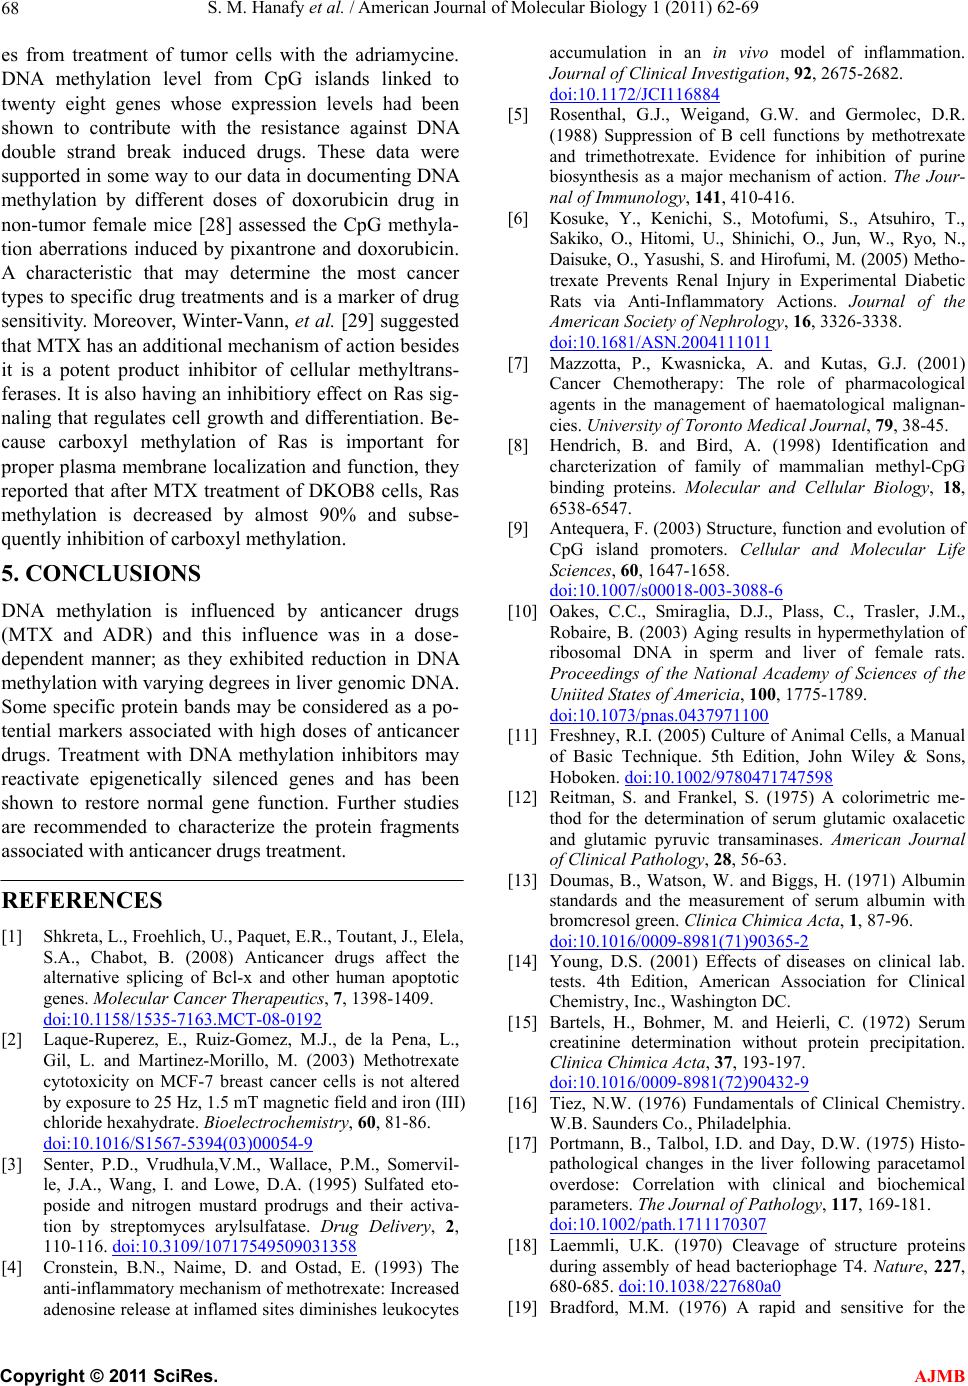 S. M. Hanafy et al. / American Journal of Molecular Biology 1 (2011) 62-69 68 es from treatment of tumor cells with the adriamycine. DNA methylation level from CpG islands linked to twenty eight genes whose expression levels had been shown to contribute with the resistance against DNA double strand break induced drugs. These data were supported in some way to our data in documenting DNA methylation by different doses of doxorubicin drug in non-tumor female mice [28] assessed the CpG methyla- tion aberrations induced by pixantrone and doxorubicin. A characteristic that may determine the most cancer types to specific drug treatments and is a marker of drug sensitivity. Moreover, Winter-Vann, et al. [29] suggested that MTX has an additional mechanism of action besides it is a potent product inhibitor of cellular methyltrans- ferases. It is also having an inhibitiory effect on Ras sig- naling that regulates cell growth and differentiation. Be- cause carboxyl methylation of Ras is important for proper plasma membrane localization and function, they reported that after MTX treatment of DKOB8 cells, Ras methylation is decreased by almost 90% and subse- quently inhibition of carboxyl methylation. 5. CONCLUSIONS DNA methylation is influenced by anticancer drugs (MTX and ADR) and this influence was in a dose- dependent manner; as they exhibited reduction in DNA methylation with varying degrees in liver genomic DNA. Some specific protein bands may be considered as a po- tential markers associated with high doses of anticancer drugs. Treatment with DNA methylation inhibitors may reactivate epigenetically silenced genes and has been shown to restore normal gene function. Further studies are recommended to characterize the protein fragments associated with anticancer drugs treatment. REFERENCES [1] Shkreta, L., Froehlich, U., Paquet, E.R., Toutant, J., Elela, S.A., Chabot, B. (2008) Anticancer drugs affect the alternative splicing of Bcl-x and other human apoptotic genes. Molecular Cancer Therapeutics, 7, 1398-1409. doi:10.1158/1535-7163.MCT-08-0192 [2] Laque-Ruperez, E., Ruiz-Gomez, M.J., de la Pena, L., Gil, L. and Martinez-Morillo, M. (2003) Methotrexate cytotoxicity on MCF-7 breast cancer cells is not altered by exposure to 25 Hz, 1.5 mT magnetic field and iron (III) chloride hexahydrate. Bioelectrochemistry, 60, 81-86. doi:10.1016/S1567-5394(03)00054-9 [3] Senter, P.D., Vrudhula,V.M., Wallace, P.M., Somervil- le, J.A., Wang, I. and Lowe, D.A. (1995) Sulfated eto- poside and nitrogen mustard prodrugs and their activa- tion by streptomyces arylsulfatase. Drug Delivery, 2, 110-116. doi:10.3109/10717549509031358 [4] Cronstein, B.N., Naime, D. and Ostad, E. (1993) The anti-inflammatory mechanism of methotrexate: Increased adenosine release at inflamed sites diminishes leukocytes accumulation in an in vivo model of inflammation. Journal of Clinical Investigation, 92, 2675-2682. doi:10.1172/JCI116884 [5] Rosenthal, G.J., Weigand, G.W. and Germolec, D.R. (1988) Suppression of B cell functions by methotrexate and trimethotrexate. Evidence for inhibition of purine biosynthesis as a major mechanism of action. The Jour- nal of Immunology, 141, 410-416. [6] Kosuke, Y., Kenichi, S., Motofumi, S., Atsuhiro, T., Sakiko, O., Hitomi, U., Shinichi, O., Jun, W., Ryo, N., Daisuke, O., Yasushi, S. and Hirofumi, M. (2005) Metho- trexate Prevents Renal Injury in Experimental Diabetic Rats via Anti-Inflammatory Actions. Journal of the American Society of Nephrology, 16, 3326-3338. doi:10.1681/ASN.2004111011 [7] Mazzotta, P., Kwasnicka, A. and Kutas, G.J. (2001) Cancer Chemotherapy: The role of pharmacological agents in the management of haematological malignan- cies. University of Toronto Medical Journal, 79, 38-45. [8] Hendrich, B. and Bird, A. (1998) Identification and charcterization of family of mammalian methyl-CpG binding proteins. Molecular and Cellular Biology, 18, 6538-6547. [9] Antequera, F. (2003) Structure, function and evolution of CpG island promoters. Cellular and Molecular Life Sciences, 60, 1647-1658. doi:10.1007/s00018-003-3088-6 [10] Oakes, C.C., Smiraglia, D.J., Plass, C., Trasler, J.M., Robaire, B. (2003) Aging results in hypermethylation of ribosomal DNA in sperm and liver of female rats. Proceedings of the National Academy of Sciences of the Uniited States of Americia, 100, 1775-1789. doi:10.1073/pnas.0437971100 [11] Freshney, R.I. (2005) Culture of Animal Cells, a Manual of Basic Technique. 5th Edition, John Wiley & Sons, Hoboken. doi:10.1002/9780471747598 [12] Reitman, S. and Frankel, S. (1975) A colorimetric me- thod for the determination of serum glutamic oxalacetic and glutamic pyruvic transaminases. American Journal of Clinical Pathology, 28, 56-63. [13] Doumas, B., Watson, W. and Biggs, H. (1971) Albumin standards and the measurement of serum albumin with bromcresol green. Clinica Chimica Acta, 1, 87-96. doi:10.1016/0009-8981(71)90365-2 [14] Young, D.S. (2001) Effects of diseases on clinical lab. tests. 4th Edition, American Association for Clinical Chemistry, Inc., Washington DC. [15] Bartels, H., Bohmer, M. and Heierli, C. (1972) Serum creatinine determination without protein precipitation. Clinica Chimica Acta, 37, 193-197. doi:10.1016/0009-8981(72)90432-9 [16] Tiez, N.W. (1976) Fundamentals of Clinical Chemistry. W.B. Saunders Co., Philadelphia. [17] Portmann, B., Talbol, I.D. and Day, D.W. (1975) Histo- pathological changes in the liver following paracetamol overdose: Correlation with clinical and biochemical parameters. The Journal of Pathology, 117, 169-181. doi:10.1002/path.1711170307 [18] Laemmli, U.K. (1970) Cleavage of structure proteins during assembly of head bacteriophage T4. Nature, 227, 680-685. doi:10.1038/227680a0 [19] Bradford, M.M. (1976) A rapid and sensitive for the C opyright © 2011 SciRes. AJMB  S. M. Hanafy et al. / American Journal of Molecular Biology 1 (2011) 62-69 Copyright © 2011 SciRes. 69 AJMB quantitation of microgram quantitites of protein utilizing the principle of protein-dye binding. Analytical Bioche- mistry, 72, 248-254. doi:10.1016/0003-2697(76)90527-3 [20] Sambrook, J., Fritch, E. and Maniatis, T. (1989) Mole- cular cloning: A laboratory manual (DNA methylation). Cold Spring Harbor Lab. Press, 5, 1-35. [21] David, G. (2001) Chromosomal instability in cancer- causes and consequenes of genetics and cytogeneticsin. Oncology and Haematology, 1, 13. [22] Donna, G., Albertson, C., Frank, C., Mcormick, F. and Gray, G.W. (2003) Chromosomeaberration in solid tu- mors. Nature Genetics, 34, 369-376. [23] Kozurkova, M., Letavayova, L. and Misrurova, E. (2007) Influence of gamma irradiation on DNA methylation in liver of male rats and their offspring. Acta Veterinaria Brasilica, 76, 215-222. doi:10.2754/avb200776020215 [24] Igor, K., Bokyo, A., Juarez, R.R., Mcdonald, R.J., Tryn- dyak, V.P., Kovalchuk, I., Pogribny, I.P. and Kovalchuk, O. (2007) Role of epigenetic effectors in maintenance of the long-term persistent bystander effect in spleen in vivo. Carcinogenesis, 28, 1831-1838. doi:10.1093/carcin/bgm053 [25] Basak, C., Andeerea, K.L., Qing, W. and Rima, R. (2009) Methotrexate-induced apoptosis is enhanced by alterd expression of methylenetetrahydrofolate reductase. Anti- Cancer Drugs, 20, 787-793. doi:10.1097/CAD.0b013e32832f4aa8 [26] Viller-Garea, A. (2003) Procaine is a DNA-demethylat- ing agent with growth-inhibitory effects in human cancer cell. Cancer Resarch, 63, 4948-4989. [27] Boettcher, M., Kischkel, F. and Hoheisel, J.D. (2010) High-definition DNA methylation profiles from breast and ovarian carcinoma cell lines with differing doxorubi- cin resistance. PLoS ONE, 5, Article ID e11002. [28] Evison, B.J., Bilard, R.A., Chiu, F.C.K., Pezzoni, G., Phillips, D.R. and Cutts, S.M. (2009) CpG methylation potentiates pixantrone and doxorubicin-induced DNA damage and is a marker of drug sensitivity. Life Sciences, 37, 6355-6370. [29] Winter-Vann, A.M., Kamen, B.A., Bergo, M.O., Young, S.G., Melenyk, S., James, S.J. and Casey, P.J. (2003) Targeting Ras signaling through inhibition of carboxyl methylation:anunexpected properity of methotrexate. Proceedings of the National Academy of Sciences of the Uniited States of Americia, 100, 6529-6234. doi:10.1073/pnas.1135239100 |