

Paper Menu >>
Journal Menu >>
 Engineering, 2009, 2, 106-110 doi:10.4236/eng.2009.12012 Published Online August 2009 (http://www.SciRP.org/journal/eng/). Copyright © 2009 SciRes. ENGINEERING Application of PPC Model Based on RAGA in Real Estate Investment Decision-Making Shujing ZHOU, Fei WANG, Yancang LI College of Civil Engineering, Hebei University of Engineering, Handan, China Email: [email protected], telasi@163.com, liyancang@163.com Received May 17, 2009; revised June 26, 2009; accepted July 5, 2009 Abstract According to the size of the projector function to evaluate the merits of the program, Projection Pursuit method is applied to real estate investment decision-making by using the real coding based on Accelerating Genetic Algorithm (RAGA) to optimize the Projection Pursuit Classification (PPC) process and a wide range of indicators value was projected linearly. The results are reasonable and verified with an example. At the same time, the subjective of the target weight can be avoided. It provides decision-makers with comprehen- sive information on all the indicators of new ideas and new methods Key words: Real Estate, PPC Model, Investment Decision-Making, Accelerating Genetic Algorithm 1. Introduction The real estate industry is now one of the major pillar industries of economic development in the world. Due to the late start of our country’s real estate economy, in- vestment decision-making theory is not perfect in the study—how to program in a multi-selection process, to avoid the subjective factors on the impact of real estate investment decision-making so as to achieve the best overall efficiency of the purpose of the program. At pre- sent, on the real estate investment decision-making, there are two commonly used methods. The first mainly is single-objective decision-making, respectively, in Net Present Value (NPV), Internal Rate of Return (IRR), Pay- back Period (Pt), such as a single evaluation index [1]. Although the method is convenient, simple, and easy to understand, it’s not a comprehensive reflection of the merits of the project. Another method is multi-objective decision-making method which includes Analytic Hier- archy Process (AHP) [2,3] and Fuzzy Comprehensive Evaluation methods [4]. Calculation of these methods is more complex, and the determination of weight for greater subjectivity in the practical application is more inconvenient and not objective enough. In order to avoid the weighing of the subjective in computational process, this paper introduces a Projection Pursuit Classification model to the real estate investment decision-making to achieve the dimensionality reduction process of multi-index high-dimensional data which could evaluate real estate investment plan in many fields and join the RAGA suitably for multi-dimensional global optimiza- tion with the PPC model. 2. Methodology of PP Projection Pursuit is used to analyze high-dimensional data, in particular the non-normal nonlinear analysis of high dimensional data as a statistical method [5-7]. It is imitated by the experienced workers of data analysis by Friedman and Tukey (1974) who put forward the whole spread to the extent and degree of local cohesion com- bining to make a new index for clustering and classifica- tion analysis. Projection Pursuit method can overcome the success of high-dimensional data—“dimension curse”, which is brought about by serious difficulties. It is because that its analysis of the data in the low-dimen- sional subspace conducted for 1 to 3-dimensional projec- tion space data points is dense enough, and sufficient data in the projection space can be found in the structure or characteristics. It can exclude from the interference of the variables which have nothing to do with the data structure and characteristics or the relationship between 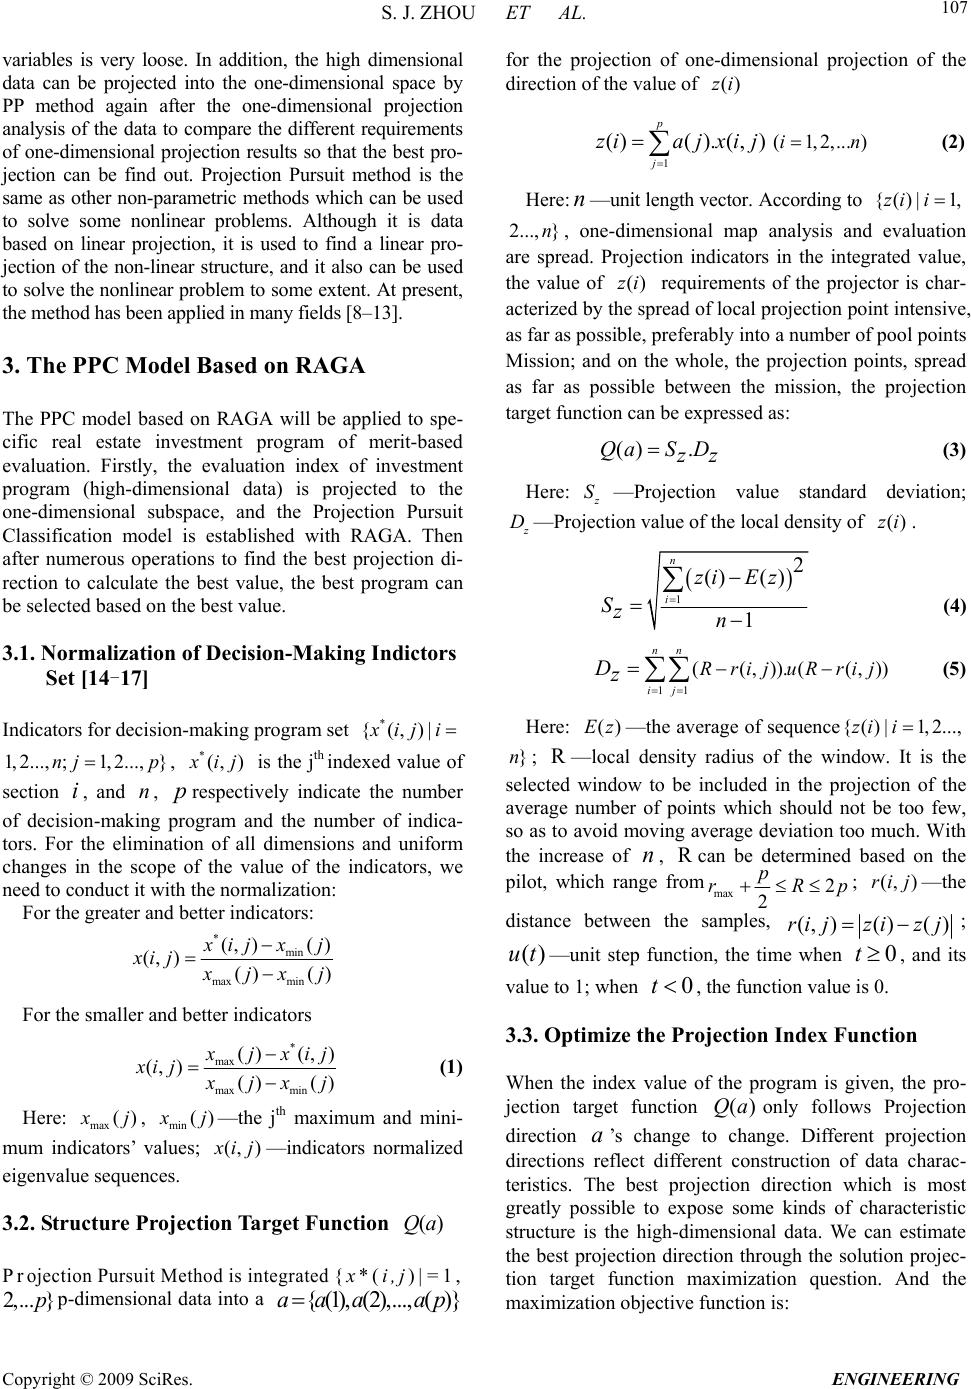 S. J. ZHOU ET AL. Copyright © 2009 SciRes. ENGINEERING 107 variables is very loose. In addition, the high dimensional data can be projected into the one-dimensional space by PP method again after the one-dimensional projection analysis of the data to compare the different requirements of one-dimensional projection results so that the best pro- jection can be find out. Projection Pursuit method is the same as other non-parametric methods which can be used to solve some nonlinear problems. Although it is data based on linear projection, it is used to find a linear pro- jection of the non-linear structure, and it also can be used to solve the nonlinear problem to some extent. At present, the method has been applied in many fields [8–13]. 3. The PPC Model Based on RAGA The PPC model based on RAGA will be applied to spe- cific real estate investment program of merit-based evaluation. Firstly, the evaluation index of investment program (high-dimensional data) is projected to the one-dimensional subspace, and the Projection Pursuit Classification model is established with RAGA. Then after numerous operations to find the best projection di- rection to calculate the best value, the best program can be selected based on the best value. 3.1. Normalization of Decision-Making Indictors Set [14-17] Indicators for decision-making program set * {(,)| x ij i 1, 2...,;1, 2...,}nj p, *(, ) x ij is the jth indexed value of section , and , in p respectively indicate the number of decision-making program and the number of indica- tors. For the elimination of all dimensions and uniform changes in the scope of the value of the indicators, we need to conduct it with the normalization: For the greater and better indicators: * min max min (,)( ) (, )() () x ij xj xi j x jx j For the smaller and better indicators * max max min () (,) (, )() () x jxij xi j x jx j (1) Here: max () x j, min() x j—the jth maximum and mini- mum indicators’ values; (, ) x ij—indicators normalized eigenvalue sequences. 3.2. Structure Projection Target Function ()Qa Pr ojection Pursuit Method is integrated {x*(i,j)|=1, 2,... }pp-dimensional data into a {(1),(2),..., ()}aaa ap for the projection of one-dimensional projection of the direction of the value of ()zi 1 ()(). (,) p j zia jxi j (1,2,...)in (2) Here: —unit length vector. According to n{()|1,zii 2..., }n, one-dimensional map analysis and evaluation are spread. Projection indicators in the integrated value, the value of requirements of the projector is char- acterized by the spread of local projection point intensive, as far as possible, preferably into a number of pool points Mission; and on the whole, the projection points, spread as far as possible between the mission, the projection target function can be expressed as: ()zi () .QaS D zz (3) Here: z S—Projection value standard deviation; z D—Projection value of the local density of . ()zi 1 2 ()( ) 1 n i zi Ez Szn (4) 11 ((,)).((,) nn ij RrijuRrijDz ) (5) Here: —the average of sequence{(()Ez )|1,2...,zi i }n; —local density radius of the window. It is the selected window to be included in the projection of the average number of points which should not be too few, so as to avoid moving average deviation too much. With the increase of , can be determined based on the pilot, which range from R nR max 2 2 p rRp (, )ri j ; —the distance between the samples, (, )()zi z 0 ( )ri jj; —unit step function, the time when , and its value to 1; when (ut)t 0t , the function value is 0. 3.3. Optimize the Projection Index Function When the index value of the program is given, the pro- jection target function only follows Projection direction ’s change to change. Different projection directions reflect different construction of data charac- teristics. The best projection direction which is most greatly possible to expose some kinds of characteristic structure is the high-dimensional data. We can estimate the best projection direction through the solution projec- tion target function maximization question. And the maximization objective function is: ()Qa a 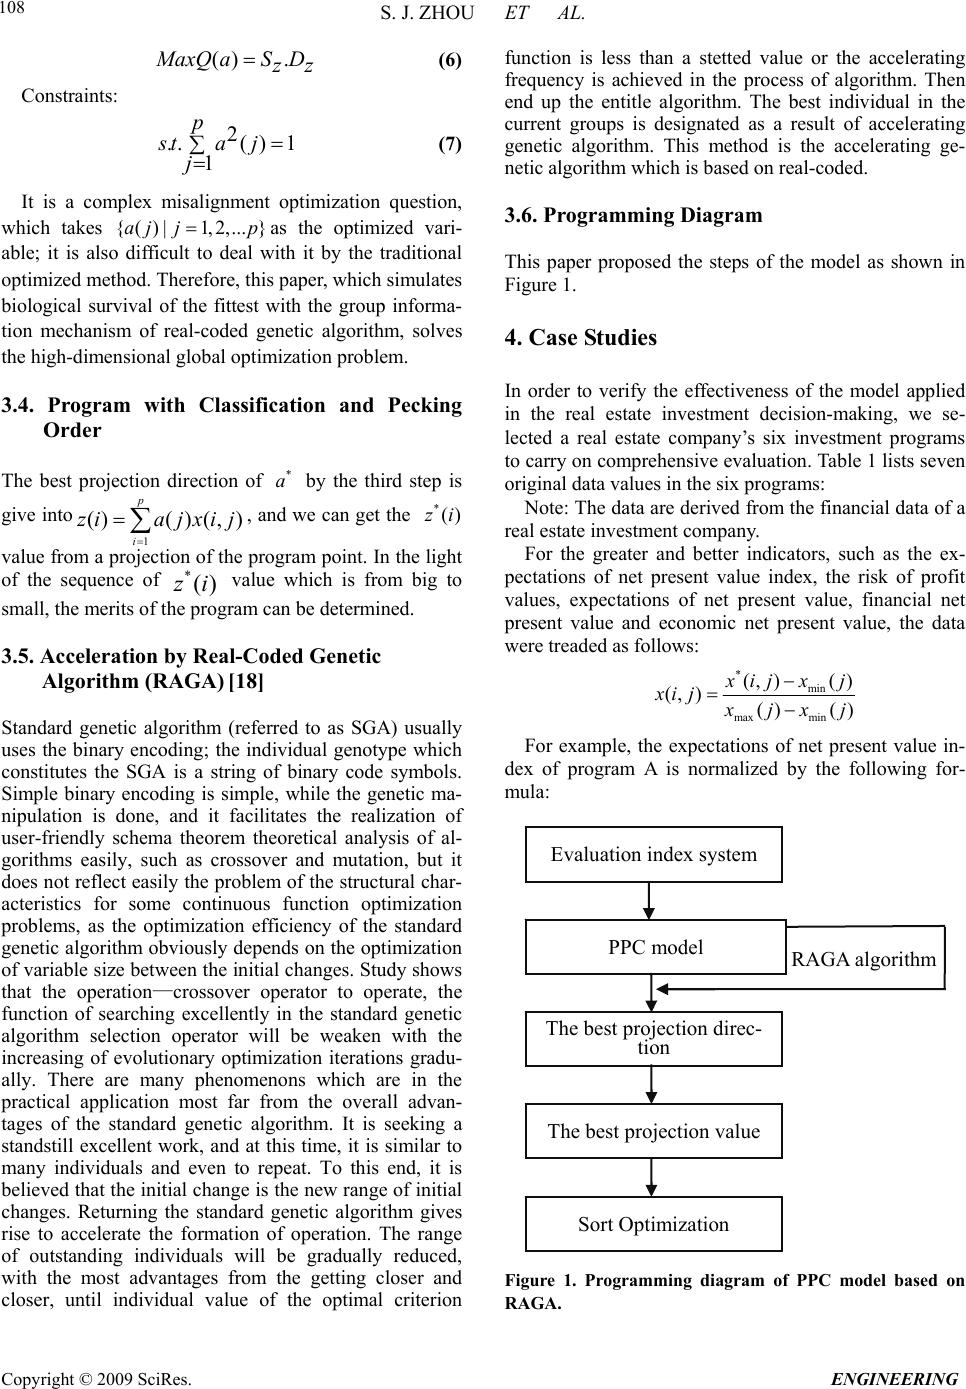 S. J. ZHOU ET AL. Copyright © 2009 SciRes. ENGINEERING 108 () . M axQ aSD zz (6) Constraints: 2 ..()1 1 p sta j j (7) It is a complex misalignment optimization question, which takes {as the optimized vari- able; it is also difficult to deal with it by the traditional optimized method. Therefore, this paper, which simulates biological survival of the fittest with the group informa- tion mechanism of real-coded genetic algorithm, solves the high-dimensional global optimization problem. ()|1, 2,...}aj jp 3.4. Program with Classification and Pecking Order The best projection direction of by the third step is give into 1 * a ()( ) (,) p i zia jxi j *()zi , and we can get the value from a projection of the program point. In the light of the sequence of value which is from big to small, the merits of the program can be determined. *()zi 3.5. Acceleration by Real-Coded Genetic Algorithm (RAGA) [18] Standard genetic algorithm (referred to as SGA) usually uses the binary encoding; the individual genotype which constitutes the SGA is a string of binary code symbols. Simple binary encoding is simple, while the genetic ma- nipulation is done, and it facilitates the realization of user-friendly schema theorem theoretical analysis of al- gorithms easily, such as crossover and mutation, but it does not reflect easily the problem of the structural char- acteristics for some continuous function optimization problems, as the optimization efficiency of the standard genetic algorithm obviously depends on the optimization of variable size between the initial changes. Study shows that the operation—crossover operator to operate, the function of searching excellently in the standard genetic algorithm selection operator will be weaken with the increasing of evolutionary optimization iterations gradu- ally. There are many phenomenons which are in the practical application most far from the overall advan- tages of the standard genetic algorithm. It is seeking a standstill excellent work, and at this time, it is similar to many individuals and even to repeat. To this end, it is believed that the initial change is the new range of initial changes. Returning the standard genetic algorithm gives rise to accelerate the formation of operation. The range of outstanding individuals will be gradually reduced, with the most advantages from the getting closer and closer, until individual value of the optimal criterion function is less than a stetted value or the accelerating frequency is achieved in the process of algorithm. Then end up the entitle algorithm. The best individual in the current groups is designated as a result of accelerating genetic algorithm. This method is the accelerating ge- netic algorithm which is based on real-coded. 3.6. Programming Diagram This paper proposed the steps of the model as shown in Figure 1. 4. Case Studies In order to verify the effectiveness of the model applied in the real estate investment decision-making, we se- lected a real estate company’s six investment programs to carry on comprehensive evaluation. Table 1 lists seven original data values in the six programs: Note: The data are derived from the financial data of a real estate investment company. For the greater and better indicators, such as the ex- pectations of net present value index, the risk of profit values, expectations of net present value, financial net present value and economic net present value, the data were treaded as follows: * min max min (,)( ) (, )() () x ij xj xi j x jx j For example, the expectations of net present value in- dex of program A is normalized by the following for- mula: Figure 1. Programming diagram of PPC model based on RAGA. RAGA al g orith m Sort Optimization Evaluation index system PPC model The best projection direc- tion The best projection value 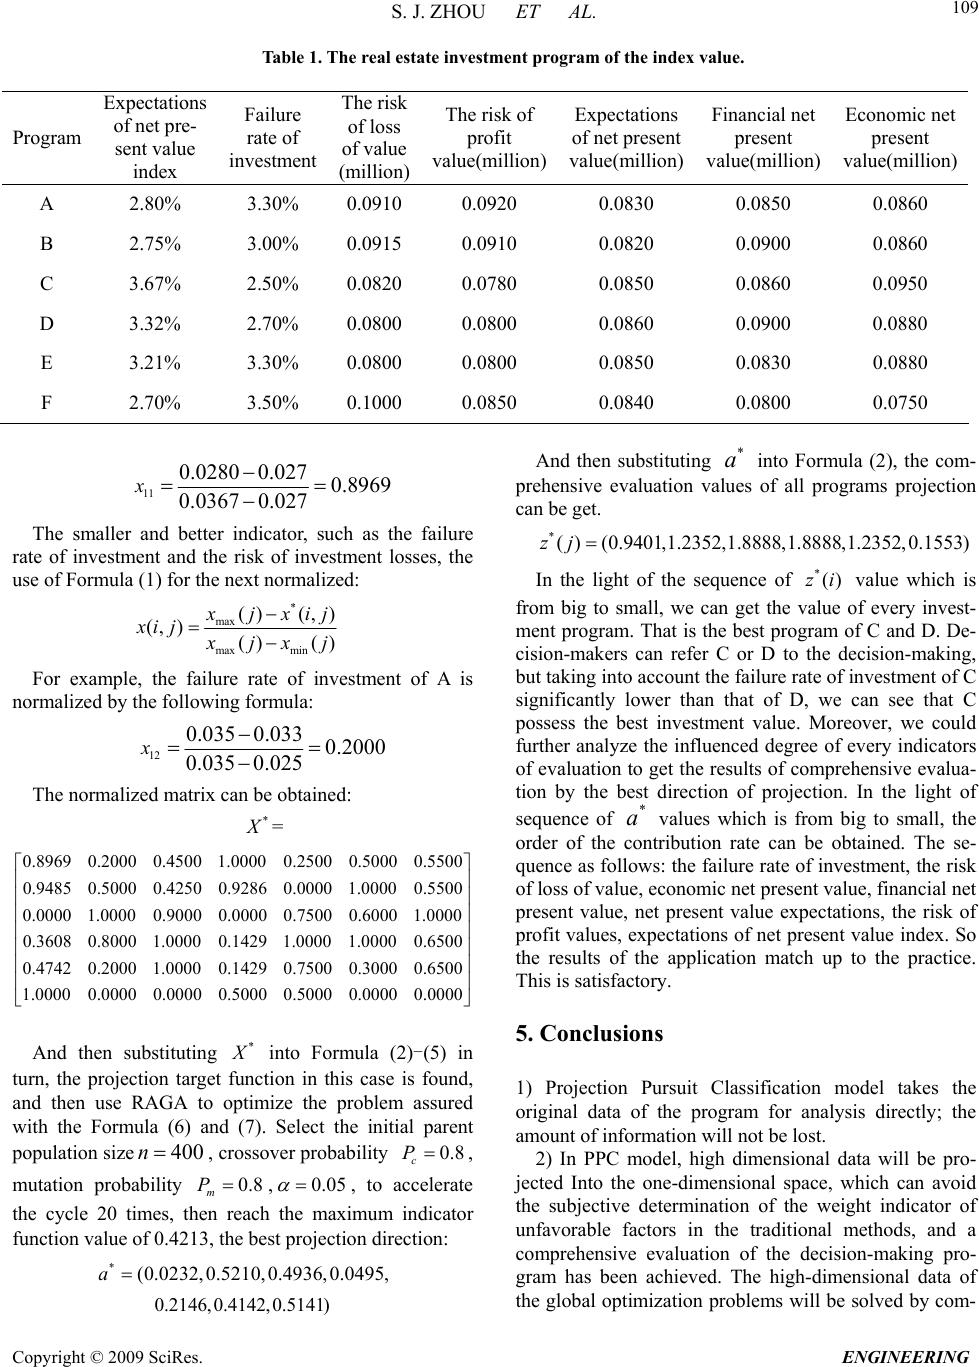 S. J. ZHOU ET AL. Copyright © 2009 SciRes. ENGINEERING 109 Table 1. The real estate investment program of the index value. Program Expectations of net pre- sent value index Failure rate of investment The risk of loss of value (million) The risk of profit value(million) Expectations of net present value(million) Financial net present value(million) Economic net present value(million) A 2.80% 3.30% 0.0910 0.0920 0.0830 0.0850 0.0860 B 2.75% 3.00% 0.0915 0.0910 0.0820 0.0900 0.0860 C 3.67% 2.50% 0.0820 0.0780 0.0850 0.0860 0.0950 D 3.32% 2.70% 0.0800 0.0800 0.0860 0.0900 0.0880 E 3.21% 3.30% 0.0800 0.0800 0.0850 0.0830 0.0880 F 2.70% 3.50% 0.1000 0.0850 0.0840 0.0800 0.0750 And then substituting into Formula (2), the com- prehensive evaluation values of all programs projection can be get. * a 11 0.0280 0.0270.8969 0.0367 0.027 x The smaller and better indicator, such as the failure rate of investment and the risk of investment losses, the use of Formula (1) for the next normalized: *( )(0.9401,1.2352,1.8888,zj1.8888,1.2352,0.1553) * max max min () (,) (, )() () x jxij xi j x jx j For example, the failure rate of investment of A is normalized by the following formula: 12 0.0350.0330.2000 0.0350.025 x The normalized matrix can be obtained: * X = 0.8969 0.2000 0.45001.00000.2500 0.5000 0.5500 0.9485 0.5000 0.4250 0.9286 0.00001.00000.5500 0.0000 1.00000.90000.00000.7500 0.6000 1.0000 0.36080.80001.0000 0.14291.00001.0000 0.6500 0.4742 0.20001.00000.1429 0.7500 0.3000 0.6500 1.00000.0000 0.0000 0.5000 0.5000 0.0000 0.0000 In the light of the sequence of value which is from big to small, we can get the value of every invest- ment program. That is the best program of C and D. De- cision-makers can refer C or D to the decision-making, but taking into account the failure rate of investment of C significantly lower than that of D, we can see that C possess the best investment value. Moreover, we could further analyze the influenced degree of every indicators of evaluation to get the results of comprehensive evalua- tion by the best direction of projection. In the light of sequence of values which is from big to small, the order of the contribution rate can be obtained. The se- quence as follows: the failure rate of investment, the risk of loss of value, economic net present value, financial net present value, net present value expectations, the risk of profit values, expectations of net present value index. So the results of the application match up to the practice. This is satisfactory. *()zi * a 5. Conclusions And then substituting * X into Formula (2)-(5 ) in turn, the projection target function in this case is found, and then use RAGA to optimize the problem assured with the Formula (6) and (7). Select the initial parent population size, crossover probability 400n0.8 c P , mutation probability , 0.8 m P0.05 , to accelerate the cycle 20 times, then reach the maximum indicator function value of 0.4213, the best projection direction: 1) Projection Pursuit Classification model takes the original data of the program for analysis directly; the amount of information will not be lost. 2) In PPC model, high dimensional data will be pro- jected Into the one-dimensional space, which can avoid the subjective determination of the weight indicator of unfavorable factors in the traditional methods, and a comprehensive evaluation of the decision-making pro- gram has been achieved. The high-dimensional data of the global optimization problems will be solved by com- *(0.0232,0.5210,0.4936,0.0495,a 0.2146, 0.4142, 0.5141)  S. J. ZHOU ET AL. Copyright © 2009 SciRes. ENGINEERING 110 bining RAGA with PPC model, which has provided a solid algorithm guarantee for the expansion and applica- tion of the PPC model. 3) The application of PPC model based on RAGA in the real estate investment comprehensive evaluation, not only reached a comprehensive evaluation of every pro- gram for the quality sequence, but also reflected the im- portance of the various evaluation indicators to the over- all evaluation by optimizing the projection direction. It also can avoid factitious interference of the experts em- powering, such as the Analytic Hierarchy Process, fuzzy comprehensive evaluation methods, which has overcome successfully the shortcomings of traditional methods. It provides a new idea and method to the study in the real estate investment decision-making evaluating. 6. References [1] W. B. Brueggeman and J. D. Fisher, “Real estate finance and investment,” China Machine Press, Beijing, 2002. [2] M. Bertolini, M. Braglia, and G. Carmignani, “Applica- tion of the AHP methodology in making a proposal for a public work contract,” International Journal of Project Management (S026-7863), Vol. 24, pp. 422-430, 2006. [3] Y. Gao, H. Xue, and P. Shen, “A new rectangle branch-and-reduce approach for solving nonconvex quadratic programming problems,” Applied Mathematics and Computation (S0096-3003), Vol. 168, pp. 1409- 1418, 2003. [4] Z. Wang, “Comprehensive evaluation method, problems and research trends,” Management Engineering, Vol. 1, pp. 73-79, 1998. [5] X. Yang and Z. Shen, “Intelligent algorithm and its re- sources and environment system modeling,” Beijing Normal University Press, Beijing, 2005. [6] Z. Li, “Sustainable development and application of evaluation model,” Science Press, Beijing, 2007. [7] J. H Friedman and J. W. Turkey, “A projection pursuit algorithm for exploratory data analysis,” On Computer, Vol. 23, pp. 881-890, 1974. [8] X. Zhao, “Projection pursuit model and its application in the land and water resources,” Northeast Agricultural University, Harbin, 2006. [9] S. Wang and Z. Yang, “Regional agricultural eco-environ- mental quality evaluation model of projection pursuit,” Journal of the Chinese Eco-Agriculture, Vol. 14, 2006. [10] H. Zhou and S. Dong, “Projection pursuit based on the quality evaluation model,” Hydrology, Vol. 25, pp. 14-17, 2005. [11] C. Ni, S. Wang, and P. Cui, “Projection pursuit dynamic cluster model and its application in groundwater classifi- cation,” Journal of Sichuan University: Engineering and Science Edition, Vol. 38, pp. 29-33, 2006. [12] Z. Li, J. Wang, and X. Jin, “Evolution algorithm based forecasting mode for lake eutrophication using PPR,” Journal of Sichuan University: Engineering Science Edi- tion, Vol. 39, pp. 47-50, 2007. [13] B. Fang, Z. Cheng, and H. Liu, “Application of projection pursuit model in integrated evaluation of national econ- omy,” Operations Research and Management Science, V ol. 14, pp. 85-88, 2005. [14] X. Huang, C. Liang, Q. Fu, et al., “Applying PPC model based on RAGA in the evaluating the regional water re- sources sustainable using,” Journal of Sichuan University: Engineering and Science Edition, Vol. 35, pp. 29-32, 2003. [15] Q. Fu, J. Liu, and L. Wang, “Study on the PPE model based on RAGA to classify the county energy,” Journal Systems Science and Information, Vol. 2, pp. 73-82, 2004. [16] Q. Fu, Y. Xie, and Z. Wei, “Application of projection pursuit evaluation model based on real-coded accelerat- ing genetic algorithm in evaluating wetland soil quality variations in the Sanjiang plain,” PEDOSPHERE, Vol. 13, pp. 249-256, 2003. [17] Q. Fu and X. Zhao, “The principle of projection pursuit model and its application,” Science Press, Beijing, 2006. [18] J. Jin and J. Ding, “Genetic algorithm and its application in water science,” Sichuan University Press, Chengdu, 2000. |