

Paper Menu >>
Journal Menu >>
 Atmospheric and Climate Sciences, 2011, 1, 142-146 doi:10.4236/acs.2011.13016 Published Online July 2011 (http://www.SciRP.org/journal/acs) Copyright © 2011 SciRes. ACS Comparison of UV-B Broadband Brewer Measurements with Irradiances from Surface-Based and Satellite-Based Models Jacqueline Binyamin1, John Davies2, Bruce McArthur3 1Department of Ge ography, University of Winnipeg, Winnipeg, Canada 2School of Geography and Earth Sciences, McMaster University, Hamilton, Canada 3Air Quality Research Branch, Meteorological Service of Canada, Toronto, Canada E-mail: [email protected] Received May 1, 2011; revised June 13, 2011; accepted June 28, 2011 Abstract UV-B irradiance can be estimated from surface meteorological data or from satellite measurements. This pa- per compares irradiance estimates from the Davies surface-based radiation model and the Canada Centre for Remote Sensing (CCRS) satellite model with Brewer spectrophotometer measurements for all sky conditions at six Canadian stations (Edmonton, Regina, Winnipeg, Montreal, Halifax and Toronto). The Davies model is applied with both the discrete ordinate radiative transfer (DISORT) and the delta-Eddington algorithms to solve the radiative transfer equation. Both models’ estimates are compared with instantaneous Brewer measurements. Both perform similarly with mean bias errors within 6% of the mean measured irradiance for the measurement period and root mean square errors between 25% and 30%. Keywords: UV-B Irradiance, Brewer Spectrophotometer, DISORT, Delta-Eddington, TOMS, Satellite-Based Models, Surface-Based Models 1. Introduction Stratospheric ozone depletion increases the amount of harmful UV-B (290 - 325 nm) irradiance reaching the earth’s surface [1]. Instruments such as the Brewer spec- trophotometer measure spectral irradiance [2], but meas- urements in Canada and internationally are spatially s- -parse and are generally of short duration. Radiation md- els can estimate irradiance for locations and times with- out measurements and can predict irradiances for possi- ble changes in ozone concentrations. Radiation models use either surface meteorological data or satellite measurements. Models, which use sur- face data, apply algorithms, which vary from simple ap- proximations [3] to rigorous solutions of the radiative transfer equation. The two most widely used radiative transfer solutions are the discrete ordinate radiative trans- fer (DISORT) model [4] and the delta-Eddington model [5]. Since these use local data, they should represent point conditions more accurately than the large area es- timates from satellite. Satellites measure reflected radiances at the top of the atmosphere which, combined with radiative transfer cal- culations or inversion algorithms, provide estimates of the irradiance at the surface [6-8]. Although satellite meas- urements provide extensive spatial coverage they usually provide, unless they are sun synchronous, one measure- ment each day, which prohibits the calculation of daily total irradiance. Comparisons of model calculations with measurements are mostly restricted to data for a few cloudless days [9-12]. Few studies have validated surface-based models for all sky conditions [13-17]. This paper compares broadband irradiances (290 - 320 nm) from a surface-based model [16,17] and from the Canada Centre for Remote Sensing (CCRS) Meteor-3/ total ozone mapping spectrometer (TOMS) satellite ba- sed-model [6-8] with Brewer spectrophotometer meas- urements in Canada. 2. Irradiance Measurements Brewer spectrophotometer measurements for six Can  J. BINYAMIN ET AL.143 Table 1. Canadian UV-B monitoring stations used in the study. Station Latitude, ˚N Longitude, ˚W Elevation, m Years of data Edmonton (Alta.) 53˚33′ 114˚06′ 766 1993-1994 Regina (Sask.) 50˚13′ 104˚40′ 592 1994 Winnipeg (Man.) 49˚55′ 97˚14′ 239 1993 Montreal (Que.) 45˚28′ 73˚45′ 24 1993-1994 Halifax (NS) 44˚44′ 63˚40′ 31 1993-1994 Toronto (Ont.) 43˚47′ 79˚23′ 198 1993-1994 dian locations, for which there were simultaneous satel- lite-based irradiances, are used in this study (Table 1). This instrument allows for the calculation of daily ozone depth and measures spectral irradiance for wavelengths between 290 and 325 nm at a resolution of 0.5 nm. Ra- diation measurements are made once or twice each hour from sunrise to sunset at irregular times in GMT [18]. Following Krotkov et al. [12] and Wang et al. [19] the Brewer values were increased by 6% to compensate for the cosine error. 3. The Davies Model The model developed by Davies et al. [16] and modified by Binyamin et al. [17] is used in this study. Surface irradiance is calculated as a linear combination of clear and overcast sky irradiances weighted with cloud fraction: G GG C 1GCGCG . (1) G and are calculated spectrally at wavelength interval of 1 nm using either the DISORT [4] or the delta-Eddington [5] solutions to the radiative transfer equation for a vertically inhomogeneous 49-layer, 120 km, plane parallel atmosphere, with cloud inserted be- tween 2 and 3 km heights. The model uses spectral val- ues of the extraterrestrial irradiance from the Solar Ul- traviolet Spectral Irradiance Monitor (SUSIM) ATLAS-3 space shuttle mission (D. Prinz, personal communication, 2002), ozone absorption coefficients from Paur and Bass [20], Rayleigh scattering cross sections following Elter- man [21], aerosol optical properties from Shettle and Fenn [22], a fixed cloud optical depth of 27 [17,23], and a fixed surface albedo of 0.05 [24]. Hourly total cloud opacity observations were obtained from the Meteoro- logical Service of Canada. G 4. The CCRS Satellite Model The CCRS satellite algorithm for retrieving surface ir- radiance [6] is based on a linear relationship between TOA albedo at 360 nm and surface absorbed irradiance. The surface irradiance is given by: 0 03360 cos1 0.1960.798 (1 ) d sus ST a Ga (2) where 0 is the extraterrestrial irradiance;S the solar zenith angle ;03 the band-mean transmittance due to ozone absorption; 360 T the albedo for the earth-atmos- phere system at 360 nm; s surface albedo; and d and u represent aerosol absorption for the downwel- ling and upwelling irradiance. a a The extraterrestrial irradiance was taken from Fröhlich and London [25]. Total ozone amount was taken from the TOMS data set. Surface albedo was assumed to be 0.04 for Toronto and 0.03 for other stations. Aerosol optical depth a measurements were available for To- ronto [19] and a value of 0.31 was substituted for miss- ing days. For Winnipeg and Edmonton a was assumed to be 0.2, and 0.1 for the remaining stations. Aerosol single scattering albedo was assumed to be 0.95 for all stations. The model can only be used for days without snow cover. 5. Comparison of the Davies Model and CCRS Model Results The Meteor 3 reflectance measurements were made at different local times, with usually once per day, with a maximum of two values per day that matched the times of Brewer measurements (Pubu Ciren, CCRS, personal communication, 2007). Each CCRS model estimate is compared with a simultaneous Brewer measurement and a calculation from the Davies model using both the delta-Eddington and DISORT methods. There is a small difference in the spectral integration range used by CCRS and the Davies model. CCRS presents irradiances integrated over the 290 - 320.5 nm wavebands in 0.5 nm steps while the Davies irradiances were integrated in 1 nm steps over the 290 - 320 nm range. In this section, both models are compared with Brewer measurements integrated to the upper wavelength limit appropriate to the model. Comparison of the Davies model broadband irradian- ces and the simultaneous satellite-based results with Bre- wer measurements made at six stations (Edmonton, Re- gina, Winnipeg, Montreal, Halifax and Toronto) in 1993 and 1994 (Table 1) are presented in Figure 1. They rep- resent 10 station years of instantaneous data mainly be- tween May and September, with 605 data points in total. Generally, the agreement between the three is visually good for all stations. The MBE (mean difference) values correspond to less than 0.04 W·m-2 on average for indi- vidual stations and pooled data for both surface-based and satellite-based methods. Table 2 provides performance statistics for both indi- Copyright © 2011 SciRes. ACS 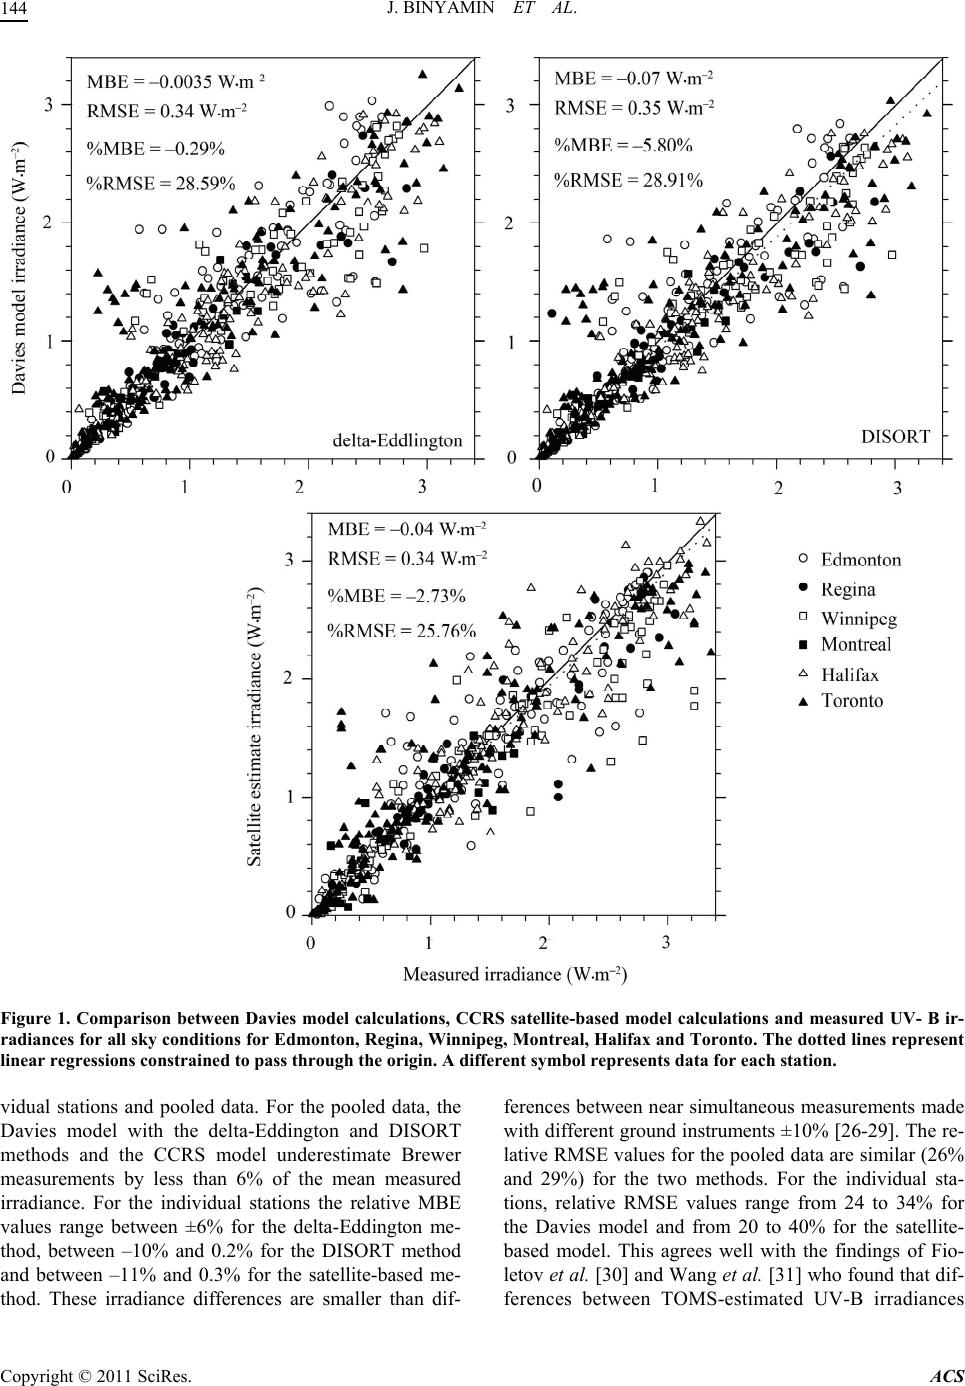 J. BINYAMIN ET AL. Copyright © 2011 SciRes. ACS 144 Figure 1. Comparison between Davies model calculations, CCRS satellite-based model calculations and measured UV- B ir- radiances for all sky conditions for Edmonton, Regina, Winnipeg, Montreal, Halifax and Toronto. The dotted lines represent linear regressions constrained to pass through the origin. A different symbol represents data for each station. vidual stations and pooled data. For the pooled data, the Davies model with the delta-Eddington and DISORT methods and the CCRS model underestimate Brewer measurements by less than 6% of the mean measured irradiance. For the individual stations the relative MBE values range between ±6% for the delta-Eddington me- thod, between –10% and 0.2% for the DISORT method and between –11% and 0.3% for the satellite-based me- thod. These irradiance differences are smaller than dif- ferences between near simultaneous measurements made with different ground instruments ±10% [26-29]. The re- lative RMSE values for the pooled data are similar (26% and 29%) for the two methods. For the individual sta- tions, relative RMSE values range from 24 to 34% for the Davies model and from 20 to 40% for the satellite- based model. This agrees well with the findings of Fio- letov et al. [30] and Wang et al. [31] who found that dif- erences between TOMS-estimated UV-B irradiances f 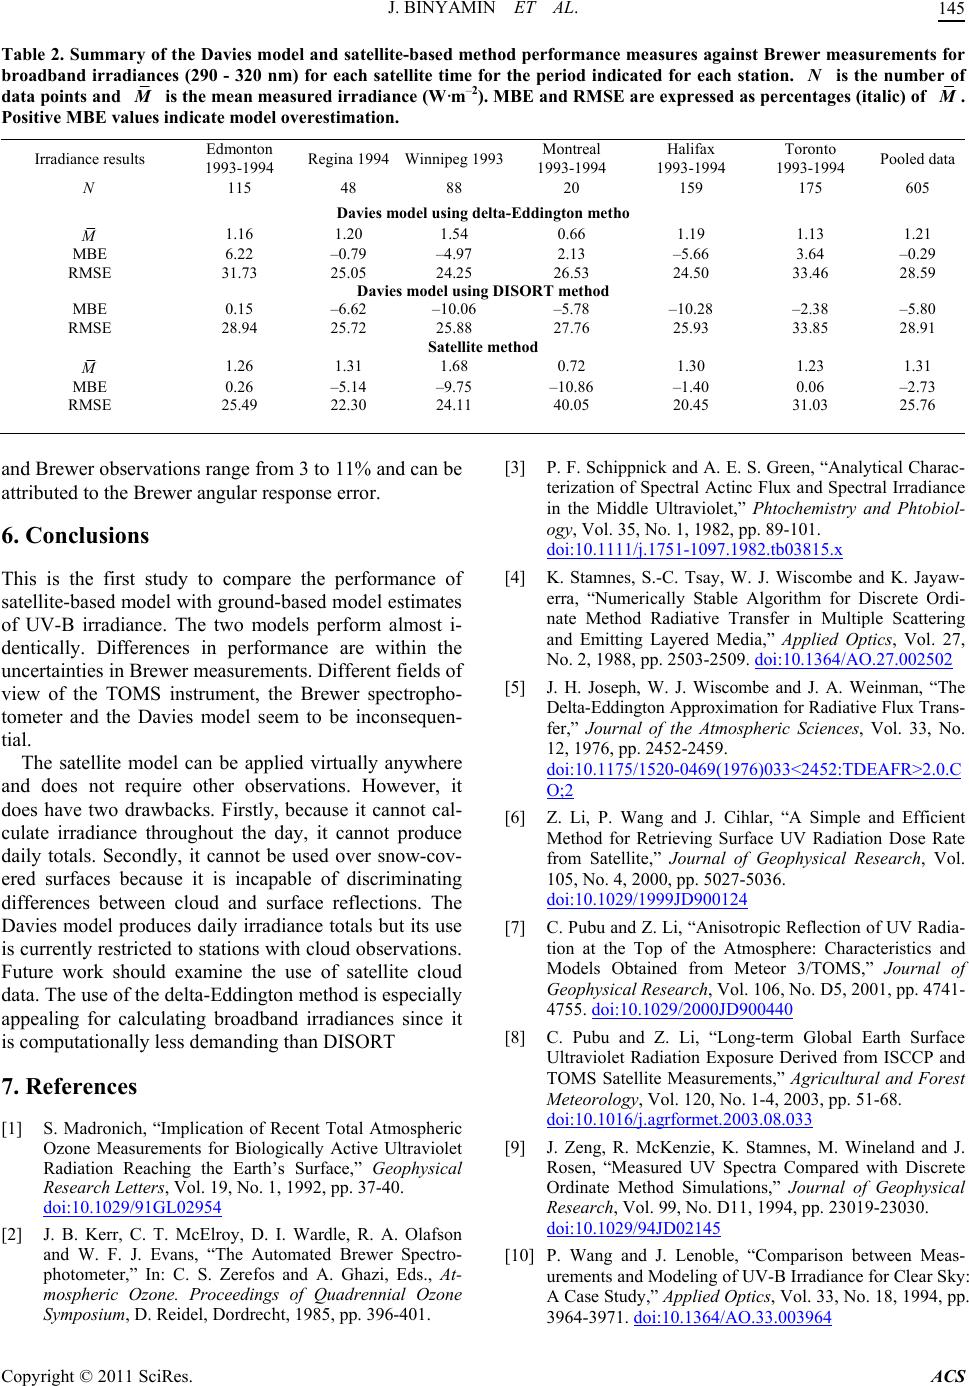 J. BINYAMIN ET AL. Copyright © 2011 SciRes. ACS 145 Table 2. Summary of the Davies model and satellite-based method performance measures against Brewer measurements for broadband irradiances (290 - 320 nm) for each satellite time for the period indicated for each station. is the number of data points and N M is the mean measured irradiance (W·m–2). MBE and RMSE are expressed as percentages (italic) of M. Positive MBE values indicate model overestimation. Irradiance results Edmonton 1993-1994 Regina 1994Winnipeg 1993Montreal 1993-1994 Halifax 1993-1994 Toronto 1993-1994 Pooled data N 115 48 88 20 159 175 605 Davies model using delta-Eddington metho M 1.16 1.20 1.54 0.66 1.19 1.13 1.21 MBE 6.22 –0.79 –4.97 2.13 –5.66 3.64 –0.29 RMSE 31.73 25.05 24.25 26.53 24.50 33.46 28.59 Davies model using DISORT method MBE 0.15 –6.62 –10.06 –5.78 –10.28 –2.38 –5.80 RMSE 28.94 25.72 25.88 27.76 25.93 33.85 28.91 Satellite method M 1.26 1.31 1.68 0.72 1.30 1.23 1.31 MBE 0.26 –5.14 –9.75 –10.86 –1.40 0.06 –2.73 RMSE 25.49 22.30 24.11 40.05 20.45 31.03 25.76 and Brewer observations range from 3 to 11% and can be attributed to the Brewer angular response error. 6. Conclusions This is the first study to compare the performance of satellite-based model with ground-based model estimates of UV-B irradiance. The two models perform almost i- dentically. Differences in performance are within the uncertainties in Brewer measurements. Different fields of view of the TOMS instrument, the Brewer spectropho- tometer and the Davies model seem to be inconsequen- tial. The satellite model can be applied virtually anywhere and does not require other observations. However, it does have two drawbacks. Firstly, because it cannot cal- culate irradiance throughout the day, it cannot produce daily totals. Secondly, it cannot be used over snow-cov- ered surfaces because it is incapable of discriminating differences between cloud and surface reflections. The Davies model produces daily irradiance totals but its use is currently restricted to stations with cloud observations. Future work should examine the use of satellite cloud data. The use of the delta-Eddington method is especially appealing for calculating broadband irradiances since it is computationally less demanding than DISORT 7. References [1] S. Madronich, “Implication of Recent Total Atmospheric Ozone Measurements for Biologically Active Ultraviolet Radiation Reaching the Earth’s Surface,” Geophysical Research Letters, Vol. 19, No. 1, 1992, pp. 37-40. doi:10.1029/91GL02954 [2] J. B. Kerr, C. T. McElroy, D. I. Wardle, R. A. Olafson and W. F. J. Evans, “The Automated Brewer Spectro- photometer,” In: C. S. Zerefos and A. Ghazi, Eds., At- mospheric Ozone. Proceedings of Quadrennial Ozone Symposium, D. Reidel, Dordrecht, 1985, pp. 396-401. [3] P. F. Schippnick and A. E. S. Green, “Analytical Charac- terization of Spectral Actinc Flux and Spectral Irradiance in the Middle Ultraviolet,” Phtochemistry and Phtobiol- ogy, Vol. 35, No. 1, 1982, pp. 89-101. doi:10.1111/j.1751-1097.1982.tb03815.x [4] K. Stamnes, S.-C. Tsay, W. J. Wiscombe and K. Jayaw- erra, “Numerically Stable Algorithm for Discrete Ordi- nate Method Radiative Transfer in Multiple Scattering and Emitting Layered Media,” Applied Optics, Vol. 27, No. 2, 1988, pp. 2503-2509. doi:10.1364/AO.27.002502 [5] J. H. Joseph, W. J. Wiscombe and J. A. Weinman, “The Delta-Eddington Approximation for Radiative Flux Trans- fer,” Journal of the Atmospheric Sciences, Vol. 33, No. 12, 1976, pp. 2452-2459. doi:10.1175/1520-0469(1976)033<2452:TDEAFR>2.0.C O;2 [6] Z. Li, P. Wang and J. Cihlar, “A Simple and Efficient Method for Retrieving Surface UV Radiation Dose Rate from Satellite,” Journal of Geophysical Research, Vol. 105, No. 4, 2000, pp. 5027-5036. doi:10.1029/1999JD900124 [7] C. Pubu and Z. Li, “Anisotropic Reflection of UV Radia- tion at the Top of the Atmosphere: Characteristics and Models Obtained from Meteor 3/TOMS,” Journal of Geophysical Res ear ch, Vol. 106, No. D5, 2001, pp. 4741- 4755. doi:10.1029/2000JD900440 [8] C. Pubu and Z. Li, “Long-term Global Earth Surface Ultraviolet Radiation Exposure Derived from ISCCP and TOMS Satellite Measurements,” Agricultural and Forest Meteorology, Vol. 120, No. 1-4, 2003, pp. 51-68. doi:10.1016/j.agrformet.2003.08.033 [9] J. Zeng, R. McKenzie, K. Stamnes, M. Wineland and J. Rosen, “Measured UV Spectra Compared with Discrete Ordinate Method Simulations,” Journal of Geophysical Research, Vol. 99, No. D11, 1994, pp. 23019-23030. doi:10.1029/94JD02145 [10] P. Wang and J. Lenoble, “Comparison between Meas- urements and Modeling of UV-B Irradiance for Clear Sky: A Case Study,” Applied Optics, Vol. 33, No. 18, 1994, pp. 3964-3971. doi:10.1364/AO.33.003964  J. BINYAMIN ET AL. 146 [11] B. Mayer, G. Seckmeyer and A. Kyling, “Systematic Long-Term Comparison of Spectral UV Measurements and UVSPEC Modeling Results,” Journal of Geophysical Research, Vol. 102, No. 7, 1997, pp. 8755-8767. doi:10.1029/97JD00240 [12] N. A. Krotkov, P. K. Bhartia, J. R. Herman, V. Fioletov and J. Kerr, “Satellite Estimation of Spectral Surface UV Irradiance in the Presence of Tropospheric Aerosols 1. Cloud-Free Case,” Journal of Geophysical Research, Vol. 103, No. D8, 1998, pp. 8779-8793. doi:10.1029/98JD00233 [13] E. Leontyeva and K. Stamnes, “Estimations of Cloud Optical Thickness from Ground-Based Measurements of Incoming Solar Radiation in the Arctic,” Journal of Cli- mate, Vol. 7, No. 4, 1994, pp. 566-578. doi:10.1175/1520-0442(1994)007<0566:EOCOTF>2.0.C O;2 [14] P. M. de F. Forster, K. P. Shine and A. R. Webb, “Mod- elling Ultraviolet Radiation at the Earth’s Surface. Part II: Model and Instrument Comparison,” Journal of Applied Meteorology, Vol. 34, No. 7, 1995, pp. 2426-2439. doi:10.1175/1520-0450(1995)034<2426:MURATE>2.0. CO;2 [15] D. Lubin and E. H. Jenson, “Effects of Clouds and Strato- spheric Ozone Depletion on Ultraviolet Radiation Trends,” Nature, Vol. 377, 1995, pp. 710-713. doi:10.1038/377710a0 [16] J. Davies, P. Kuhn, G. Duhamel, J. Binyamin and K. Runnalls, “An Ultraviolet (290 - 325 nm) Irradiation Mo- del for Southern Canadian Conditions,” Physical Geog- raphy, Vol. 21, No. 4, 2000, pp. 327-344. [17] J. Binyamin, J. Davies and B. McArthur, “Validation of Spectral and Broadband UV-B (290 - 325 nm) Irradiance for Canada,” Atmospheric and Climate Sciences, Vol. 1, No. 3, 2011, In press. [18] J. B. Kerr and C. T. McElory, “Evidence for Large Up- ward Trends of Ultraviolet-B Radiation Linked to Ozone Depletion,” Science, Vol. 262, No. 2136, 1993, pp. 1032- 1035. doi:10.1126/science.262.5136.1032 [19] P. Wang, Z. Li, J. Cihlar, D. I. Wardle and J. Kerr,” Vali- dation of an UV Inversion Algorithm Using Satellite and Surface Measurements,” Journal of Geophysical Re- search, Vol. 105, No. D4, 2000, pp. 5037-5048. doi:10.1029/1999JD900403 [20] R. J. Paur and A. M. Bass, “The Ultraviolet Cross-Sections of Ozone: II. Results and Temperature Dependence” In: C. Zerefos and A. Ghaz, Eds., Atmospheric Ozone Pro- ceedings of the Quadrennial Ozone Symposium, D. Rei- del, Dordrecht, 1985, pp. 606-616. [21] L. Elterman, “UV, Visible and IR Attenuation for Alti- tudes to 50 km,” Air Force Cambridge Research Labora- tory, No. 285, Cambridge, 1986. [22] E. P. Shettle and R. W. Fenn, “Models for the Aerosols of the Lower Atmosphere and the Effects of Humidity Variations on Their Optical Properties,” Air Force Geo- physics Laboratory (AFGL), 1979. [23] J. Binyamin, J. Davies and B. McArthur, “UV-B Cloud Optical Properties for Canada,” International Journal of Climatology, Vol. 30, No. 8, 2010, pp. 1246-1255. doi:10.1002/joc.1966 [24] D. E. Bowker, R. E. Davis, D. I. Myrick, K. Stacy and W. T. Jones, “Spectral Reflectance of Natural Targets for Use in Remote Sensing Studies,” NASA reference publi- cation 1139, NASA, Langley Research Center, Hampton, 1985. [25] C. Fröhlich and J. London, “Revised Instruction Manual on Radiation Instruments and Measurements,” WMO Technology Note 149, World Meteorology Organization, Geneva, 1986. [26] R. L. McKenzie, M. Kotkamp, G. Seckmeyer, R. Erb, C. R. Roy, H. P. Gies and S. T. Toomey, “First Southern Hemisphere Intercomparison of Measured Solar UV Spectra,” Geophysical Research Letters, Vol. 20, No. 20, 1993, pp. 2223-2226. doi:10.1029/93GL02359 [27] A. F. Bais, B. G. Gardiner, H. Slaper, M. Blumthaler, G. Bernhard, R. McKenize, A. R. Wedd, G. Seckmeyer, B. Kjeldstad, T. Koskela, P. J. Kirsch, J. Gröbner, J. B. Kerr, S. Kazadzis, K. Leszczynski, D. Wardle, W. Josefsson, C. Brogniez, D. Gillotay, H. Reinen, P. Weihs, T. Svenoe, P. Eriksen, F. Kuik and A. Redondas, “SUSPEN Intercom- parison of Ultraviolet Spectroradiometers,” Journal of Geophysical Research, Vol. 106, No. D12, 2001, pp. 12509-12525. doi:10.1029/2000JD900561 [28] O. Meinander, S. Kazadzis, M. Blumthaler, L. Ylianttila, B. Johnsen, K. Lakkala, T. Koskela and W. Josefsson, “Diurnal Discrepancies in Spectral Solar UV Radiation Measurements,” Applied Optics, Vol. 45, No. 21, 2006, pp. 5346-5357. doi:10.1364/AO.45.005346 [29] S. Kazadzis, A. Bais, A. Arola, N. Krotkov, N. Koure- meti and C. Meleti, “Ozone Monitoring Instrument Spec- tral UV Irradiance Products: Comparison with Ground Based Measurements at an Urban Environment”, Atmos- pheric Chemistry and Physics, Vol. 9, 2009, pp. 585-594. doi:10.5194/acp-9-585-2009 [30] V. E. Fioletov, J. B. Kerr and D. I. Wardle, “Comparison of Brewer Ultraviolet Irradiance Measurements with To- tal Ozone Mapping Spectrometer Satellite Retrievals,” Optical Engineering, Vol. 41, No. 12, 2002, p. 3051. doi:10.1117/1.1516818 [31] T. J. Wang, K. S. Lam, Q. Liu and T. K. Chan, “Assess- ment of Long Term UV Radiation Measured by the Brewer Spectrophotometer in Hong Kong during 1995- 2005,” Atmospheric and Climate Sciences, Vol. 1, No. 1, 2011, pp. 9-17. doi:10.4236/acs.2011.11002 Copyright © 2011 SciRes. ACS |