

Paper Menu >>
Journal Menu >>
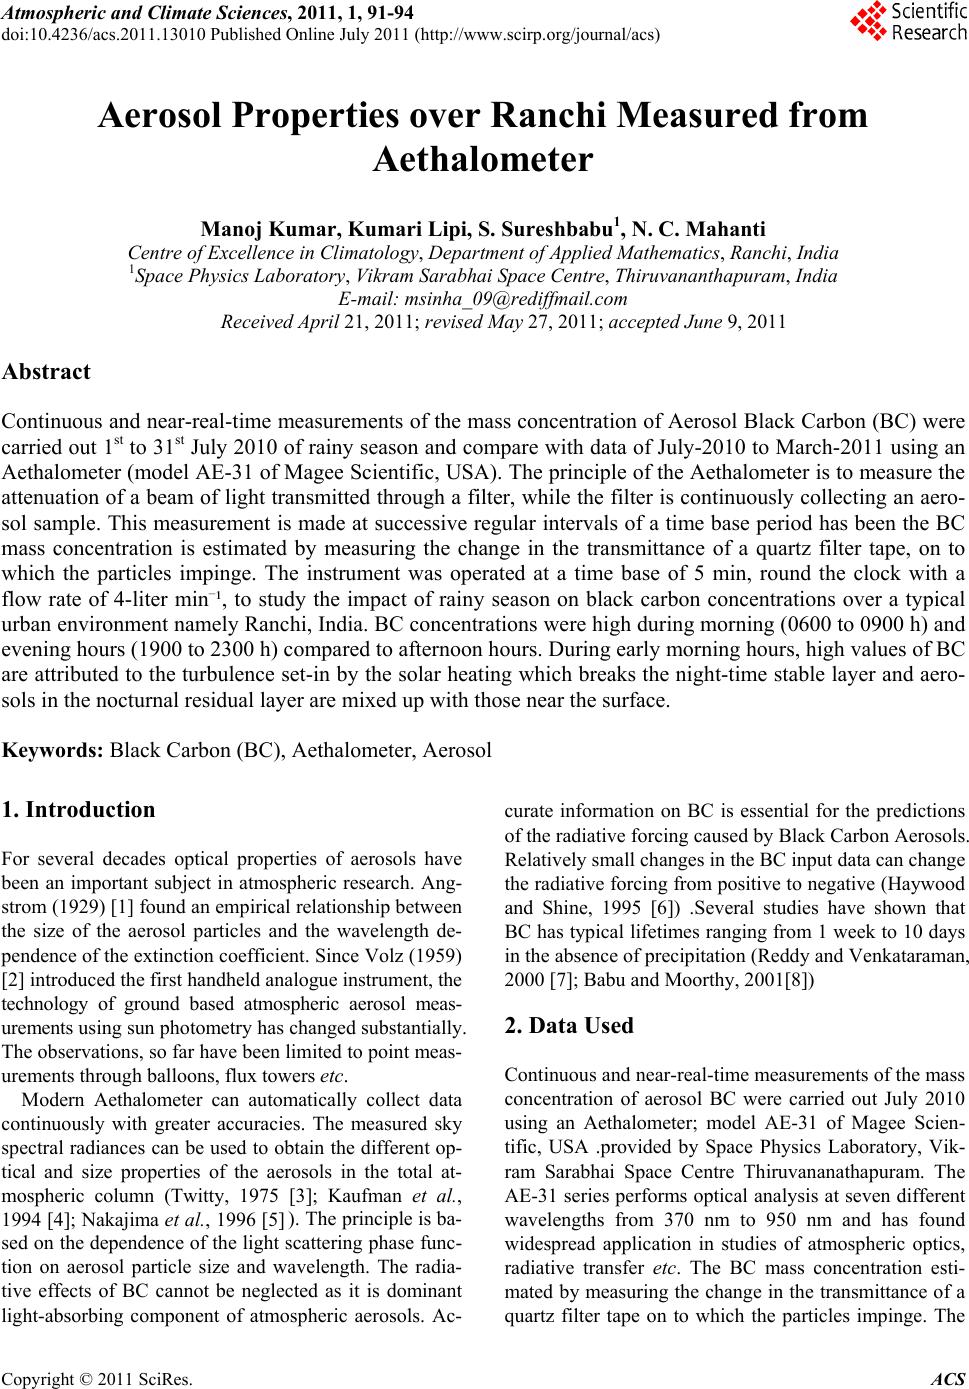 Atmospheric and Climate Sciences, 2011, 1, 91-94 doi:10.4236/acs.2011.13010 Published Online July 2011 (http://www.scirp.org/journal/acs) Copyright © 2011 SciRes. ACS 91 Aerosol Properties over Ranchi Measured from Aethalometer Manoj Kumar, Kumari Lipi, S. Sureshbabu1, N. C. Mahanti Centre of Excellence in Climatology, Department of Ap pl i e d Mat hematics , Ranchi, India 1Space Physics Laboratory, Vikram Sarabhai Space Centre, Thiruvananthapuram, In d ia E-mail: [email protected] Received April 21, 2011; revised May 27, 2011; accepted June 9, 2011 Abstract Continuous and near-real-time measurements of the mass concentration of Aerosol Black Carbon (BC) were carried out 1st to 31st July 2010 of rainy season and compare with data of July-2010 to March-2011 using an Aethalometer (model AE-31 of Magee Scientific, USA). The principle of the Aethalometer is to measure the attenuation of a beam of light transmitted through a filter, while the filter is continuously collecting an aero- sol sample. This measurement is made at successive regular intervals of a time base period has been the BC mass concentration is estimated by measuring the change in the transmittance of a quartz filter tape, on to which the particles impinge. The instrument was operated at a time base of 5 min, round the clock with a flow rate of 4-liter min–¹, to study the impact of rainy season on black carbon concentrations over a typical urban environment namely Ranchi, India. BC concentrations were high during morning (0600 to 0900 h) and evening hours (1900 to 2300 h) compared to afternoon hours. During early morning hours, high values of BC are attributed to the turbulence set-in by the solar heating which breaks the night-time stable layer and aero- sols in the nocturnal residual layer are mixed up with those near the surface. Keywords: Black Carbon (BC), Aethalometer, Aerosol 1. Introduction For several decades optical properties of aerosols have been an important subject in atmospheric research. Ang- strom (1929) [1] found an emp irical relatio nship betw een the size of the aerosol particles and the wavelength de- pendence of the extinction coefficient. Since Volz (1959) [2] introdu c ed the first handheld analogue instrument, the technology of ground based atmospheric aerosol meas- urements using sun photometry has change d substantially. The observations, so far have been limited to poin t meas- urements through balloon s, flux towers etc. Modern Aethalometer can automatically collect data continuously with greater accuracies. The measured sky spectral radiances can be used to obtain the different op- tical and size properties of the aerosols in the total at- mospheric column (Twitty, 1975 [3]; Kaufman et al., 1994 [4]; Nakajima et al., 1996 [5] ). The principle is ba- sed on the dependence of the light scattering phase func- tion on aerosol particle size and wavelength. The radia- tive effects of BC cannot be neglected as it is dominant light-absorbing component of atmospheric aerosols. Ac- curate information on BC is essential for the predictions of the radiative forcing caused by Black Carbon Aerosols. Relatively small changes in the BC input data can change the radiative forcing from positive to n egative (Haywood and Shine, 1995 [6]) .Several studies have shown that BC has typical lifetimes ranging from 1 week to 10 days in the absence of precipitation (Reddy and Venkataraman, 2000 [7]; Babu and Moorthy, 2001[8]) 2. Data Used Continuous and near-real-time measurements of the mass concentration of aerosol BC were carried out July 2010 using an Aethalometer; model AE-31 of Magee Scien- tific, USA .provided by Space Physics Laboratory, Vik- ram Sarabhai Space Centre Thiruvananathapuram. The AE-31 series performs optical analysis at seven different wavelengths from 370 nm to 950 nm and has found widespread application in studies of atmospheric optics, radiative transfer etc. The BC mass concentration esti- mated by measuring the change in the transmittance of a quartz filter tape on to which the particles impinge. The 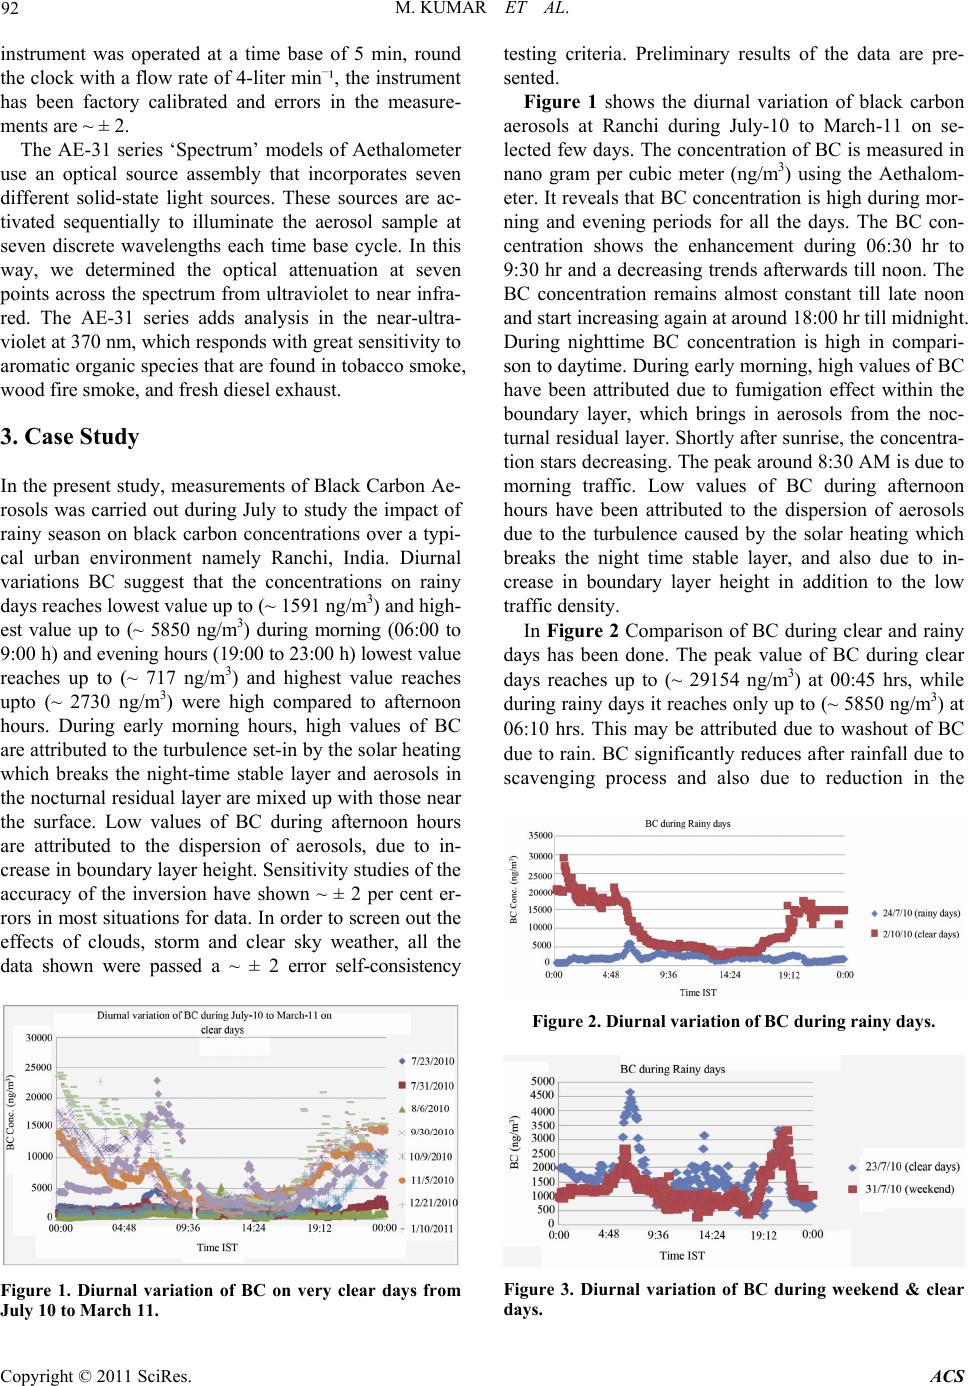 92 M. KUMAR ET AL. instrument was operated at a time base of 5 min, round the clock with a flow rate of 4-liter min–¹, the instrument has been factory calibrated and errors in the measure- ments are ~ ± 2. The AE-31 series ‘Spectrum’ models of Aethalometer use an optical source assembly that incorporates seven different solid-state light sources. These sources are ac- tivated sequentially to illuminate the aerosol sample at seven discrete wavelengths each time base cycle. In this way, we determined the optical attenuation at seven points across the spectrum from ultraviolet to near infra- red. The AE-31 series adds analysis in the near-ultra- violet at 370 nm, which responds with great sensitivity to aromatic organic species that are found in tobacco smoke, wood fire smoke, and fresh diesel exhaust. 3. Case Study In the present study, measurements of Black Carbon Ae- rosols was carried out during July to study the impact of rainy season on black carbon concentrations over a typi- cal urban environment namely Ranchi, India. Diurnal variations BC suggest that the concentrations on rainy days reaches lowest value up to (~ 1591 ng/m3) and high- est value up to (~ 5850 ng/m3) during morning (06:00 to 9:0 0 h ) and evening hours (19:00 to 23:00 h) lowest v alu e reaches up to (~ 717 ng/m3) and highest value reaches upto (~ 2730 ng/m3) were high compared to afternoon hours. During early morning hours, high values of BC are attributed to the turbu lence set-in by th e solar heating which breaks the night-time stable layer and aerosols in the nocturnal residual layer are mixed up with those near the surface. Low values of BC during afternoon hours are attributed to the dispersion of aerosols, due to in- crease in boundary layer height. Sensitivity studies of the accuracy of the inversion have shown ~ ± 2 per cent er- rors in most situations for data. In order to screen out the effects of clouds, storm and clear sky weather, all the data shown were passed a ~ ± 2 error self-consistency Figure 1. Diurnal variation of BC on very clear days from July 10 to March 11. testing criteria. Preliminary results of the data are pre- sented. Figure 1 shows the diurnal variation of black carbon aerosols at Ranchi during July-10 to March-11 on se- lected few days. The concentration of BC is measured in nano gram per cubic meter (ng/m3) using the Aethalom- eter. It reveals that BC concentration is high during mor- ning and evening periods for all the days. The BC con- centration shows the enhancement during 06:30 hr to 9:30 hr and a decreasing trend s afterwards till noon. The BC concentration remains almost constant till late noon and start increasing again at around 18:00 hr till midnight. During nighttime BC concentration is high in compari- son to daytime. During early morning, high values of BC have been attributed due to fumigation effect within the boundary layer, which brings in aerosols from the noc- turnal residual layer. Shortly after sunrise, the concentra- tion stars decreasing. The peak around 8:30 AM is due to morning traffic. Low values of BC during afternoon hours have been attributed to the dispersion of aerosols due to the turbulence caused by the solar heating which breaks the night time stable layer, and also due to in- crease in boundary layer height in addition to the low traffic density. In Figure 2 Comparison of BC during clear and rainy days has been done. The peak value of BC during clear days reaches up to (~ 29154 ng/m3) at 00:45 hrs, while during rainy days it reache s only up to (~ 5850 ng/m3) at 06:10 hrs. This may be attributed due to washout of BC due to rain. BC significantly reduces after rainfall due to scavenging process and also due to reduction in the Figure 2. Diurnal variation of BC during rainy days. Figure 3. Diurnal variation of BC during weekend & clear days. Copyright © 2011 SciRes. ACS 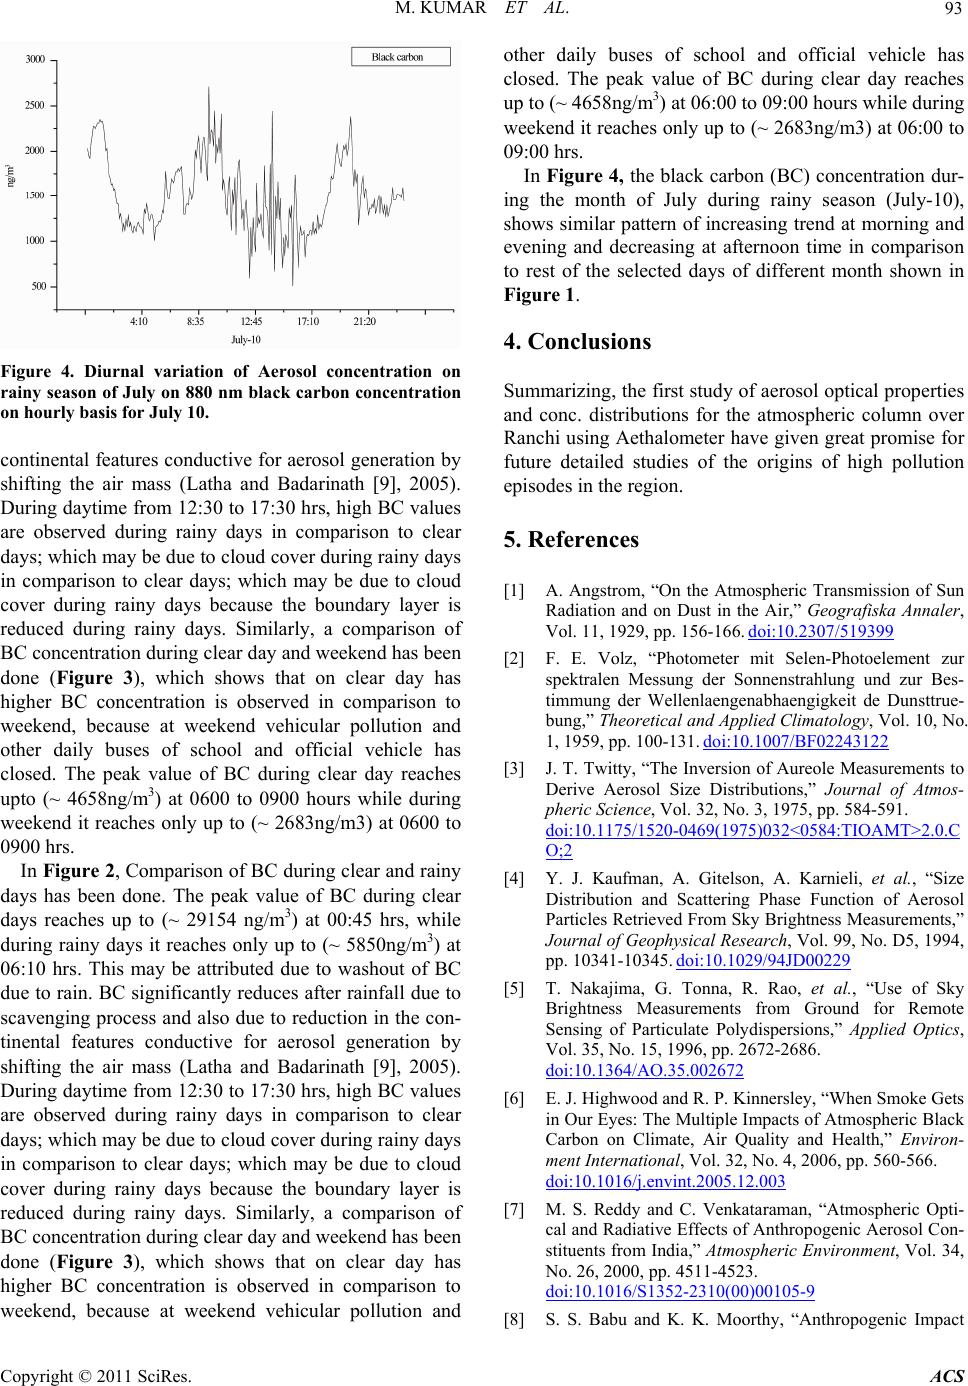 M. KUMAR ET AL. 93 Figure 4. Diurnal variation of Aerosol concentration on rainy season of July on 880 nm black carbon concentration on hourly basis for July 10. continental featu res conductive for aerosol generation by shifting the air mass (Latha and Badarinath [9], 2005). During daytime from 12:30 to 17:30 hrs, high BC values are observed during rainy days in comparison to clear days; which may be due to cloud cover during rainy days in comparison to clear days; which may be due to cloud cover during rainy days because the boundary layer is reduced during rainy days. Similarly, a comparison of BC concentration during clear day and weekend has been done (Figure 3), which shows that on clear day has higher BC concentration is observed in comparison to weekend, because at weekend vehicular pollution and other daily buses of school and official vehicle has closed. The peak value of BC during clear day reaches upto (~ 4658ng/m3) at 0600 to 0900 hours while during weekend it reaches only up to (~ 2683ng/m3) at 0600 to 0900 hrs. In Figure 2, Comparison of BC during clear and rainy days has been done. The peak value of BC during clear days reaches up to (~ 29154 ng/m3) at 00:45 hrs, while during rainy days it reaches only up to (~ 5850ng/m3) at 06:10 hrs. This may be attributed due to washout of BC due to rain. BC significantly reduces after rainfall due to scavenging process and also due to reduction in the con- tinental features conductive for aerosol generation by shifting the air mass (Latha and Badarinath [9], 2005). During daytime from 12:30 to 17:30 hrs, high BC values are observed during rainy days in comparison to clear days; which may be due to cloud cover during rainy days in comparison to clear days; which may be due to cloud cover during rainy days because the boundary layer is reduced during rainy days. Similarly, a comparison of BC concentration during clear day and weekend has been done (Figure 3), which shows that on clear day has higher BC concentration is observed in comparison to weekend, because at weekend vehicular pollution and other daily buses of school and official vehicle has closed. The peak value of BC during clear day reaches up to (~ 4658ng/m3) at 06:00 to 09:00 hours while during weekend it reache s only up to (~ 2683ng/m3) at 06:00 to 09:00 hrs. In Figure 4, the black car bon (BC) concentration dur- ing the month of July during rainy season (July-10), shows similar pattern of increasing trend at morning and evening and decreasing at afternoon time in comparison to rest of the selected days of different month shown in Figure 1. 4. Conclusions Summarizing, the first study of aerosol optical properties and conc. distributions for the atmospheric column over Ranchi using Aethalometer have given great promise for future detailed studies of the origins of high pollution episodes in the region. 5. References [1] A. Angstrom, “On the Atmospheric Transmission of Sun Radiation and on Dust in the Air,” Geografiska Annaler, Vol. 11, 1929, pp. 156-166. doi:10.2307/519399 [2] F. E. Volz, “Photometer mit Selen-Photoelement zur spektralen Messung der Sonnenstrahlung und zur Bes- timmung der Wellenlaengenabhaengigkeit de Dunsttrue- bung,” Theoretical and Applied Climatology, Vol. 10, No. 1, 1959, pp. 100-131. doi:10.1007/BF02243122 [3] J. T. Twitty, “The Inversion of Aureole Measurements to Derive Aerosol Size Distributions,” Journal of Atmos- pheric Science, Vol. 32, No. 3, 1975, pp. 584-591. doi:10.1175/1520-0469(1975)032<0584:TIOAMT>2.0.C O;2 [4] Y. J. Kaufman, A. Gitelson, A. Karnieli, et al., “Size Distribution and Scattering Phase Function of Aerosol Particles Retrieve d From Sky Brightness Measurements,” Journal of Geophysical Research, Vol. 99, No. D5, 1994, pp. 10341-10345. doi:10.1029/94JD00229 [5] T. Nakajima, G. Tonna, R. Rao, et al., “Use of Sky Brightness Measurements from Ground for Remote Sensing of Particulate Polydispersions,” Applied Optics, Vol. 35, No. 15, 1996, pp. 2672-2686. doi:10.1364/AO.35.002672 [6] E. J. Highwood and R. P. Kinnersley, “When Smoke Gets in Our Eyes: The Multiple Impacts of Atmospheric Black Carbon on Climate, Air Quality and Health,” Environ- ment International, Vol. 32, No. 4, 2006, pp. 560-566. doi:10.1016/j.envint.2005.12.003 [7] M. S. Reddy and C. Venkataraman, “Atmospheric Opti- cal and Radiative Effects of Anthropogenic Aerosol Con- stituents from India,” Atmospheric Environment, Vol. 34, No. 26, 2000, pp. 4511-4523. doi:10.1016/S1352-2310(00)00105-9 [8] S. S. Babu and K. K. Moorthy, “Anthropogenic Impact Copyright © 2011 SciRes. ACS  M. KUMAR ET AL. Copyright © 2011 SciRes. ACS 94 on Aerosol Black Carbon Mass Concentration at a Tropical Coastal Station: A Case Study,” Earth Sci ences, Vol. 81, No. 9, 2001, pp. 1208-1214. [9] K. M. Latha, K. V. S. Badrinath, “Seasonal Variation of Black Carbon Aerosols and Total Aerosol Mass Concen- trations over Urban Environment in India,” Atmospheric Environment, Vol. 39, No. 22, 2005, pp. 4129-4141. doi:10.1016/j.atmosenv.2005.04.004 |