

Paper Menu >>
Journal Menu >>
 New Journal of Glass and Ceramics, 2011, 1, 28-33 doi:10.4236/njgc.2011.12005 Published Online July 2011 (http://www.SciRP.org/journal/njgc) Copyright © 2011 SciRes. NGJC Evaluation of Non Crystalline Phase in AZS Refractories b y XRD Methods M. S. Conconi1,2,3, N. M. Rendtorff1,3,4, E. F. Agli e tti1,4,5 1CETMIC (Centro de Tecnología de Recursos Minerales y Cerámica, (CIC-CONICET-CCT La Plata)), M. B. Gonnet, Argentina; 2Facultad de Ingeniería de la Universidad Nacional de La Plata. Argentina; 3CIC-PBA, Buenos Aires Argentina; 4Facultad de Ciencias Exactas de la Universidad N acional de La Plata. Argentin a; 5CONICET La Plata, Argent ina. Email: [email protected] Received Ma y 20th, 2011; Revised J une 17th, 2011; Accepted June 24th, 2011. ABSTRACT The relation between the atomic structure and the macroscopic properties and behaviors of a material constitute one of the obje c tiv e s of the materials sc ie nce, particularly in the design and development of ceramic materials. Crystalline and non crystalline phases together with pores, grain boundaries, etc. affect mechanical and fracture prop-erties as we ll a s chemical resistance and electric properties. These aspects will be bonded to the raw materials chosen and the whole processing route. In glass industry, although there are other electrofused refractories such as the alumina ones used in the feeding of the fusion kilns, probably the most used refractories in contact with the melted glass are electrofused ma- terials that belong to the Al2O3-SiO2-ZrO2 system commonly named AZS. Exceptionally for refractory materials the amount of the glassy phase in a AZS material is important and appreciable; and makes them particularly adequate for containing fussed glass. The glass proportion will define much of their prop-erties and behaviors. In the present work the results of the non crystalline phase quantification of two samples of commercial AZS materials are presented and compared. These were obtained by three different methods using in the X ray powder diffraction (XRD) techniques. The first method consists in the linear interpolation of the base lines of the diffractograms compared to the amorphous silica and th e fully crystalline quartz. The other two methods are based in the application of the Rietveld method. One is the internal standard method with quartz as fully crystalline standard and the other one consist in the inclusion of the glas- sy phase to the refinement with a structural model that can be understood as the widening of the peaks consequence of an extreme decrease in the crystallite size of a quartz phase. The three methods showed equivalent results (with d iffer- ences less than 3%) for the two samples and demonstrated that are adequate for the quantification of the non crystalline phase in this kind of materials. Keywords: XRD, Rietveld Method, Non Crystalline Pha se, Refractories 1. Introduction In glass industry, although there are other electrofused refractories such as the alumina ones used in the feeding of the fusion kilns, probably the most used refractories in contact with the melted glass are electrofused materials that belong to the Al2O3-SiO2-Zr O 2 system commonly named AZ S . In gla ss ind ustr y, altho ugh t here are o ther electrofused refractories such as the alumina ones used in [1,2]. T hese materials have influenced drastically the quality levels and productivity of the glass fabrication processes [3]. The first advance achieves by these materials was the improvement in the corrosion resistance, increasing the life of the kilns, together with the quality of the processed glass. Other important progresses accomplish were the improvement in the mou nting time and d ecrease in the devitrification cords and lower amount of bubbles produced by the “blistering” process [4-6]. Exceptionally for refractory materials the amount of the glassy phase in a ASZ material is important and ap- preciable; The weight proportions is around 20% and makes them particularly adequate for containing fussed glass. The glass proportion will define much of their properties and behaviors. To validate and compare three quantification methods for the non crystalline phase of an electrofused refractory material is the principal objective of the present wo rk. In the materials field the use of the X ray diffraction tech- nique fo r the non c r yst al li ne or a morp hous fra ct io n q ua n- 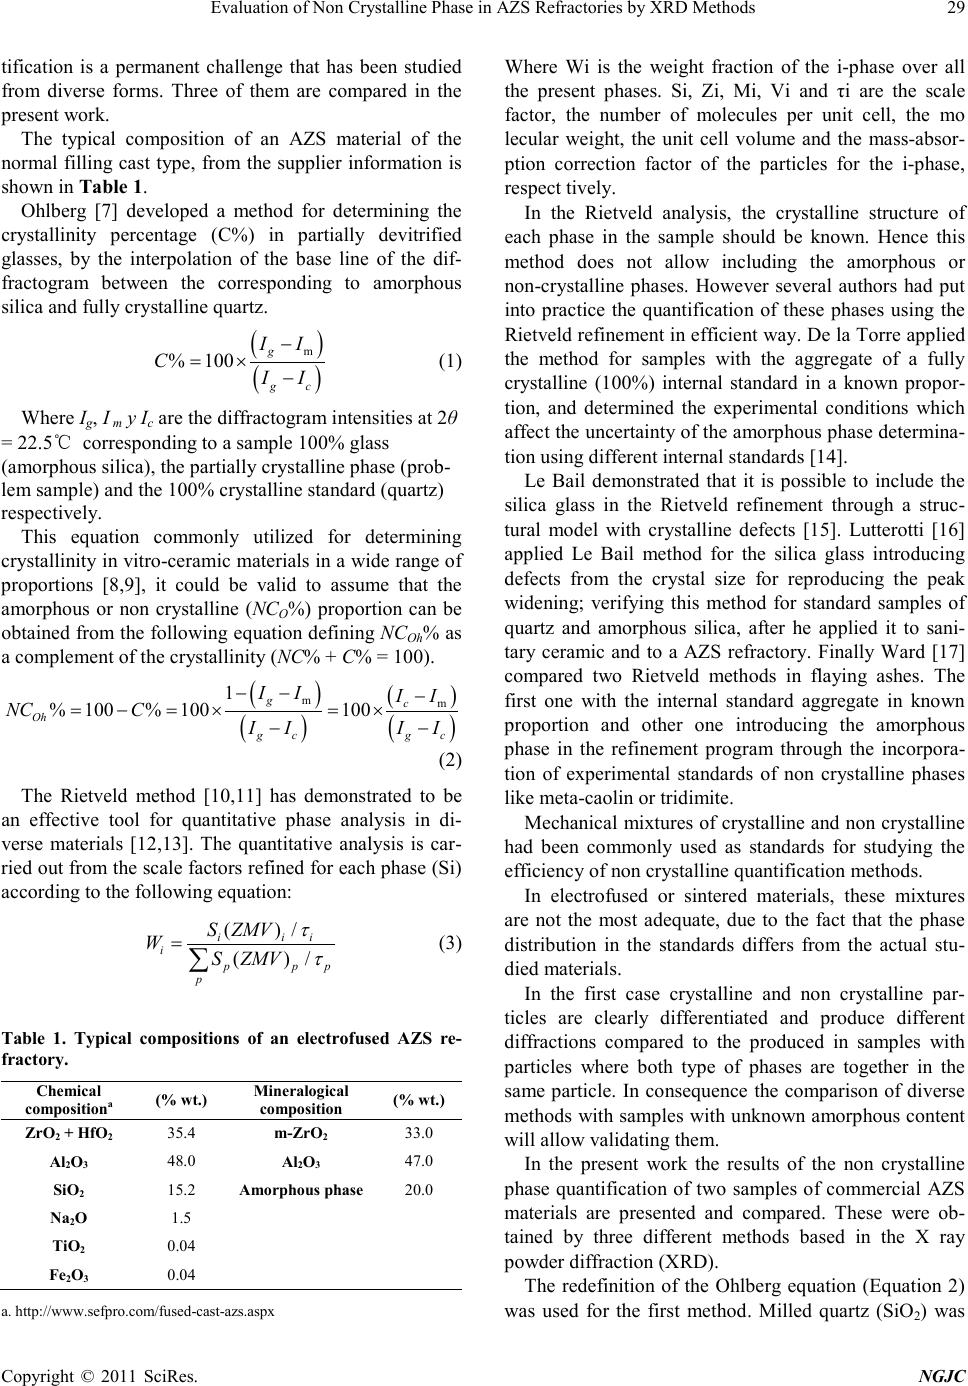 Eva lua t ion of Non Crystalline Phase in AZ S Refr actories by XRD Methods Copyright © 2011 SciRes. NGJC 29 tification is a permanent challenge that has been studied from diverse forms. Three of them are compared in the present wor k. The typical composition of an AZS material of the normal filling cast type, from the supplier information is sho wn in Table 1 . Ohlberg [7] developed a method for determining the crystallinity percentage (C%) in partially devitrified glasses, by the interpolation of the base line of the dif- fractogram between the corresponding to amorphous silica and fully crystalline quartz. ( ) ( ) m % 100g gc II CII − = ×− (1) Where Ig, I m y Ic are the diffractogram intensities at 2θ = 22.5℃ corresponding to a sample 100% glass (amorphous silica), the partiall y crystalline phase (prob- lem sample) and the 100% crystalline standard (quartz) respectively. This equation commonly utilized for determining crystallinity i n vitro-ceramic materials in a wide range of proportions [8,9], it could be valid to assume that the amorphous or non crystalline (NCO%) proportion can be obtained from the following e quation defining NCOh% as a compleme nt of the crystallinity (NC% + C% = 100). ( ) ( ) ( ) ( ) mm 1 % 100% 100100 gc Oh gc gc II II NC CII II −− − =−=× =× −− (2) The Rietveld method [10,11] has demonstrated to be an effective tool for quantitative phase analysis in di- verse materials [12,13]. The quantitative analysis is car- ried out from the scale factors refined for each phase (Si) according to the following equation: ( )/ ( )/ i ii ip pp p S ZMV WS ZMV τ τ = ∑ (3) Table 1. Typical compositions of an electrofused AZS re- fract ory . Chemical compositiona (% wt.) Mi neralo g ical composition (% wt.) ZrO2 + HfO2 35.4 m-ZrO2 33.0 Al2O3 48.0 Al 2O3 47.0 SiO2 15.2 Amorphous phase 20.0 Na2O 1.5 TiO2 0.04 Fe2O3 0.04 a. http://www.sefpro.com/fused-cast -azs.a spx Where Wi is the weight fraction of the i-phase over all the present phases. Si, Zi, Mi, Vi and τi are the scale factor, the number of molecules per unit cell, the mo lecular weight, the unit cell volume and the mass-absor- ption correction factor of the particles for the i-phase, respect tively. In the Rietveld analysis, the crystalline structure of each phase in the sample should be known. Hence this method does not allow including the amorphous or non-crystalline phases. However several authors had put into practice the quantification of these phases using the Rietveld refi nement i n efficie nt way. De la T orre applied the method for samples with the aggregate of a fully crystalline (100%) internal standard in a known propor- tion, and determined the experimental conditions which affect the uncertainty of the amorphous phase determina- tion using different internal s tandards [14]. Le Bail demonstrated that it is possible to include the silica glass in the Rietveld refinement through a struc- tural model with crystalline defects [15]. Lutterotti [16] applied Le Bail method for the silica glass introducing defects from the crystal size for reproducing the peak widening; verifying this method for standard samples of quartz and amorphous silica, after he applied it to sani- tary ceramic and to a AZS refractory. Finally Ward [17] compared two Rietveld methods in flaying ashes. The first one with the internal standard aggregate in known proportion and other one introducing the amorphous phase in the refinement program through the incorpora- tion of experimental standards of non crystalline phases like meta-caolin or tr idimite. Mechanical mixtures of crystalline and non crystalline had been commonly used as standards for studying the efficiency of non c ryst all ine quantifi cation methods. In electrofused or sintered materials, these mixtures are not the most adequate, due to the fact that the phase distribution in the standards differs from the actual stu- died materials. In the first case crystalline and non crystalline par- ticles are clearly differentiated and produce different diffractions compared to the produced in samples with particles where both type of phases are together in the same particle. In consequence the comparison of diverse metho ds with sa mples with u nknown a morp hous cont ent will allow validating them. In the present work the results of the non crystalline phase quantification of two samples of commercial AZS materials are presented and compared. These were ob- tained by three different methods based in the X ray powder diffraction (XRD). The redefinition of the Ohlberg equation (Equation 2) was used for the first method. Milled quartz (SiO2) was 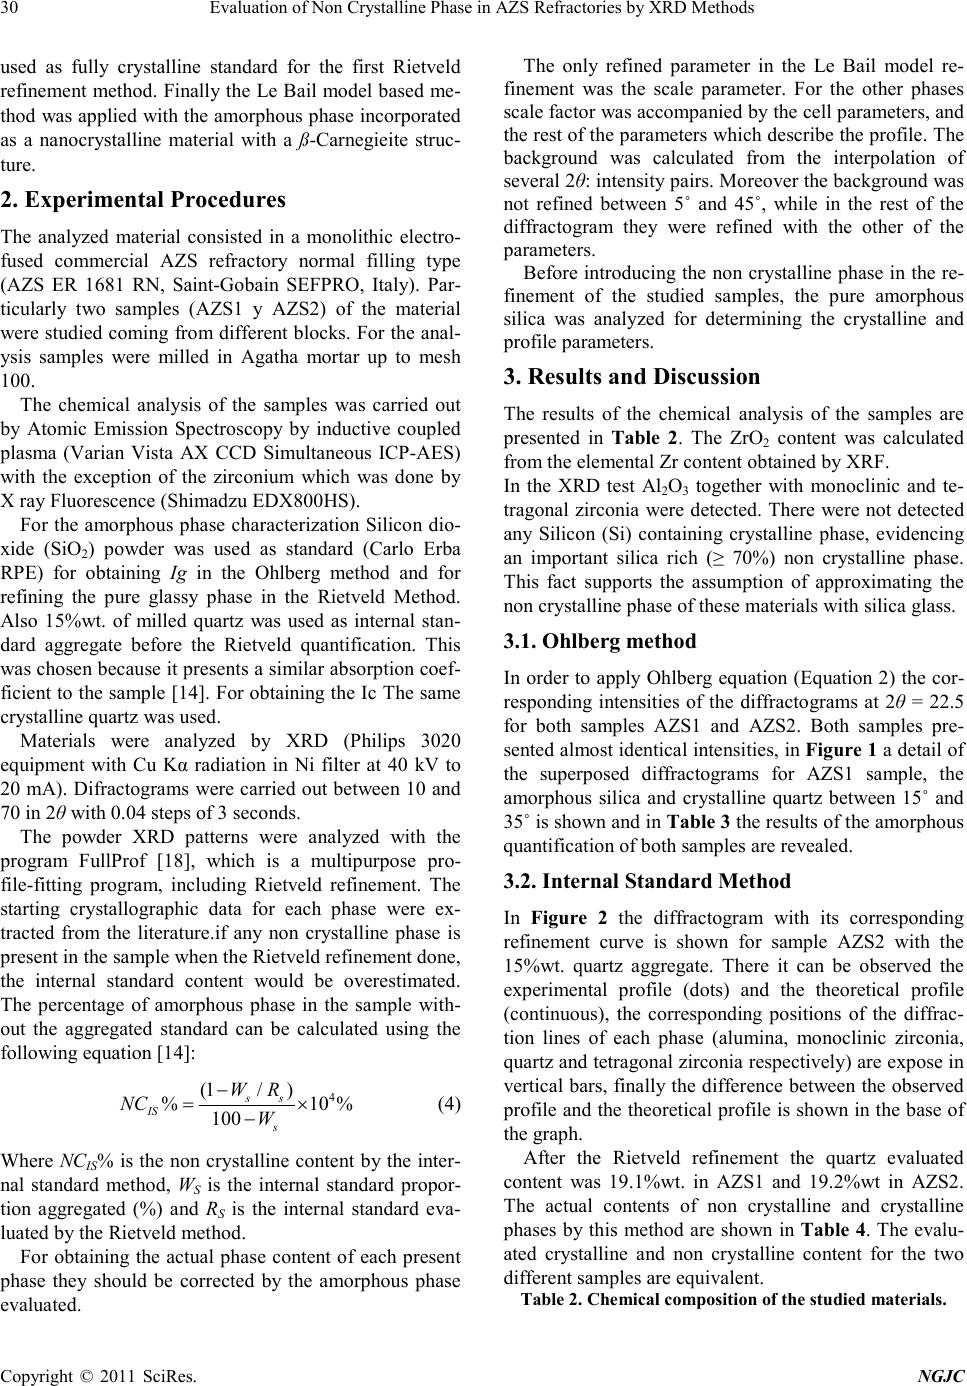 Eva lua t ion of Non Crystalline Phase in AZS Refracto r ies by XRD M ethods Copyright © 2011 SciRes. NGJC 30 used as fully crystalline standard for the first Rietveld refinement method. Finally the Le Bail model based me- thod was applied with the amorphous phase incorporated as a nanocrystalline material with a ß-Carnegieite struc- ture. 2. Experimental Procedures The analyzed material consisted in a monolithic electro- fuse d commercial AZS refractory normal filling type (AZS ER 1681 RN, Saint-Gobain SEFPRO, Italy). Par- ticularly two samples (AZS1 y AZS2) of the material were studied coming from different blocks. For the anal- ysis samples were milled in Agatha mortar up to mesh 100. The chemical analysis of the samples was carried out by Atomic Emission Spectroscopy by inductive coupled plasma (Varian Vista AX CCD Simultaneous ICP-AES) with the exception of the zirconium which was done by X ray Fl uorescence (Shimadzu EDX800HS). For the amorpho us phase characterization Silicon dio- xide (SiO2) powder was used as standard (Carlo Erba RPE) for obtaining Ig in the Ohlberg method and for refining the pure glassy phase in the Rietveld Method. Also 15%wt. of milled quartz was used as internal stan- dard aggregate before the Rietveld quantification. This was chosen because it presents a similar absorption coef- ficient to the sample [14]. For obtaining the Ic T he same crystalline quartz was used. Materials were analyzed by XRD (Philips 3020 equipment with Cu Kα radiation in Ni filter at 40 kV to 20 mA). D ifractograms were carried out between 10 and 70 in 2θ with 0.04 steps of 3 seconds. The powder XRD patterns were analyzed with the program FullProf [18], which is a multipurpose pro- file-fitting program, including Rietveld refinement. The starting crystallographic data for each phase were ex- tracted from the literature.if any non crystalline phase is present in the sample when the Rietveld refinement done, the internal standard content would be overestimated. The percentage of amorphous phase in the sample with- out the aggregated standard can be calculated using the following equation [14]: 4 (1/ ) %10 % 100 ss IS s WR NC W − = × − (4) Where NCIS% is the non cr ystalline content by the inter- nal standard method, WS is the internal standard propor- tion aggregated (%) and RS is the internal standard eva- luated by the Rietveld method. For obtaining the actual phase content of each present phase they should be corrected by the amorphous phase evaluated. The only refined parameter in the Le Bail model re- finement was the scale parameter. For the other phases scale factor was accompanied by the cell parameters, and the rest of the parameters which describe the profile. The background was calculated from the interpolation of several 2θ: intensity pairs. Moreover the background was not refined between 5˚ and 45˚, while in the rest of the diffractogram they were refined with the other of the parameters. Befo re intro ducing the no n crystal line p hase i n the re- finement of the studied samples, the pure amorphous silica was analyzed for determining the crystalline and profile parameters. 3. Results and Discussion The results of the chemical analysis of the samples are presented in Table 2. The ZrO2 content was calculated from the ele mental Zr content obtained by XRF. In the XRD test Al2O3 together with monoclinic and te- tragonal zirconia were detected. There were not detected any Silicon (Si) containing crystalline phase, evidencing an important silica rich (≥ 70%) non crystalline phase. This fact supports the assumption of approximating the non crystalline phase of these materials wi th silica glass. 3.1. Ohlberg method In order to apply Ohlberg equation (Equation 2) the cor- responding intensities of the diffractograms at 2θ = 22.5 for both samples AZS1 and AZS2. Both samples pre- sented almost ide ntical intensi ties, in Figure 1 a detail of the superposed diffractograms for AZS1 sample, the amorphous silica and crystalline quartz between 15˚ and 35˚ is shown and i n Table 3 the results of the amorphous quantification of both samples are revealed. 3.2. Internal Standard Method In Figure 2 the diffractogram with its corresponding refinement curve is shown for sample AZS2 with the 15%wt. quartz aggregate. There it can be observed the experimental profile (dots) and the theoretical profile (continuous), the corresponding positions of the diffrac- tion lines of each phase (alumina, monoclinic zirconia, quartz and tetragonal zirconia respectively) are expose in vertical bars, finally the difference between the observed profile and the theoretical pr ofile is shown in the base of the graph. After the Rietveld refinement the quartz evaluated content was 19.1%wt. in AZS1 and 19.2%wt in AZS2. The actual contents of non crystalline and crystalline phases by this method are shown in Table 4. T he evalu- ated crystalline and non crystalline content for the two different samples are equivalent. Table 2. Chemical composition of the studied materials. 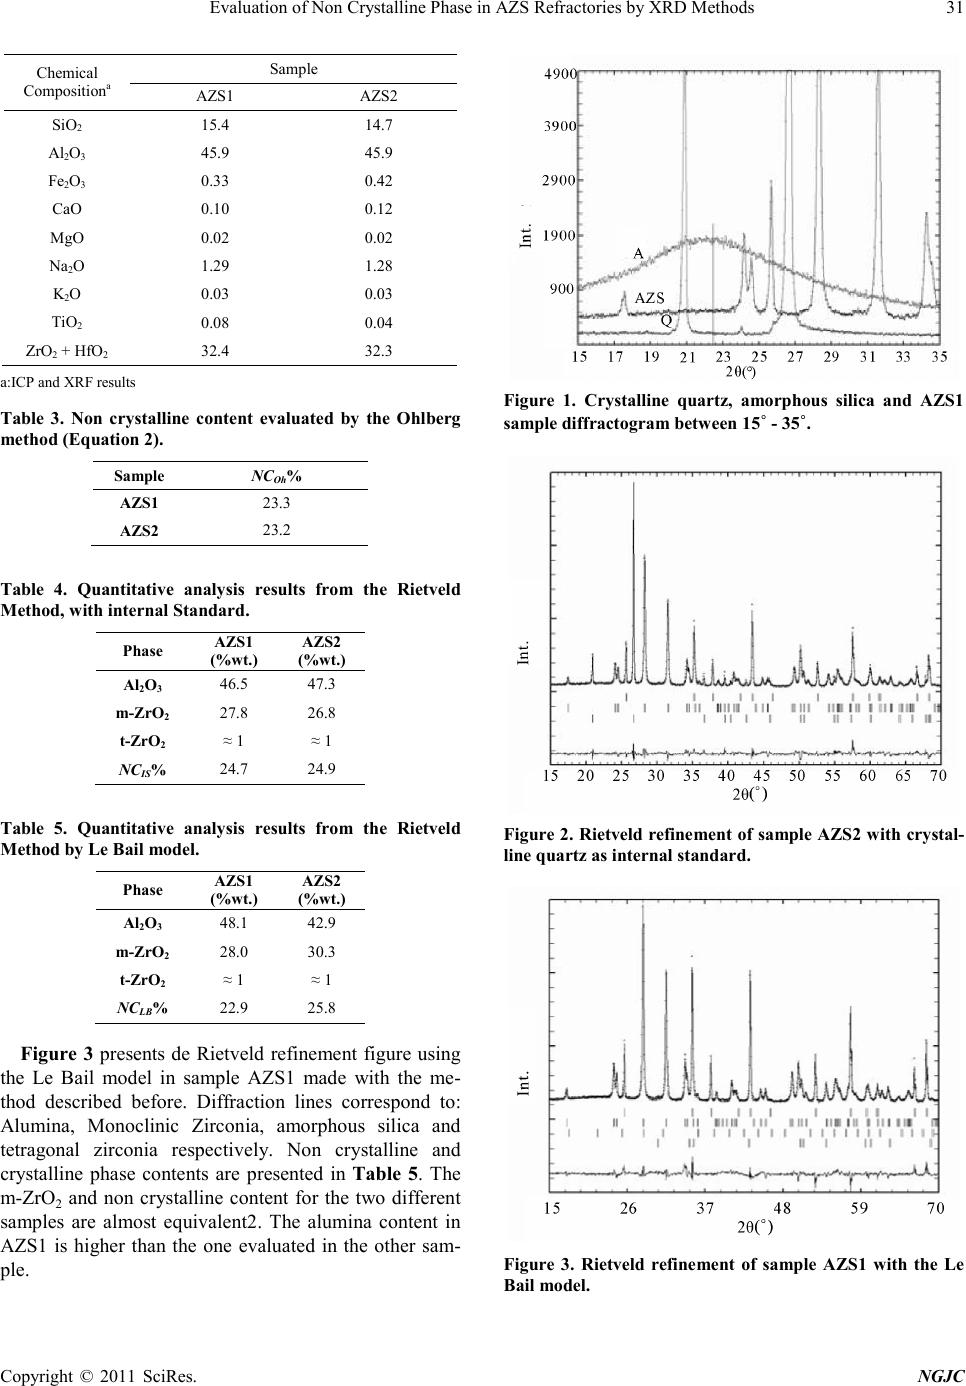 Eva lua t ion of Non Crystalline Phase in AZ S Refr actories by XRD Methods Copyright © 2011 SciRes. NGJC 31 Chemical Compositiona Samp le AZS1 AZS2 SiO2 15.4 14.7 Al2O3 45.9 45.9 Fe2O3 0.33 0.42 CaO 0.10 0.12 MgO 0.02 0.02 Na2O 1.29 1.28 K2O 0.03 0.03 TiO2 0.08 0.04 ZrO2 + HfO2 32.4 3 2.3 a:ICP and XRF results Table 3. Non crystalline content evaluated by the Ohlberg me thod (Equa ti o n 2). Sample NCOh% AZS1 23.3 AZS2 23.2 Table 4. Quantitative analysis results from the Rietveld Me thod, with inte rnal Standard. Phase AZS1 (%wt.) AZS2 (%wt.) Al2O3 46.5 47.3 m-ZrO2 27.8 26.8 t-ZrO2 ≈ 1 ≈ 1 NCIS% 24.7 24.9 Table 5. Quantitative analysis results from the Rietveld Me thod by Le Bail model. Phase AZS1 (%wt.) AZS2 (%wt.) Al2O3 48.1 42.9 m-ZrO2 28.0 30.3 t-ZrO2 ≈ 1 ≈ 1 NCLB% 22.9 25.8 Figure 3 presents de Rietveld refinement figure using the Le Bail model in sample AZS1 made with the me- thod described before. Diffraction lines correspond to: Alumina, Monoclinic Zirconia, amorphous silica and tetragonal zirconia respectively. Non crystalline and crystalline phase contents are presented in Table 5. The m-ZrO 2 and non crystalline content for the two different samples are almost equivalent2. The alumina content in AZS1 is higher than the one evaluated in the other sam- ple. Figure 1. Crystalline quartz, amorphous silica and AZS1 sample diff ract ogra m between 1 5˚ - 35 ˚. Figure 2. Rietveld refine ment of sample AZS2 w ith crystal- line quartz as int ernal standard. Figure 3. Rietveld refinement of sample AZS1 with the Le Bail model. 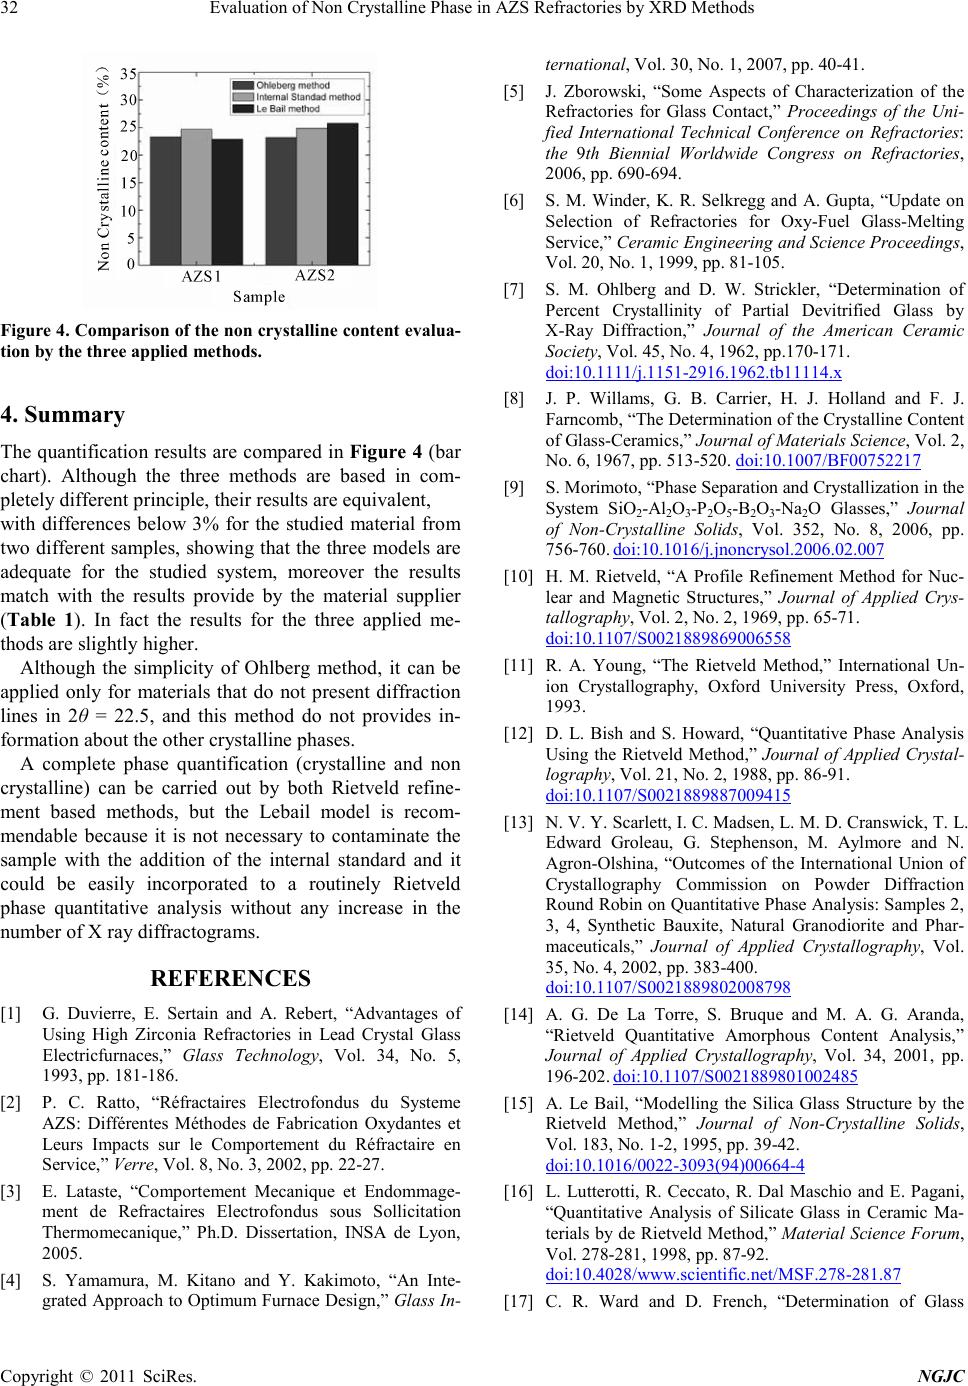 Eva lua t ion of Non Crystalline Phase in AZS Refracto r ies by XRD M ethods Copyright © 2011 SciRes. NGJC 32 Figure 4. Co mpari so n of t he non cry st alli ne c ont ent eval ua- tion by the three appl ied methods. 4. Summary The quantification results are compared in Figure 4 (bar chart). Although the three methods are based in com- pletely different principle, their re sults are e quivalent, with differences below 3% for the studied material from two di fferent samples , showi ng that t he three models are adequate for the studied system, moreover the results match with the results provide by the material supplier (Table 1). In fact the results for the three applied me- thods are slightl y hi g her . Although the simplicity of Ohlberg method, it can be applied only for materials that do not present diffraction lines in 2θ = 22.5, and this method do not provides in- formation ab out the other crystalline phases. A complete phase quantification (crystalline and non crystalline) can be carried out by both Rietveld refine- ment based methods, but the Lebail model is recom- mendable because it is not necessary to contaminate the sample with the addition of the internal standard and it could be easily incorporated to a routinely Rietveld phase quantitative analysis without any increase in the number of X ray diffractograms. REFERENCES [1] G. Duvierre, E. Sertain and A. Rebert, “Advantages of Using High Zirconia Refractories in Lead Crystal Glass Electricfurnaces,” Glass Technology, Vol. 34, No. 5, 1993, pp . 181-186. [2] P. C. Ratto, “Réfractaires Ele ctrofondus du Systeme AZS: Différentes Méthodes de Fabrication Oxydantes et Leurs Impacts sur le Comportement du Réfractaire en Service,” Verre, Vol. 8, No. 3, 2002, pp. 22-27. [3] E. Lataste, “Comportement Mecanique et Endommage- ment de Refractaires Electrofondus sous Sollicitation Thermomecanique,” Ph.D. Dissertation, INSA de Lyon, 2005. [4] S. Yamamura, M. Kitano and Y. Kakimoto, “An Inte- grated Approach to Optimum Furnace Design,” Glass In- ternational, Vol. 30, No. 1, 2007, pp. 40-41. [5] J. Zborowski, “Some Aspects of Characterization of the Refractories for Glass Contact,” Proceedings of the Uni- fied International Technical Conference on Refractories: the 9th Biennial Worldwide Congress on Refractories, 2006, pp . 690-694. [6] S. M. Winder, K. R. Selkregg an d A. Gupta, “Update on Selection of Refractories for Oxy-Fuel Glass-Melting Service,” Ceramic Engineering and Science Proceedings, Vol. 2 0, No . 1, 1999, pp. 81-105. [7] S. M. Ohlberg and D. W. Strickler, “Determination of Percent Crystallinity of Partial Devitrified Glass by X-Ray Diffraction,” Journal of the American Ceramic Soci ety, Vol. 45, N o. 4, 1962, pp.170-171. doi:10.1111/j.1151-2916.1962.tb11114.x [8] J. P. Willams, G. B. Carrier, H. J. Holland and F. J. Farnco mb, “The Determination of the Crystalline Content of Gl a s s -Cer amics,” Journal of Materials Science, Vol. 2, No. 6, 1967, pp. 513-520. doi:10.1007/BF00752217 [9] S. Morimoto, “Phase Separation and Crystallization in the System SiO2-Al2O3-P2O5-B2O3-Na2O Glasses,” Journal of Non-Crystalline Solids, Vol. 352, No. 8, 2006, pp. 756-760. doi:10.1016/j.jnoncrysol.2006.02.007 [10] H. M. Rietveld, “A Profile Refinement Method for Nuc- lear and Magnetic Structures ,” Journal of Applied Crys- tallography, Vol. 2, No. 2, 19 69 , pp. 65 -71. doi:10.1107/S0021889869006558 [11] R. A. Young, “The Rietveld Method,” International Un- ion Crystallography, Oxford University Press, Oxford, 1993. [12] D. L. Bish and S. Howard, “Quantitative Phase Analysis Using the Rietveld Method,” Journal of Applied Crystal- lography, Vol. 21, No. 2, 1988, pp. 86-91. doi:10.1107/S0021889887009415 [13] N. V. Y. S carlet t, I. C . Mads en, L. M. D. Cranswick, T. L. Edward Groleau, G. Stephenson, M. Aylmore and N. Agron -Ol shina, “Outcomes of the International Union of Crystallography Commission on Powder Diffraction Round Robin on Quantitative Phase Analysis: Samples 2, 3, 4, Synthetic Bauxite, Natural Granodiorite and Phar- maceuticals,” Journal of Applied Crystallography, Vol. 35, No. 4, 20 02, pp. 38 3-400. doi:10.1107/S0021889802008798 [14] A. G. De La Torre, S. Bruque and M. A. G. Aranda, “Rietveld Quantitative Amorphous Content Analysis,” Journal of Applied Crystallography, Vol. 34, 2001, pp. 196-202. doi:10.1107/S0021889801002485 [15] A. Le Bail, “Modelling the Silica Glass Structure by the Rietveld Method ,” Journal of Non-Crystalline Solids, Vol. 183, No. 1-2, 1995, pp. 39-42. doi:10.1016/0022-3093(94 ) 00 66 4-4 [16] L. Lutterotti, R. Ceccato, R. Dal Maschio and E. Pagani, “Quantitative Analysis of Silicate Glass in Ceramic Ma- terials b y de Riet veld Met hod,” Material Science Forum, Vol. 278-28 1, 19 98, pp. 87-92. doi:10.4028/www.scientific.net/MSF.278-281.87 [17] C. R. Ward and D. French, “Determination of Glass  Eva lua t ion of Non Crystalline Phase in AZ S Refr actories by XRD Methods Copyright © 2011 SciRes. NGJC 33 Content and Estimation of Glass Co mposition in F ly Ash Using Quantitative X-Ray Diffractometry,” Fuel, Vol. 85, 2006 , pp. 22 68–2277. doi:10.1016/j.fuel.2005.12.026 [18] J. Rodríguez-Carvajal, “Recent Developments of the Program Fullprof,” Newsletter in Commission on Powder Diffraction (IUCr), Vol. 26, 2001. |