

Paper Menu >>
Journal Menu >>
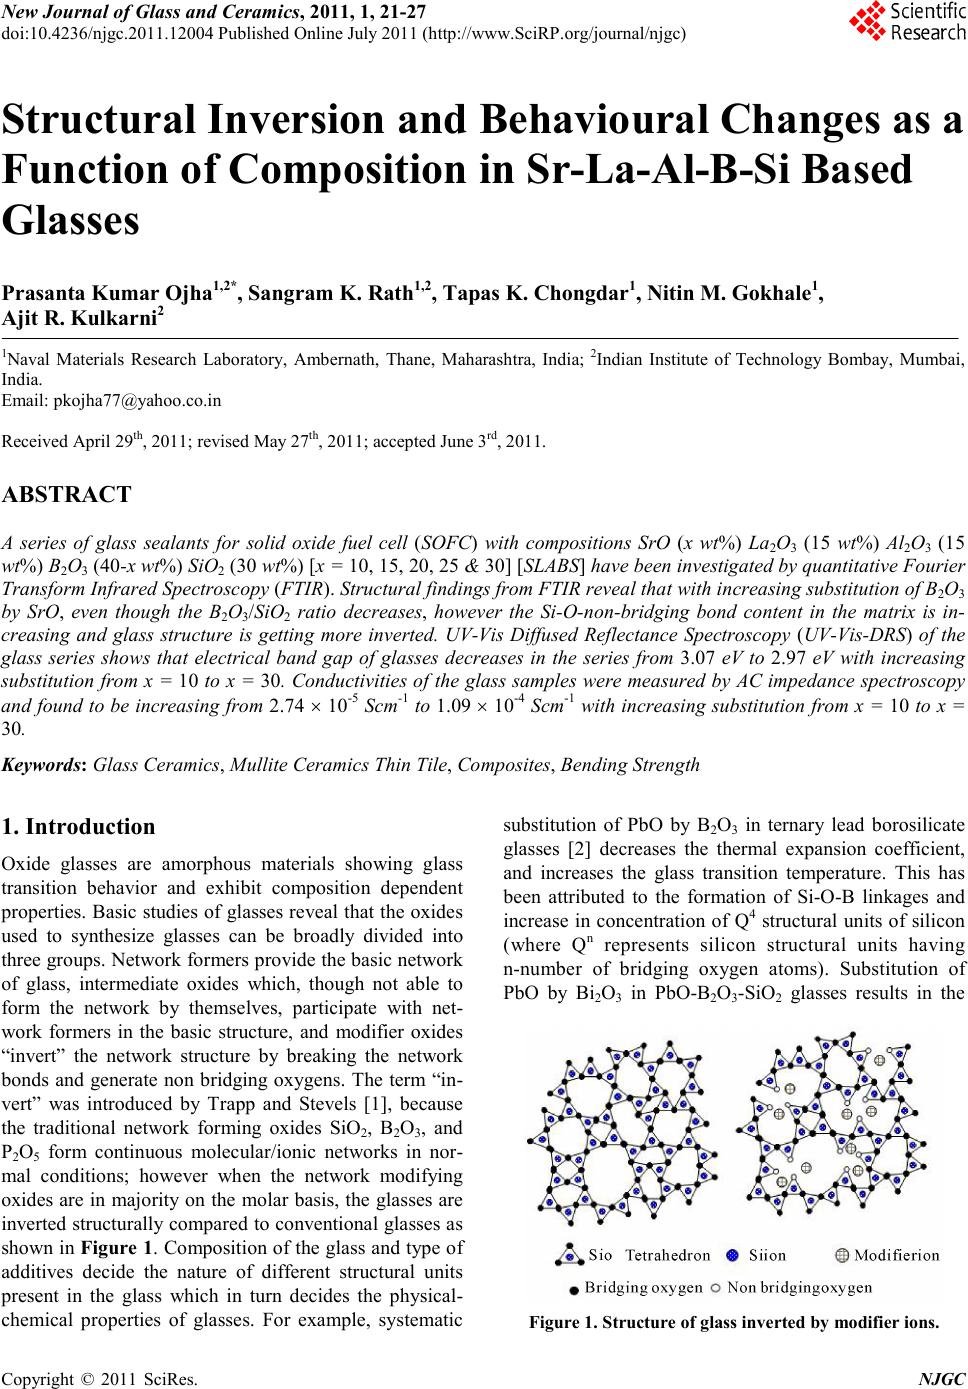 New Journal of Glass and Ceramics, 2011, 1, 21-27 doi:10.4236/njgc.2011 .12004 Published Online July 2011 (http://www.SciRP.org/journal/njgc) Copyright © 2011 SciRes. NJGC 21 Structural Inversion and Behavioural Changes as a Function of Composition in Sr-La-Al-B-Si Based Glasses Prasanta Kumar Ojha1,2*, Sangram K. Rath1,2, Tapas K. Chongdar1, Nitin M. Gokhale1, Ajit R. Kulkarni2 1Naval Materials Research Laboratory, Ambernath, Thane, Maharashtra, India; 2Indian Institute of Technology Bombay, Mumbai, India. Email: [email protected] Received April 29th, 2011; revised May 27th, 2011; accepted June 3rd, 2011. ABSTRACT A series of glass sealants for solid oxide fuel cell (SOFC) with compositions SrO (x wt%) La2O3 (15 wt%) Al2O3 (15 wt%) B2O3 (40-x wt%) SiO2 (30 wt%) [x = 10, 15, 20, 25 & 30] [SLABS] have been investigated by quantitative Fourier Transform Infrared Spectroscopy (FTIR). Structural findings from FTIR reveal that with increasing substitution of B2O3 by SrO, even though the B2O3/SiO2 ratio decreases, however the Si-O-non-bridging bond content in the matrix is in- creasing and glass structure is getting more inverted. UV-Vis Diffused Reflectance Spectroscopy (UV-Vis-DRS) of the glass series shows that electrical band gap of glasses decreases in the series from 3.07 eV to 2.97 eV with increasing substitution from x = 10 to x = 30. Conductivities of the glass samples were measured by AC impedance spectroscopy and found to be increasing from 2.74 × 10⁻⁵ Scm-1 to 1.09 × 10⁻⁴ Scm-1 with increasing substitution from x = 10 to x = 30. Keywords: Glass Cera mics, Mu llite Ceramics Thin Tile, Composites, Bending Strength 1. Introduction Oxide glasses are amorphous materials showing glass transition behavior and exhibit composition dependent properties. Basic studies of glasses reveal that the oxides used to synthesize glasses can be broadly divided into three groups. Network formers provide the basic network of glass, intermediate oxides which, though not able to form the network by themselves, participate with net- work formers in the basic structure, and modifier oxides “invert” the network structure by breaking the network bonds and generate non bridging oxygens. T he term “in- vert” was introduced by Trapp and Stevels [1], because the traditional network forming oxides SiO2, B2O3, and P2O5 form continuous molecular/ionic networks in nor- mal conditions; however when the network modifying oxides are in majorit y on the molar ba sis, the glas ses are invert ed str uctur all y compare d to convent iona l glasse s as sho wn in Figur e 1. Composition of the glass and type of additives decide the nature of different structural units present in the glass which in turn decides the physical- chemical properties of glasses. For example, systematic substitution of PbO by B2O3 in ternary lead borosilicate glasses [2] decreases the thermal expansion coefficient, and increases the glass transition temperature. This has been attributed to the formation of Si-O-B linkages and increase in concentration of Q4 structural units of silicon (where Qn represents silicon structural units having n-number of bridging oxygen atoms). Substitution of PbO by Bi2O3 in PbO-B2O3-SiO2 glasses results in the Figure 1. Structure of glass inverte d by modifier ions. 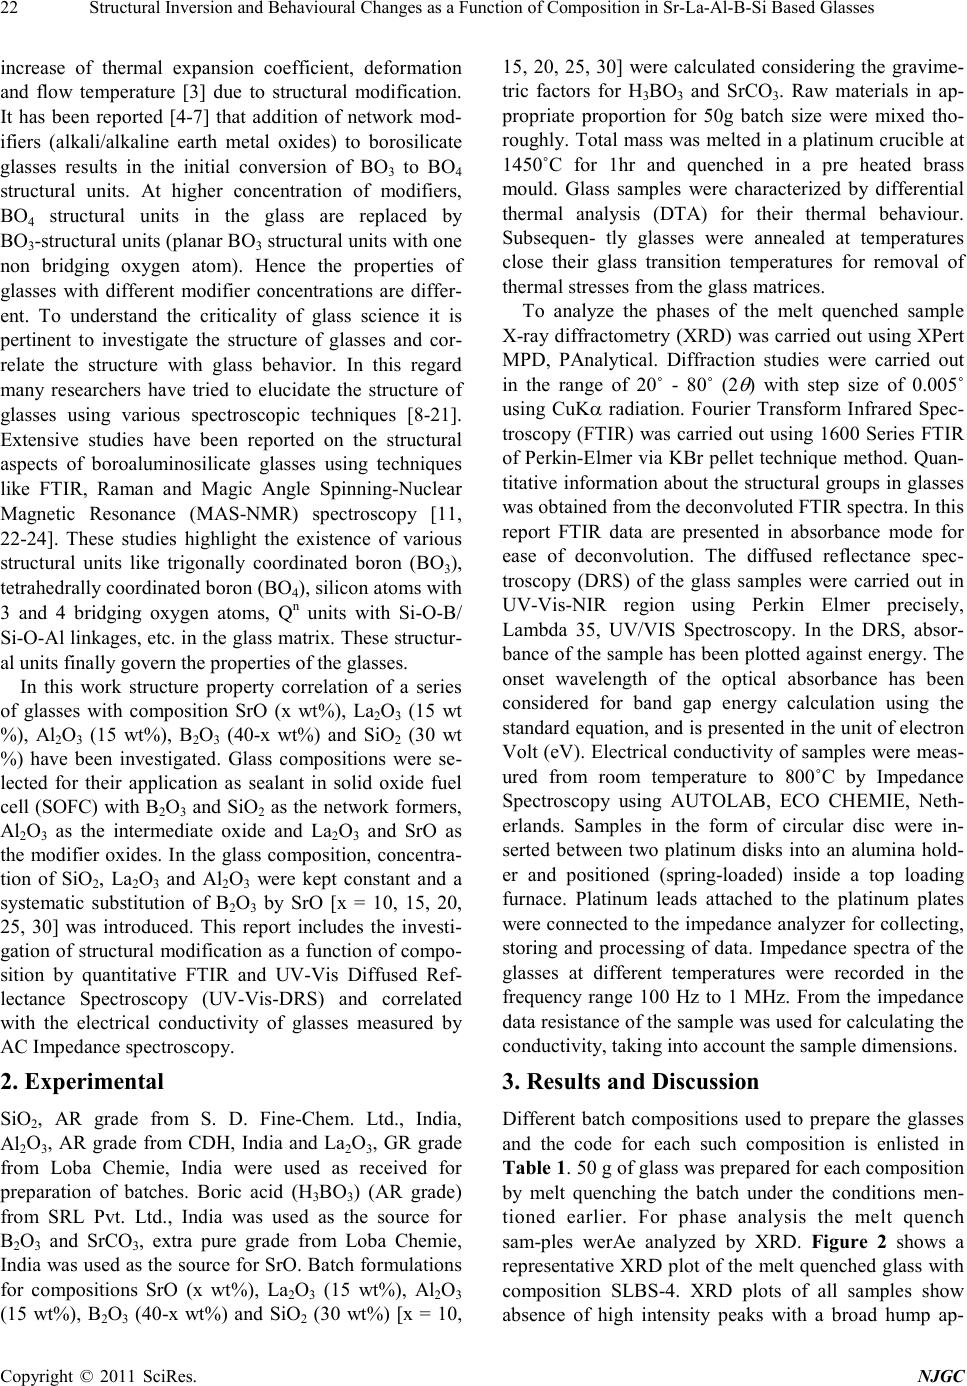 Stru ctural Inversion and Behavioural Changes as a Function of Composition in Sr-La-Al-B-Si Based Glasses Copyright © 2011 SciRes. NJGC 22 increase of thermal expansion coefficient, deformation and flow temperature [3] due to structural modification. It has been reported [4-7] that addition of network mod- ifiers (alkali/alkaline earth metal oxides) to borosilicate glasses results in the initial conversion of BO3 to BO4 structural units. At higher concentration of modifiers, BO4 structural units in the glass are replaced by BO3-structural units (pla nar B O3 s tr uct ur al u nit s wit h o ne non bridging oxygen atom). Hence the properties of glasses with different modifier concentrations are differ- ent. To understand the criticality of glass science it is pertinent to investigate the structure of glasses and cor- relate the structure with glass behavior. In this regard many researchers have tried to elucidate the structure of glasses using various spectroscopic techniques [8-21]. Extensive studies have been reported on the structural aspects of boroaluminosilicate glasses using techniques like FTIR, Raman and Magic Angle Spinning-Nuclear Magnetic Resonance (MAS-NMR) spectroscopy [11, 22-24]. These studies highlight the existence of various structural units like trigonally coordinated boron (BO3), tetrahedrally coordinated boron (BO4), silicon a toms with 3 and 4 bridging oxygen atoms, Qn units with Si-O-B/ Si-O-Al linkages, etc. in the glass matrix. T hese structur- al units finally govern the properties of t he gla sses. In this work structure property correlation of a series of glasses with composition SrO (x wt%), La2O3 (15 wt %), Al2O3 (15 wt%), B2O3 (40-x wt%) and SiO2 (30 wt %) have been investigated. Glass compositions were se- lected for their application as sealant in solid oxide fuel cell (SOFC) wit h B2O3 and SiO2 as the network formers, Al2O3 as the intermediate oxide and La2O3 and SrO as the mod ifier o xides. I n the gl ass co mposit ion, co ncentr a- tion of SiO2, La2O3 and Al2O3 were kept constant and a systematic substitution of B2O3 by SrO [x = 10, 15, 20, 25, 30] was introduced. This report includes the investi- gatio n of struc tural modification as a function of compo- sition by quantitative FTIR and UV-Vis Diffused Ref- lectance Spectroscopy (UV-Vis-DRS) and correlated with the electrical conductivity of glasses measured by AC Impedance spectroscopy. 2. Experimental SiO2, AR grade from S. D. Fine-Chem. Ltd., India, Al2O3, AR grade from CDH, India and La2O3, GR grade from Loba Chemie, India were used as received for preparation of batches. Boric acid (H3BO3) (AR grade) from SRL Pvt. Ltd., India was used as the source for B2O3 and SrCO3, extra pure grade from Loba Chemie, India was used as the source for SrO. Batch formulations for compositions SrO (x wt%), La2O3 (15 wt%), Al2O3 (15 wt%), B2O3 (40-x wt%) and SiO2 (30 wt%) [x = 10, 15, 20, 25, 30] were calculated considering the gravime- tric factors for H3BO3 and SrCO3. Raw materials in ap- propriate proportion for 50g batch size were mixed tho- roughly. To tal mass was melted in a platinum crucib le at 1450˚C for 1hr and quenched in a pre heated brass mould. Glass samples were characterized by differential thermal analysis (DTA) for their thermal behaviour. Subsequen- tly glasses were annealed at temperatures close their glass transition temperatures for removal of thermal stresses fro m the glass matrices. To analyze the phases of the melt quenched sample X-ray diffractometry (XRD) was carried out using XPert MPD, PAnalytical. Diffraction studies were carried out in the range of 20˚ - 80˚ (2 θ ) with step size of 0.005˚ using CuKα radiation. Fourier Transform Infrared Spec- troscopy (FTIR) was carried out using 1600 Series FTIR of P erkin-El mer via KBr pellet technique method. Quan- titative informatio n about the structura l groups in glasses was obtained from the deconvoluted FTIR spectra. In this report FTIR data are presented in absorbance mode for ease of deconvolution. The diffused reflectance spec- troscopy (DRS) of the glass samples were carried out in UV-Vis-NIR region using Perkin Elmer precisely, Lambda 35, UV/VIS Spectroscopy. In the DRS, absor- bance of the sample has been plotted against energy. The onset wavelength of the optical absorbance has been considered for band gap energy calculation using the standard equation, and is presented in the unit of electron Volt (eV). Electrical conductivity of samples were meas- ured from room temperature to 800˚C by Impedance Spectroscopy using AUTOLAB, ECO CHEMIE, Neth- erlands. Samples in the form of circular disc were in- serted between two platinum disks into an alumina hold- er and positioned (spring-loaded) inside a top loading furnace. Platinum leads attached to the platinum plates were connected to the impedance analyzer for collecting, storing and processing of data. Impedance spectra of the glasses at different temperatures were recorded in the frequency range 100 Hz to 1 MHz. From the impedance data resistance of the sample was used for calcula tin g the conductivity, taking into account the sample di mensions. 3. Results and Discussion Different batch compositions used to prepare the glasses and the code for each such composition is enlisted in Table 1. 50 g of glass was prepared for each composition by melt quenching the batch under the conditions men- tioned earlier. For phase analysis the melt quench sam-ples werAe analyzed by XRD. Figure 2 shows a representative XRD plo t of the melt quenched glass wi th composition SLBS-4. XRD plots of all samples show absence of high intensity peaks with a broad hump ap- 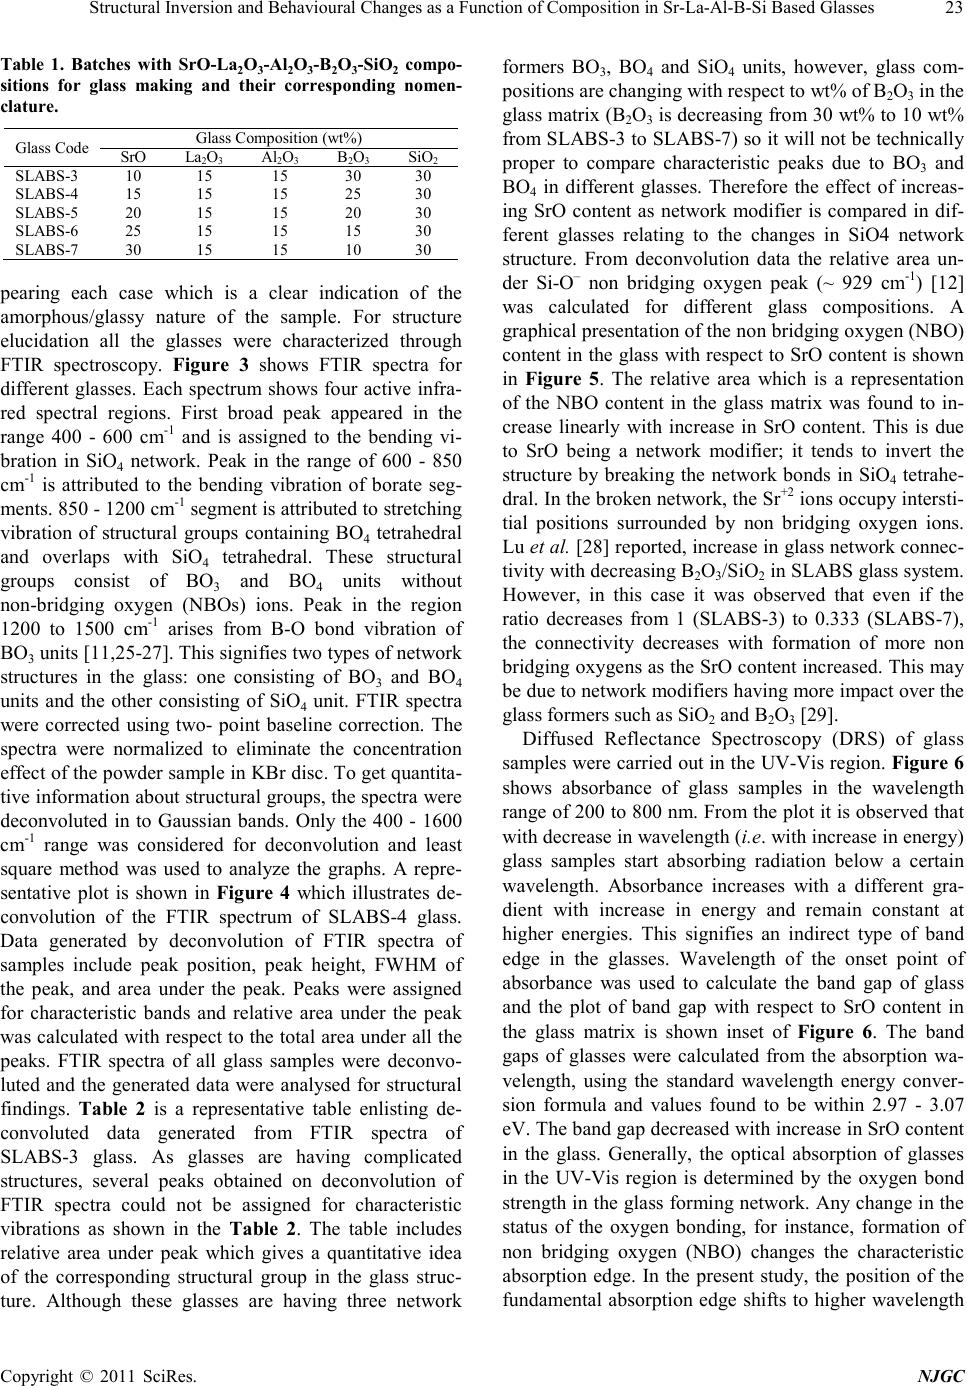 Structural Inversion and Behavioural Changes as a Function of Composition in Sr-La-Al-B-Si Bas ed Gla sses Copyright © 2011 SciRes. NJGC 23 Table 1. Batches with SrO-La2O3-Al2O3-B2O3-SiO2 compo- sitions for glass making and their corresponding nomen- clature. Glass Code Glass Composition (wt%) SrO La 2 O 3 Al 2 O 3 B 2 O 3 SiO 2 S LABS -3 10 15 15 30 30 S LABS -4 15 15 15 25 30 S LABS -5 20 15 15 20 30 S LABS -6 25 15 15 15 30 S LABS -7 30 15 15 10 30 pearing each case which is a clear indication of the amo rphous/glassy nature of the sample. For structure elucidation all the glasses were characterized through FTIR spectroscopy. Figure 3 shows FTIR spectra for different glasses. Each spectrum shows four active infra- red spectral regions. First broad peak appeared in the range 400 - 600 cm-1 and is assigned to the bending vi- bration in SiO4 network. Peak in the range of 600 - 850 cm-1 is attributed to the bending vibration of borate seg- ments. 850 - 1200 cm-1 segment is attributed to stre tching vibration of structural groups containing BO4 tetrahedral and overlaps with SiO4 tetrahedral. These structural groups consist of BO3 and BO4 units without non-bridging oxygen (NBOs) ions. Peak in the region 1200 to 1500 cm-1 arises from B-O bond vibration of BO3 units [1 1, 25-27]. This signifies two types of network structures in the glass: one consisting of BO3 and BO4 units and the other consisting of SiO4 unit. FTIR spectra were corrected using two- point baseline correction. The spectra were normalized to eliminate the concentration effect of the po wder sample in KBr disc. To get quantita- tive informatio n about structu ral groups, the spectra were deconvoluted in to Gaussian bands. Only the 400 - 1600 cm-1 range was considered for deconvolution and least square method was used to analyze the graphs. A repre- sentative plot is shown in Figure 4 which illustrates de- convolution of the FTIR spectrum of SLABS-4 glass. Data generated by deconvolution of FTIR spectra of samples include peak position, peak height, FWHM of the peak, and area under the peak. Peaks were assigned for characteristic bands and relative area under the peak was calculated with respect to the total area under all the peaks. FTIR spectra of all glass samples were deconvo- luted and the generated data were analysed for structural findings. Tabl e 2 is a representative table enlisting de- convoluted data generated from FTIR spectra of SLABS-3 glass. As glasses are having complicated structures, several peaks obtained on deconvolution of FTIR spectra could not be assigned for characteristic vibrations as shown in the Table 2. The table includes relative area under peak which gives a quantitative idea of the corresponding structural group in the glass struc- ture. Although these glasses are having three network formers BO3, BO4 and SiO4 units, however, glass com- positions are changing with respect to wt% of B2O3 in the glass matrix (B2O3 is decreasing from 30 wt% to 10 wt% from SLABS-3 to SLABS-7) so it will not be technicall y proper to compare characteristic peaks due to BO3 and BO4 in different glasses. Therefore the effect of increas- ing SrO content as network modifier is compared in dif- ferent glasses relating to the changes in SiO4 network structure. From deconvolution data the relative area un- der Si-O– non bridging oxygen peak (~ 929 cm-1) [12] was calculated for different glass compositions. A grap hic al pr e sent a ti on o f t he no n b r id ging ox yge n (N B O) content in the glass with respect to Sr O content is shown in Figure 5. The relative area which is a representation of the NBO content in the glass matrix was found to in- crease linearly with increase in SrO content. This is due to SrO being a network modifier; it tends to invert the struct ure by breaking the network bonds in SiO4 tetrahe- dra l. I n the br oke n net work, the S r+2 io ns o ccup y i nters ti- tial positions surrounded by non bridging oxygen ions. Lu et al. [28 ] re por ted, incr ease in gla ss net work c o nnec- tivity with decr easing B 2O3/SiO 2 i n S LAB S gl a ss s yst e m. However, in this case it was observed that even if the ratio decreases from 1 (SLABS-3) to 0.333 (SLABS-7), the connectivity decreases with formation of more non bridging oxygens as the SrO content i ncrea se d. T his ma y be due to network modifiers having more impact over the glas s formers s uch as S iO2 and B2O3 [29]. Diffused Reflectance Spectroscopy (DRS) of glass samples were carried out in the UV-Vis region. Figure 6 shows absorbance of glass samples in the wavelength range of 200 to 800 nm. From the plot it is o bserved tha t with decrease in wavelength (i.e. with increase in energy) glass samples start absorbing radiation below a certain wavelength. Absorbance increases with a different gra- dient with increase in energy and remain constant at higher energies. This signifies an indirect type of band edge in the glasses. Wavelength of the onset point of absorbance was used to calculate the band gap of glass and the plot of band gap with respect to SrO content in the glass matrix is shown inset of Figure 6. The band gaps of glasses were calculated from the absorption wa- velength, using the standard wavelength energy conver- sion formula and values found to be within 2.97 - 3.07 eV. The band gap decreased with increase in SrO co ntent in the glass. Generally, the optical absorption of glasses in the UV-Vis region is determined by the oxygen bond stren gth in t he gla ss for ming ne twork. Any c hange i n the status of the oxygen bonding, for instance, formation of non bridging oxygen (NBO) changes the characteristic absorption edge. In the present study, the position of the fundamental absorption edge shifts to higher wavelength 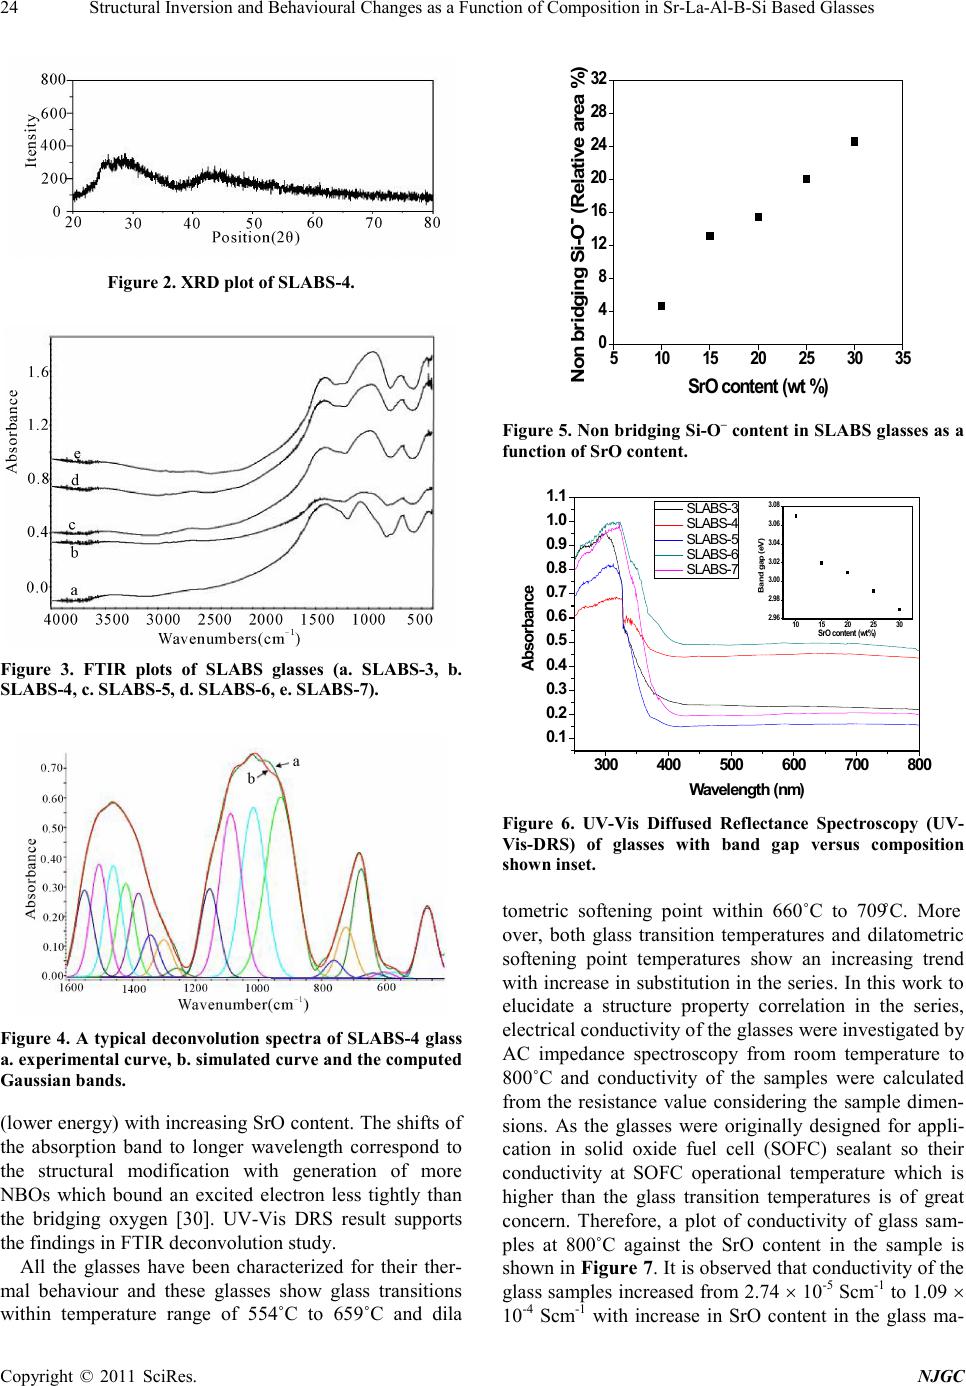 Stru ctural Inversion and Behavioural Changes as a Function of Composition in Sr-La-Al-B-Si Based Glasses Copyright © 2011 SciRes. NJGC 24 Figure 2. XRD plot of SLAB S-4. Figure 3. FTIR plots of SLABS glasses (a. SLABS-3, b. SLABS -4, c. SLABS-5, d. SLABS-6, e. SLABS-7). Figure 4. A ty pical deconv oluti on spect ra of SLA BS-4 glass a. ex perimental c ur ve, b. si mulated c urve a n d the co mput ed Gaussian bands. (lo wer ene rgy) wit h incr eas in g SrO c onte nt. T he shifts o f the absorption band to longer wavelength correspond to the structural modification with generation of more NBOs which bound an excited electron less tightly than the bridging oxygen [30]. UV-Vis DRS result supports the fi ndings in F TIR deconvoluti on st udy. All the glasses have been characterized for their ther- mal behaviour and these glasses show glass transitions within temperature range of 554˚C to 659˚C and dila 510 15 20 25 30 35 0 4 8 12 16 20 24 28 32 Non bridging Si-O- (Relative area %) S rO c o n ten t (wt %) Figure 5. Non br idging Si-O– content i n SLABS glasses as a functio n of SrO content. 300 400 500 600 700 800 0.1 0.2 0.3 0.4 0.5 0.6 0.7 0.8 0.9 1.0 1.1 10 15 20 25 30 2.96 2.98 3.00 3.02 3.04 3.06 3.08 Band gap (eV) Sr O c o n te n t (w t%) Absorbance W avelength (nm ) SLABS-3 SLABS-4 SLABS-5 SLABS-6 SLABS-7 Figure 6. UV-Vis Diffused Reflectance Spectroscopy (UV- Vis-DRS) of glasses with band gap versus composition shown inset. tometric softening point within 660˚C to 709˚C. More over, both glass transition temperatures and dilatometric softening point temperatures show an increasing trend with i ncrease in substi tution i n the serie s. In thi s work to elucidate a structure property correlation in the series, electrical conductivity of the glasses were investigated by AC impedance spectroscopy from room temperature to 800˚C and conductivity of the samples were calculated from the resistance value considering the sample dimen- sions. As the glasses were originally designed for appli- cation in solid oxide fuel cell (SOFC) sealant so their conductivity at SOFC operational temperature which is higher than the glass transition temperatures is of great concern. Therefore, a plot of conductivity of glass sam- ples at 800˚C against the SrO content in the sample is sho wn in Figur e 7. It is ob served that c ond ucti vit y of the glass samples increased from 2.74 × 10⁻⁵ Scm-1 to 1.09 × 10⁻⁴ Scm-1 with increase in SrO content in the glass ma- 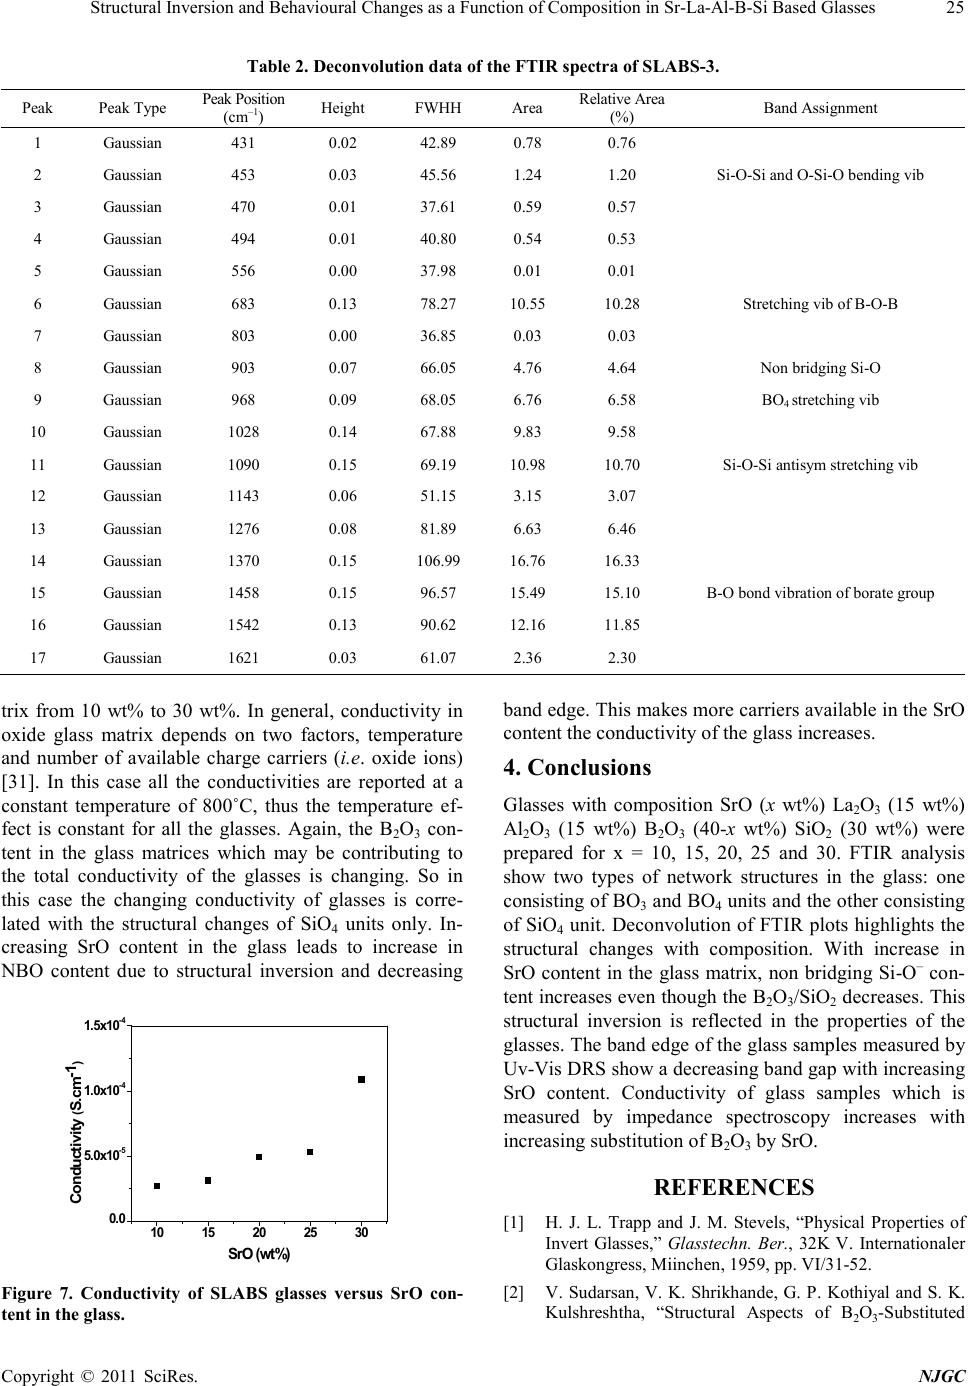 Structural Inversion and Behavioural Changes as a Function of Composition in Sr-La-Al-B-Si Bas ed Gla sses Copyright © 2011 SciRes. NJGC 25 Table 2 . Deconvoluti on data of the FTIR spectra of SLABS-3. Peak Peak Type Peak Position (cm–1) Heig ht FWH H Ar e a Relative Area (%) Band Assignment 1 Gaussian 431 0.02 42.89 0.78 0.76 2 Gaussian 453 0.03 45.56 1.24 1.20 Si-O-Si and O-Si-O bending vib 3 Gaussian 470 0.01 37.61 0.59 0.57 4 Gaussian 494 0.01 40.80 0.54 0.53 5 Gaussian 556 0.00 37.98 0.01 0.01 6 Gaussian 683 0.13 78.27 10.55 10.28 S tretchi ng vib of B-O-B 7 Gaussian 803 0.00 36.85 0.03 0.03 8 Gaussian 903 0.07 66.05 4.76 4.64 Non bridging Si-O 9 Gaussian 968 0.09 68.05 6.76 6.58 BO4 stretching vib 10 Gaussian 1028 0.14 67.88 9.83 9.58 11 Gaussian 1090 0.15 69.19 10.98 10.70 Si-O-Si antisym stretching vib 12 Gaussian 1143 0.06 51.15 3.15 3.07 13 Gaussian 1276 0.08 81.89 6.63 6.46 14 Gaussian 1370 0.15 106.99 16.76 16.33 B-O bond vibration of borate group 15 Gaussian 1458 0.15 96.57 15.49 15.10 16 Gaussian 1542 0.13 90.62 12.16 11.85 17 Gaussian 1621 0.03 61.07 2.36 2.30 trix from 10 wt% to 30 wt%. In general, conductivity in oxide glass matrix depends on two factors, temperature and number of available charge carriers (i.e. oxide ions) [31]. In this case all the conductivities are reported at a constant temperature of 800˚C, thus the temperature ef- fect is constant for all the glasses. Again, the B2O3 con- tent in the glass matrices which may be contributing to the total conductivity of the glasses is changing. So in this case the changing conductivity of glasses is corre- lated with the structural changes of SiO4 units only. In- creasing SrO content in the glass leads to increase in NBO content due to structural inversion and decreasing 10 15 20 25 30 0. 0 5. 0x10 -5 1. 0x10 -4 1. 5x10 -4 Conductivity ( S.cm -1 ) S rO (wt%) Figure 7. Conductivity of SLABS glasses versus SrO con- tent in the glas s. band edge. This makes more carriers available in the SrO content the conductivity of the glas s increases. 4. Conclusions Glasses with composition SrO (x wt%) La2O3 (15 wt%) Al2O3 (15 wt%) B2O3 (40-x wt%) SiO2 (30 wt%) were prepared for x = 10, 15, 20, 25 and 30. FTIR analysis show two types of network structures in the glass: one consisting o f BO3 and BO4 units and the other consisting of SiO4 unit. Deconvolution of FTIR plots highlights the structural changes with composition. With increase in SrO content in the glass matrix, non bridging Si -O– con- tent inc rea ses eve n thou gh the B2O3/SiO2 decreases. This structural inversion is reflected in the properties of the glasses. The band edge of the glass samples measured b y Uv-Vis DRS show a decreasing band gap with increasing SrO content. Conductivity of glass samples which is measured by impedance spectroscopy increases with increasi ng substitution of B2O3 by SrO. REFERENCES [1] H. J. L. Trapp and J. M. Stevels, “Physical Properties of Invert Glasses,” Glasstechn. Ber., 32K V. Internationaler Glaskon gres s , Miin chen, 1959, pp. VI/31-52. [2] V. Sudarsan, V. K. Shrikhande, G. P. Kothiyal and S. K. Kulshreshtha, “Structural Aspects of B2O3-Substituted  Stru ctural Inversion and Behavioural Changes as a Function of Composition in Sr-La-Al-B-Si Based Glasses Copyright © 2011 SciRes. NJGC 26 (PbO)0.5 (SiO2)0.5 Glasses,” Journal of Physi cs : Con- densed Matter, Vol. 14, No. 25, 2002, pp. 6553-6565. doi:10.1088/0953-8984/14/25/322 [3] K. Kobayashi, “Thermogravimetric and MOS Capacitor Properties for PbO-Bi2O3-B2O3-SiO2 Glass System,” Journal of Non-Crystalline Solids, Vol. 124, No. 2-3, 1990, pp. 229-232. doi:10.1016/0022-3093(90)90267-P [4] G. E. Jellison and P. J. Bray, “A Structural Interpretation of B10 and B11 NMR Spectra in Sodium Borate Glasses,” Journal of Non-Crystalline Solids, Vol. 29, No. 2, 1978, pp. 187-206. doi:10.1016/0022-3093(78)90113-8 [5] G. Bhasin, A. Bhatnagar, S. Bhowmick, C. Stehle, M. Affatigato, S. Feller, J. MacKenzie and S. Martin, “Short Range Order Structure in Sodium Borosilicate Glasses Obtained from Deconvolution of 29Si MAS NMR Spec- tra,” Physics and Ch emistry of Glasses, Vol. 39, 1998, p. 269. [6] B. G. Parkinson, D. Holland, M. E. Smith, A. P. Howes and C. R. Scal es, “The Ef fe ct of C s2O Additions on HLW Waste form Glasses,” Journal of Non-Crystalline Solids, Vol. 351, No. 30-32, 2005, pp. 2425-2432. doi:10.1016/j.jnoncrysol.2005.06.035 [7] S. Feller, W. J. Dell and P. J. Bray, “B10 NMR Studies of Lithium Borate Glasses,” Journal of Non-Crystalline Solids, Vol. 51, No. 1, 1982, pp. 21-30. doi:10.1016/0022-3093(82)90186-7 [8] R. K. Brow, D. R. Tallant, S. T. Myers and C. C. Phifer, “The Short Range Structure of Zinc Phosphate glass,” Journal of Non-Crystalline Solids, Vol. 191, No. 1-2, 1995, pp. 45-55. doi:10.1016/0022-3093(95)00289-8 [9] P. P. Proulx, G. Cormier, J. A. Capobianco, B. Cham- pagnon and M. Bettinelli, “Raman and Low Frequency Raman Spectroscopy of Lead, Zinc and Barium Meta- phosphate Glasses Doped with Eu3+ Ions,” Journal of Physics: Condensed Matter, Vol. 6, No. 1, 1994, pp. 275-283. doi:10.1088/0953-8984/6/1/027 [10] S. Bale and S. Rahman, “Glass Str ucture and Tran sport Properties of Li2O Containing Zinc Bismuthate Glasses,” Optics Materials, Vol. 31, No. 2, 2008, pp. 333-337. doi:10.1016/j.optmat.2008.05.007 [11] K. El-Egili, “Infrared Studies of Na2O-B2O3-SiO2 and Al2O3-Na2O-B2O3-SiO2 Glasses,” Physica B, Vol. 325, No. 1-4, 2003, pp. 340-348. doi:10.1016/S0921-4526(02)01547-8 [12] V. Kumar, A. Arora, O. P. Pandey and K. S in gh, “Studies on Th e rmal and Structural Properties of Glasses as Sea- lants for Solid Oxide Fuel Cells,” International Journal of Hydrogen Energy, Vol. 33, No. 1, 2008, pp. 434-438. doi:10.1016/S0921-4526(02)01547-8 [13] F. Moreau, A. Durán and F. M uñoz, “Struct ure and Prop- erties of High Li2O-Containing Aluminophosphate Glasses,” Journal of European Ceramic Society, Vol. 29, No. 10, 2009, pp. 1895-1902. doi:10.1016/j.jeurceramsoc.2008.12.016 [14] J. Ramkumar, V. Sudarsan, S. Chandramouleeswaran, V. K. Shrikhande, G. P. Kothiyal, P. V. Ravindran, S. K. Kulshreshtha and T. Mukherjee, “Structural Studies on Boroaluminosilicate Glasses,” Journal of Non-Crystalline Solids, Vol. 354, No. 15-16, 2008, pp. 1591-1597. doi:10.1016/j.jnoncrysol.2007.10.005 [15] M. S. Gaafar, H. A. Afifi and M. M. Mekawy, “Structural Studies of Some Phospho-Borate Glasses Using Ultra- sonic Pulse-Echo Techn ique, DSC and IR Spectroscopy, ” Physica B: Condensed Matter, Vol. 404, No. 12-13, 2009, pp. 1668-1673. doi:10.1016/j.jnoncrysol.2007.10.005 [16] M. S. Gaafar, N. S. A. El-Aal, O. W. Gerges and G. El-Amir, “Elastic Proper ties and Structural Studies on Some Zinc-Borate Glasses Derived from Ultrasonic, FT-IR and X-Ray Techniques,” Journal of Alloys and Compounds, Vol. 475, No. 1-2, 2009, pp. 535-542. doi:10.1016/j.jnoncrysol.2007.10.005 [17] U. Hoppe, G. Walter, R. Kranold and D. Stachel, “Struc- tural Specifics of Phosphate Glasses Probed by Diffrac- tion Methods: A Review,” Journal of Non-Crystalline Solids, Vol. 263-264, No. 1-2, 2000, pp. 29-47. doi:10.1016/j.jnoncrysol.2007.10.005 [18] K. Suzuya, D. L. Price, C. K. Loong and S. W. Martin, “Structure of Vitreous P2O5 and Alkali Phosphate Glasses,” Journal of Non-Crystalline Solids, Vol. 232- 234, 1998, pp. 650-657. [19] A. Hayashi, M. Nakai, M. Tatsumisago, T. Minami, Y. Himei, Y. Miura and M. Kat ada, “Structural Investigation of SnO-B2O3 Glasses by Solid-State NMR and X-Ray Photoelectron Spectroscopy,” Journal of Non-Crystalline Solids, Vol. 306, No. 3, 2002, pp. 227-237. doi:10.1016/S0022-3093(02)01169-9 [20] N. P. Lower, J. L. McRae, H. A. Feller, A. R. Betzen, S. Kapoo r, M. Affatigato and S. A. Feller, “Physical Proper- ties of Alkaline-Earth and Alkali Borate Glass es Prep ared over an Extended Range of Compositions,” Journal of Non-Crystalline Solids, Vol. 293-295, 2001, pp. 669-675. [21] R and IR Spectroscopies,” Journal of Non-Crystalline Solids, Vol. 232-234, 1998, pp. 113-118. doi:10.1016/S0022-3093(98)00380-9 [22] E. I. Kamitsos, A. P . Patsis, M. A. Karak assides and G. D. Chryssikos, “Infrared Reflectance Spectra of Lithium Borate Glasses,” Journal of Non-Crystalline Solids, Vol. 126, No. 1-2, 1990, pp. 52-67. doi:10.1016/0022-3093(90)91023-K [23] E. I. Kamitsos, M. A. Karakassid es and G. D. Chryssikos, “A Vibrational Study of Lithium Borate Glasses with High Li2O Con t ent,” Physics and Chemistry of Glasses, Vol. 28, 1987, p. 203. [24] E. I. Kamitsos, M. A. Karakassid es and G. D. Chryssikos, “Vibrational-Spectr a o f Magnesium-Sodium-Borate Gl asses. 2. Raman and Midinfrared Investigation of the Network Structur e,” Journal of Physical Chemistry, Vol. 91, No. 5, 1987, pp. 1073-1079. doi:10.1021/j100289a014 [25] K. Lu and M. K. Mahapatra, “Network Structure and Thermal Stability Study of High Temperature Seal Glass,” Journal of Applied Physics, Vol. 104, No. 7, 2008, pp. 074910-1-074910-9. doi:10.1063/1.2979323  Structural Inversion and Behavioural Changes as a Function of Composition in Sr-La-Al-B-Si Bas ed Gla sses Copyright © 2011 SciRes. NJGC 27 [26] P. Brix and L. Gaschler, “Sealing Glass for the Produc- tion of Glass-to-Metal Seals,” US Patent, US 5137849, 1992. [27] H. A. A. Sidek, S. Rosmawati and Z. A. Talib, “Synthesis and Optical Properties of ZnO-TeO2 Glass System,” American Journal of Applied Sciences, Vol. 6, No. 8, 2009, pp. 1489-1494. doi:10.3844/ajassp.2009.1489.1494 [28] R. H. Doremus, “Glass Science,” 2nd Edition, John Wil e y & Sons Inc., New York, 1994. |