

Paper Menu >>
Journal Menu >>
 New Journal of Glass and Ceramics, 2011, 1, 40-48 doi:10.4236/njgc.2011.12007 Published Online July 2011 (http://www.SciRP.org/journal/njgc) Copyright © 2011 SciRes. NJGC The Effect of Glass Plate Thickness and Type and Thickness of the Bonding Interlayer on the Mechanical Behavior of Laminated Glass Issam S. Jalham1, Omar Alsaed1 1Industrial Engineering Department, Univers ity of Jordan, Amman, Jordan. Email: [email protected]u.jo Received March 8th, 2011; revised April 5th, 2011; accepted April 12th, 2011. ABSTRACT In this work the effect of the type of the bonding interlayer (polyvinyl butyral (PVB) or Ethyl Vinyl Acetate (EVA)), number of bonding layers, and the position and the thickness of the Glass plates on the maximum load capacity and absorbed energy by laminated glass. Further more, this investigation presents a mathematical model that relates the maximum force capacity of the glass laminated structure to the glass plate thickness, type and thickness of the interlay- er regardless the position of the fixed glass plate. Both practical work results and the theoretical model indicate that the maximum load capacity of laminated glass bonded with either PVB or EVA decreases as the interlayer thickness in- creases. Moreover, the maximum load capacity for the glasses bonded with EVA is greater than those for the PVB bonded ones under the same conditions. On the other hand, it was observed that that laminated glass absorbed energy increases with the increase of the interlayer thickness and the increase of glass plate thickness. Keywords: Laminated Glass, Polyvinyl Buty ral (PVB), Ethyl Vinyl Ace tate (EVA), Layer, Load Capacity 1. Introduction Ceramics and glasses, which have strong ionic-covalent chemical bonds, are very strong and stiff. They are also resistant to high te mperatures and corrosion, but are brit- tle and prone to failure at ambient temperatures. In con- trast, thermoplastic polymers such as polyvinyl butyral, which have weak secondary bonds between long chain molecules, exhibit low strength, low stiffness, and a sus- ceptibility to creep at ambient temperatures. These po- lymers, ho wever, tend to b e extremely ductile a t ambient temperatures. When combine glass and polymer to form a laminated glass, some change in the maximum load capacity will occur, which depends on both the glass and polymer type. This led to investigate how the glass thic kness a nd t he type and n umber of la minate d int erlay- er affect the maximum load capacity of laminated glass as well as their effect on the absorbed energy. 2. Literatu re Rev iew Laminated glass consists of two or more glass plies bonded together with an elastomeric interlayer, usually polyvinyl butyral (PVB) or Ethyl Vinyl Acetate (EVA). Afte r breakage, the interlayer holds the resultant glass shards in place and, in most cases, the glass remains in the frame when laminated glass fractures. This post- breakage characteristic of laminated glass has made it desirable for use in vehicle windshields for decades be- cause it makes the occupant safer from glass shards than other glazing materials. The shea r modulus st ud ie s we r e c ar r ied o ut by Que net t [1] and Hooper [2]. Quenett [1] noticed that when the interlayer thickness decreases, shear modulus increases and reported that the condition of the interlayer is a con- trolling factor in static bending and dynamic impact re- sistance. Hoo per [2] confir med the results of Quenett [1] . He stated that after testing glass beams in four points loading with varying temperatures and interlayer hard- ness, he found that t he shear modul us of the interla yer is inversely prop ortional to the interla yer thickness and a lso mentioned that plasticizer contents, ambient tempera- tures, and load durations are the primary factors control- ling bending resistance of laminated glass. He attributed this behavior to the “thermoplastic” nature of the inter- layer, stating the decreased bending stiffness was the  The Effect of Glass Plate Thickness and Type and thickness of the Bonding Interlayer on the Mechanical Behavio r of Laminated Glass Copyright © 2011 SciRes. NJGC 41 primary disadvantage to a r c hitectural laminated glas s. Strength of the monolithic and laminated glasses tak- ing in to ac count the geo metr y and thi ckne ss of t he te sted plates was studied by several researchers. For example, Pilkington Ltd. [ 3] co mpared monolit hic glas s stre ngth to the strength of laminated glass specimens made of sheet and float glass. They found that, at normal temperature, laminated glass specimens exhibit the same strength as monolithic glass specimens having the same rectangular dimensions and glass thicknesses. On the other hand, Linden et al. [4] conducted a non-destructive test on monolithic, layered, and laminated glass specimens in- strumented with strain gages. They concluded that lami- nated glass strength and monolithic glass strength ap- peared to be equivalent at normal temperatures; and the strength of la minated gla ss specimens approached that of layered glass specimens at elevated temperatures. In ad- dition, Norville [5] tested two laminated glass specimen of sizes 38 x 76 and 66 x 66 in. destructively. His de- structive experimentation also showed that the strength of laminated glass specimens is the same or greater than that of monolithic specimens having the same rectangular dimensions and nominal thicknesses under similar load conditions. Keller [6] used novel method to measure the delami- nating energy in laminated glass in the rele vant dynamic range. He found that increasing the interlayer thickness improves the penetration resistance of laminated glass because more energy can be absorbed in the high speed delimitation process since the interlayer is simply less like to tear. In contrast to the results of the above mentioned re- searches contradiction was reported in Nagalla et al. [7] ; Minor and Reznik [8]. Nagalla et al. [7] in their ad- vanced theoretical work compared layered glass to mo- nolithic. They discovered that some aspect ratios of the layered glass experienced lower principal stresses than monolit hic glass subje cted to unifor m, transver se loading in some ranges of the loading. They concluded that the strength factor of 0.6 used by some building codes for laminated glass may be too low for many window geo- metries and design pressures. Minor and Reznik [8] destructively tested three sizes of laminated glass specimens (33 x 66, 38 x 76, and 66 x 66 in.) with an 0.030 in. interlayer, and compared the resulting failure pressures to those from tests on mono- lithic glass specimens having the same rectangular di- mensions and nominal glass thicknesses. They intro- duced four variables, which are: glass thickness, glass type, temperature, and damage to one plate of glass (i.e., damage to tension or compression side) . Their te sting led to the following geral conclusi ons: 1) Laminated glass specimens tested at room tempera- ture have approximately the same failure pressure as monolithic glass specimens having the same rectangular dimensions and nominal glas s thicknesses; 2) As temperature increases laminated glass behavior migrates towards the layered glass model; 3) Laminated glass specimens having twice the no- minal glass thickness of monolithic specimens display strength greater than or equa l to twice t he strengt h of the monol ithi c specimens. Some researchers investigated the effect of tempera- ture on the properties of glass. Linden et al. [9] con- ducted non-destructive testing on two different plate geometries. First, they tested the same plate geometry (60 x 96 x 1/4 in.) as used in the parent report to study load duration and temperature effects. Second, they tested a different geometry (55-1/8 x 57-1/8 x 3/8 in.) with two interlayer thicknesses (0.030 and 0.060 in.) to study the effects of interlayer thickness on strength and deflection. They conducted destructive tests on one plate geometry (60 x 96 x 1/4 in.) at room temperature and at 170°F. Perusal of their data indicates that while load du- ration and elevated temperatures acting individually re- duce the s tr uctural rigidity of the laminated glass, the two factors do not interact, producing a greater combined reduction in laminated glass strength. Weller [10], Used experimental study to compare different interlayer mate- rials in laminated glass in respect to their structural be- haviour. The material properties above the verification temperature clearly showed the temperature dependency. The relaxation times fall with increasing temperature and the shear stress gets smaller. Theoretical modeling of the glass behavior was also carried out by many researchers. Linden et al. [4 ] derived theoretical results through the finite difference solution and compared experimental and theoretical results. They concluded that the theoretical finite difference model for monolithic and layered glass appeared to be acceptable for the one glass plate geometry tested. Moreover, Behr and Kremr [11] used experimental validation of a me- chanics-based finite element model for architectural la- minated glass units subjected to low velocity and two gram projectile impacts. The impact situation models a scenario commonly observed during severe windstorms. This study confirmed the ability of an analytical finite element model to predict accurately the peak strains in representative architectural laminated glass units as a function of impact velocity. Correlations between peak radial strains computed using finite element analysis and those measured experimentally were close, with the av- erage difference between analytical predictions and ex- perimental data being 7.7%.  The Effect of Glass Plate Thickness and Type and thickness of the Bonding Int er layer on the Mechanical Behavio r of Laminated Glass Copyright © 2011 SciRes. NJGC 42 Zang et a l. [12] investigation focused on the use of the 3D discrete element method to study the impact fracture problem of laminated glass. The glass and the (PVB) of laminated glass plane are discretized to uniform rigid spherical elements. This investigation showed that the accuracy of the 3D model and numerical analysis code are more validated in the elastic range by comparing with FEM. Recently, Belies [13] compared (PV B) with st iffe r and stronger interlayer Sentry Glass Plus (SGP). After brea- kage of both glass sheets the load decreased to a rela- tively low level (typically between 2 kN and 3 kN) be- fore the broken glass pieces and interlayer started again to buil d up co mpres si ve a nd tensile stre sse s, respe ctively. Subsequently, the load slightly increased again and after reaching the maximum, it decreased significantly (to less then 0. 3 kN). When s ubje cted to in-plane b endi ng (buc k- ling prevented), the post breakage residual resistance is relatively poor for both interlayers, as illustrated above. The residual load-bearing capacity was very limited and far below the initial glass strength. It is clear from the above review that the research work focused on the comparison between the strength of mo- nolithic and laminated glases and did not take into con- sideration the bonding interlayer thickness, and the posi- tion and thickness of the glass plates. Furthermore, the main bonding material in these studies is PVB. This in- vesti gatio n d iffe rs fr o m the ab o ve me ntio ned one s in that it concentrates on how the glass thickness and the type and number of laminated interlayer affect the maximum load capacity of laminated glass as well as their effect on the absorbed energy. Details for the preparation of the mullite ceramic tile (900 mm × 1800 mm × 5.5 mm) were reported in [4]. The raw materials were as follows: 50 wt% - 55 wt% fly ash, 30 wt% - 35 wt% pyrophyllite, 10 wt% - 15 wt% bauxite and 4 wt% AlF3. Microcrystal glass was a sort of borosilicate glass and the composition is sho wn in Table 1. High purity silica, reagent grade boric acid, zinc oxide, sodium carbonate and yttrium oxide were used as source materials and mixed in the above ratios, ball milled and dri ed. Then, the mixture was gro und in a p latinum cr uci- ble and kept it at 1500˚C for 3 h. The molten glass trans- formed from the mixture at high temperature and under- went water quenching and a course of drying and ball milling to produce a glass power with an average size about 1 - 3 μm. These glass powder was distributed un- iformly by distributor on the surface of mullite ceramic tile and its thickness was kept at 1.2 mm. Next, the cov- ered tile was placed in a furnace for a second sintering at 1000˚C - 1200˚C, causing the glass powder to remelt, nucleate, crystallize and combinesolidly with the ceramic base. After cooling down to the room temperature, the large-size ultra-thin mullite glass ceramic tile was pre- pared finally. 3. Materials, Equipment, and Experimental Procedure 3.1. Material The materials used in this investigation are float glass plates, and Polyvinyl Butyral (PVB) and Ethylene Vinyl Acetate (EVA) as interlayer materials. The maximum force capacity and the amount of the absorbed energy of the laminated glass were determined for the input va- riables that are summarized in Tables 1 -4 below. Figure 1 shows the schematic diagram for the assembly of the glass plates and interlayer. 3.2. Equipment Equipment used in this investigation are Glass cutting machine of BSJ-NL3725 type, Bend testing machine of OUTOGRAPH AG—1S type, and Charpy testing ma- chine. 3.3. Experim enta l Pro ced ure Testing procedure can be summarized as follows: 1) Cutting plates of 40 cm x 30 cm from glass panels of 4 mm, 6 mm , 8 mm, 10 mm, 12 mm thicknesses. The sharp cut edges have been broken off or beveled with a grind ing tool ; 2) Manufacturing of PVB-laminated glass. It compris- es the washing and drying of individual glass sheets, laying the PVB film between the two glass sheets by usin g roller process, and heati ng and pres sing the a ssem- bly. An assembly full- surface bond is created in an autoc- lave using temperatures of about 140°C and pressure of about 150 psi. The interlayer becomes a viscous at this temperature and pressure, and any remaining air dis- solves into the la minate layer; 3) M anufactur ing of EV A laminated glass. It compris- es the washing and drying of individual glass sheets, laying the EVA film between the two glass sheets by using roller process, and the assembly is headed in single stage lamination process (vacuum with integrated heating and cooling in the same apparatus); 4) Cutting of the manufactured laminated glass to the required size by using the cutting machine. For point bend test, the rectangular sheets dimension is 80 mm x 300 mm while for Charpy test, the rectangular sheets di- 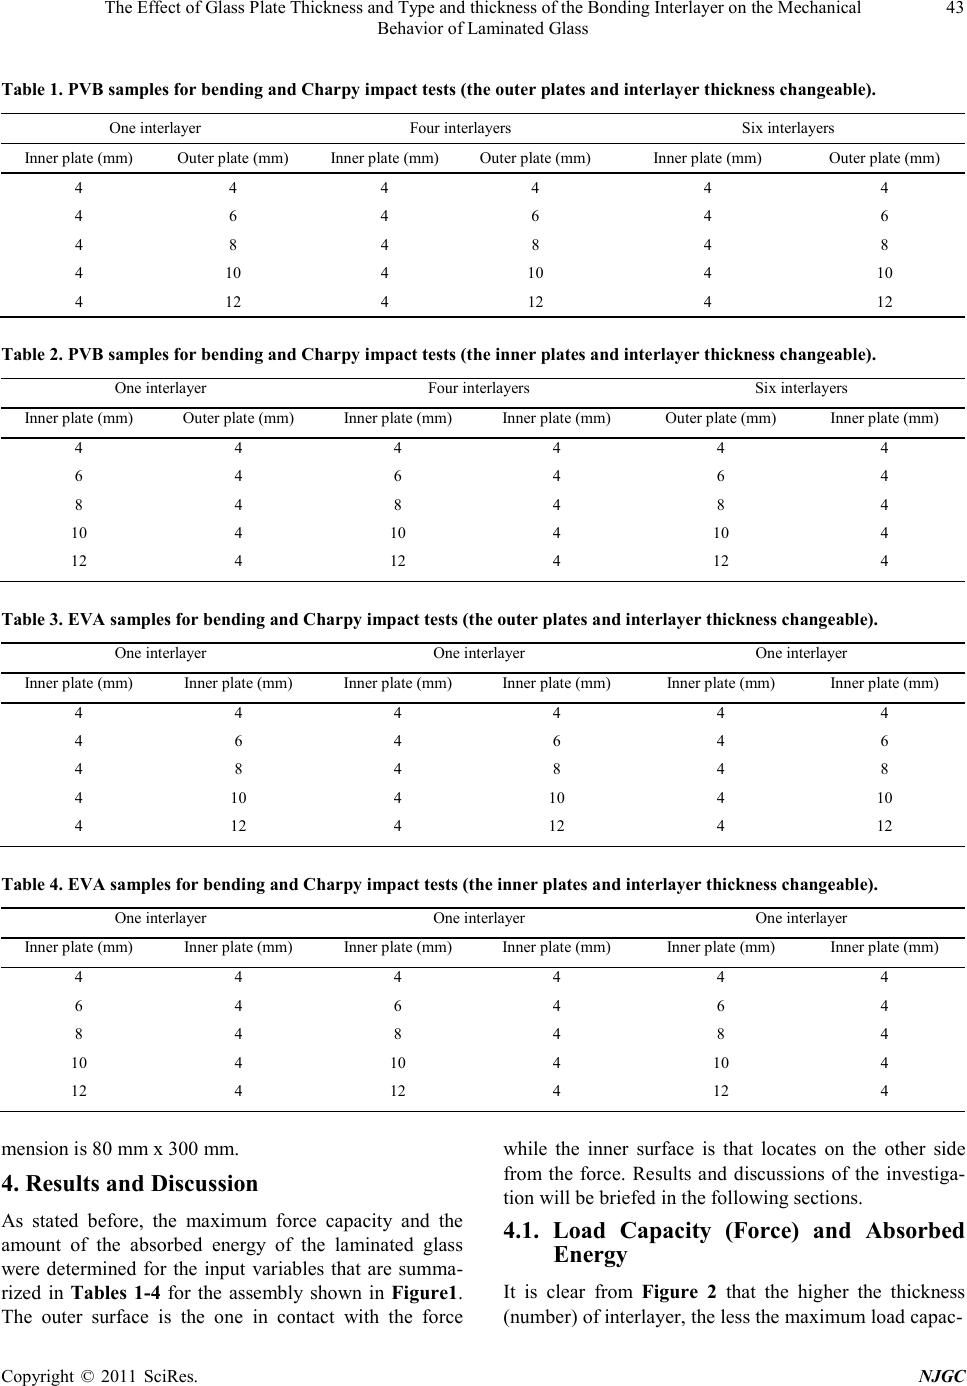 The Effect of Glass Plate Thickness and Type and thickness of the Bonding Interlayer on the Mechanical Behavio r of Laminated Glass Copyright © 2011 SciRes. NJGC 43 Table 1. PVB samples for be nding and C ha rpy impact tests (the outer plates and interlaye r thickne ss c hang eable) . One inter l ayer Four int erlayers Si x int erlayers Inner plate (mm) Outer plat e (mm) Inner plate (mm) Outer plat e ( mm) Inner plate (mm) Outer plate (mm) 4 4 4 4 4 4 4 6 4 6 4 6 4 8 4 8 4 8 4 10 4 10 4 10 4 12 4 12 4 12 Table 2. PVB sampl es for bending a nd C ha rpy impact tests (the inner plates and interlaye r thickne ss c hang eable) . One inter l ayer Four interlayers Six int erlayer s Inner plate (mm) Outer p late (mm) Inner plate (mm) Inner plate (mm) Outer p late (mm) Inner plate (mm) 4 4 4 4 4 4 6 4 6 4 6 4 8 4 8 4 8 4 10 4 10 4 10 4 12 4 12 4 12 4 Table 3. EVA samples for bending and C ha rpy impact tests (the out er plates and interlayer thicknes s changeable). One inter l ayer One int erlayer One interla y er Inner plate (mm) Inner plate (mm) Inner plate (mm) Inner plate (mm) Inner plate (mm) Inner plate (mm) 4 4 4 4 4 4 4 6 4 6 4 6 4 8 4 8 4 8 4 10 4 10 4 10 4 12 4 12 4 12 Table 4. EVA samples for bendi ng an d Charpy impact tests (the inner plates and interlayer thickness changeable). One inter l ayer One inter l ayer One inter l ayer Inner plate (mm) Inner plate (mm) Inner plate (mm) Inner plate (mm) Inner plate (mm) Inner plate (mm) 4 4 4 4 4 4 6 4 6 4 6 4 8 4 8 4 8 4 10 4 10 4 10 4 12 4 12 4 12 4 mension is 80 mm x 300 mm. 4. Results and Discussion As stated before, the maximum force capacity and the amount of the absorbed energy of the laminated glass were determined for the input variables that are summa- rized in Tables 1-4 for the assembly shown in Figure1. The outer surface is the one in contact with the force while the inner surface is that locates on the other side from the force. Results and discussions of the investiga- tion will be br ie fed in the following sections. 4.1. Load Capacity (Force) and Absorbed Energy It is clear from Figure 2 that the higher the thickness (number) of interlayer, the less the maximum load capac- 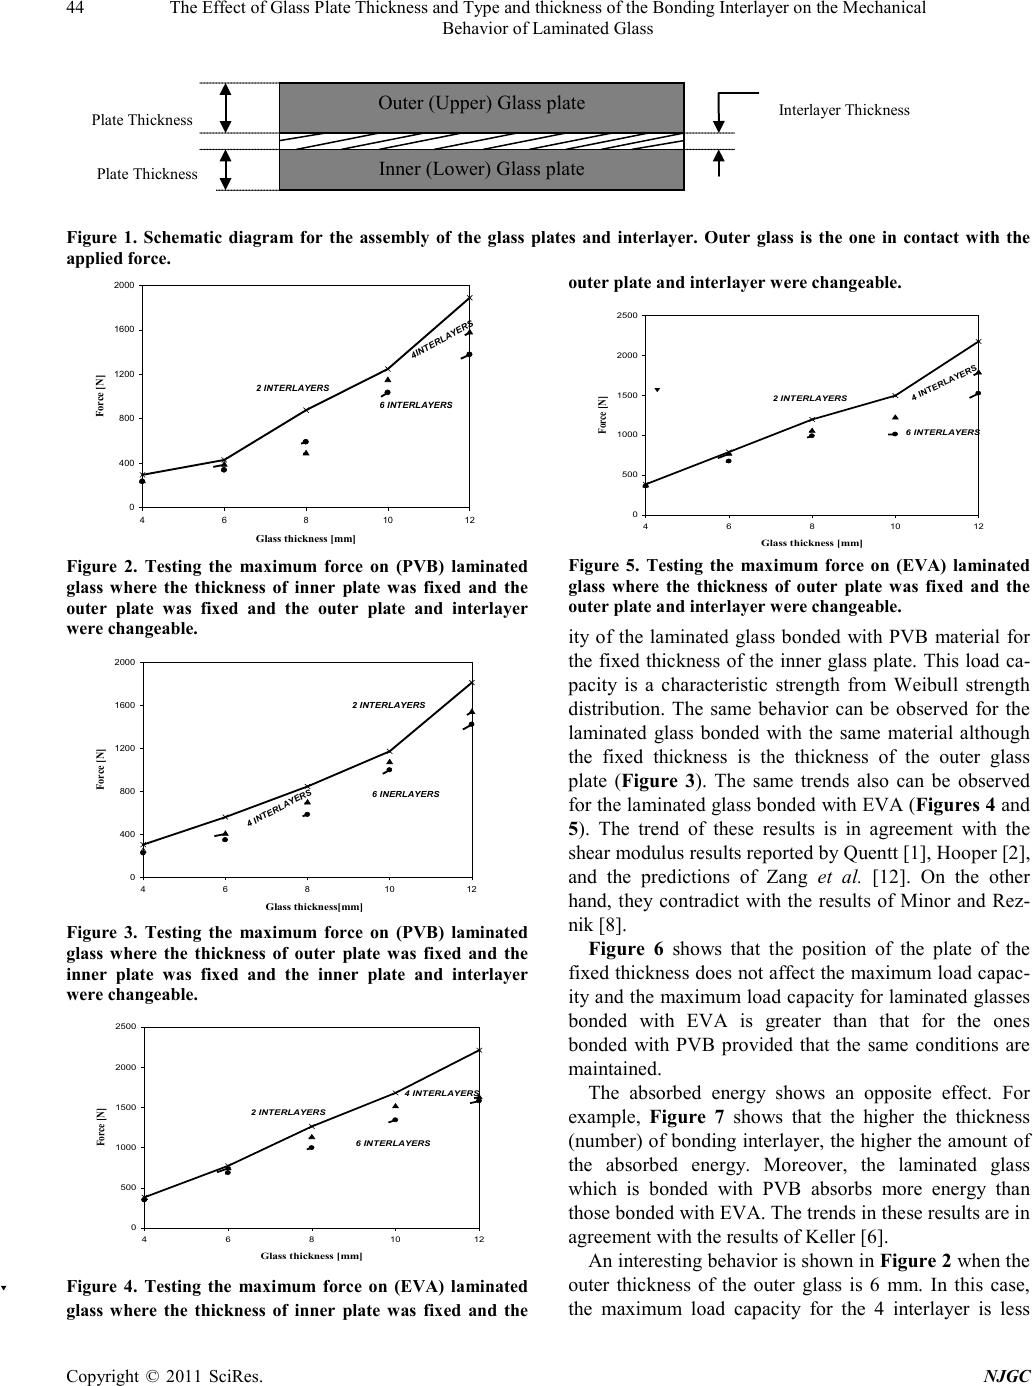 The Effect of Glass Plate Thickness and Type and thickness of the Bonding Int er layer on the Mechanical Behavio r of Laminated Glass Copyright © 2011 SciRes. NJGC 44 Figure 1. Schematic diagram for the assembly of the glass plates and interlayer. Outer glass is the one in contact with the applied force. Glass thickness [ mm] 46810 12 Force [N] 0 400 800 1200 1600 2000 2 INTE RL AYERS 6 INTE RL AYERS 4INTE RL AYERS Figure 2. Testing the maximum force on (PVB) laminated glass where the thickness of inner plate was fixed and the outer plate was fixed and the outer plate and interlayer were change able. Glass thickness[mm] 46810 12 Force [N] 0 400 800 1200 1600 2000 2 INTERLAYERS 6 INERLAYERS 4 INTE RL AYERS Figure 3. Testing the maximum force on (PVB) laminated glass where the thickness of outer plate was fixed and the inner plate was fixed and the inner plate and interlayer were changeable. Glass thi c kn e ss [mm] 46810 12 Force [N] 0 500 1000 1500 2000 2500 2 INTERLAYERS 4 INTERLAYERS 6 INTERLAYERS Figure 4. Testing the maximum force on (EVA) laminated glass where the thickness of inner plate was fixed and the oute r plate an d interlayer were changeable. Glass thi c kn ess [mm] 46810 12 Force [N] 0 500 1000 1500 2000 2500 2 INTERLAYERS 4 INTERLAYERS 6 INTERLAYERS Figure 5. Testing the maximum force on (EVA) laminated glass where the thickness of outer plate was fixed and the oute r plate an d interlayer were changeable. ity of the laminated glass bonded with PVB material for the fixed thickness of the inner glass plate. This load ca- pacity is a characteristic strength from Weibull strength distribution. The same behavior can be observed for the laminated glass bonded with the same material although the fixed thickness is the thickness of the outer glass plate (Figure 3). The same trends also can be observed for the laminated glass bonded with EVA (Figures 4 and 5). The trend of these results is in agreement with the shear modulus results reported by Quentt [1], Hooper [2], and the predictions of Zang et al. [12]. On the other hand, they contradict with the results of Minor and Rez- nik [8 ]. Figure 6 shows that the position of the plate of the fixed thickness does not affect the maximum load capac- ity and the maximum load capacity for laminated glasses bonded with EVA is greater than that for the ones bonded with PVB provided that the same conditions are maintained. The absorbed energy shows an opposite effect. For example, Figure 7 shows that the higher the thickness (number) of bonding interla yer, the higher the amount o f the absorbed energy. Moreover, the laminated glass which is bonded with PVB absorbs more energy than those bonded with EVA. The trends in these results are in agreement wit h the results of K e lle r [6]. An int er es ti n g b ehavio r is s hown i n Figure 2 whe n t he outer thickness of the outer glass is 6 mm. In this case, the maximum load capacity for the 4 interlayer is less Plate Thickness Interlayer Thickness Outer (Upp e r ) Glass plate Inner (Lower) Glass plate Plate Thickness 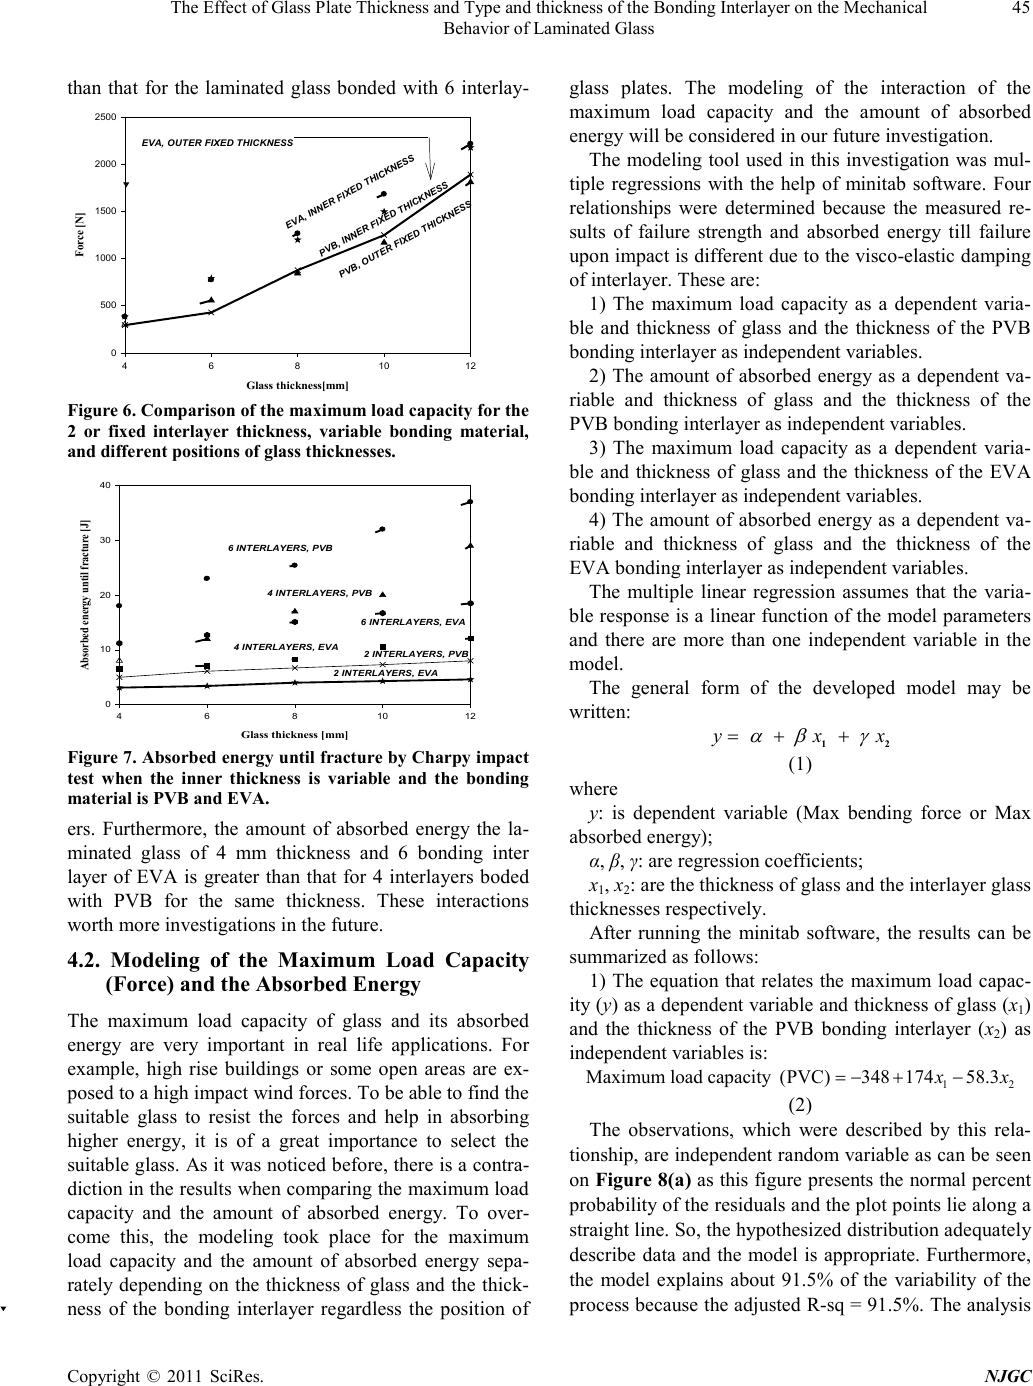 The Effect of Glass Plate Thickness and Type and thickness of the Bonding Interlayer on the Mechanical Behavio r of Laminated Glass Copyright © 2011 SciRes. NJGC 45 than that for the laminated glass bonded with 6 interlay- Glass thickness[ mm] 46810 12 Force [N] 0 500 1000 1500 2000 2500 PVB, OUTER FI X ED THICKNE SS PVB, INNER F I X ED THICKNE SS EVA, INNER FIX ED THICKNE SS EVA, OUT ER FIXED THICKNESS Figure 6. Comparison of the ma x i mu m load c apacit y for the 2 or fixed interlayer thickness, variable bonding material, and different positio ns of gl ass thicknesses. Glass thickness [mm] 46810 12 Absorbed energy until fracture [J] 0 10 20 30 40 6 INTERLAYERS, PVB 4 INTERLAYERS, PVB 2 INTERLAYERS, PVB 2 INTERLAYERS, EVA 4 INTERLAYERS, EVA 6 INTERLAYERS, EVA Figure 7. Abso rbed energ y unti l fracture by Char py impact test when the inner thickness is variable and the bonding material is PVB and EVA. ers. Furthermore, the amount of absorbed energy the la- minated glass of 4 mm thickness and 6 bonding inter layer of EVA is greater than that for 4 interlayers boded with PVB for the same thickness. These interactions worth more investigations in the future. 4.2. Modeling of the Maximum Load Capacity (Force) and the Absorbed Energy The maximum load capacity of glass and its absorbed energy are very important in real life applications. For example, high rise buildings or some open areas are ex- posed to a high impact wind forces. To be able to find the suitable glass to resist the forces and help in absorbing higher energy, it is of a great importance to select the suitable glass. As it was noticed before, there is a contra- dict ion in the result s whe n compar ing the maxi mum loa d capacity and the amount of absorbed energy. To over- come this, the modeling took place for the maximum load capacity and the amount of absorbed energy sepa- rately depending on the thickness of glass and the thick- ness of the bonding interlayer regardless the position of glass plates. The modeling of the interaction of the maximum load capacity and the amount of absorbed energ y will be consid ere d in our future invest igation. The modeling tool used in this investigation was mul- tiple regressions with the help of minitab software. Four relationships were determined because the measured re- sults of failure strength and absorbed energy till failure upon impact is different due t o the visco -elastic damping of interlayer. These are: 1) The maximum load capacity as a dependent varia- ble and thickness of glass and the thickness of the PVB bonding interlayer as independent variables. 2) The amount of absorbed energy as a dependent va- riable and thickness of glass and the thickness of the PVB bonding interlayer as independ ent variab les. 3) The maximum load capacity as a dependent varia- ble and thickness of glass and the thickness of the EVA bonding interlayer as independent variables. 4) The amount of absorbed energy as a dependent va- riable and thickness of glass and the thickness of the EVA bonding inter layer a s independe nt variables. The multiple linear regression assumes that the varia- ble response is a linear function of the model parameters and there are more than one independent variable in the model. The general form of the developed model may be written: y xx αβ γ =++ 12 (1) where y: is dependent variable (Max bending force or Max absorbed energy); α, β, γ: are regression coefficients; x1, x2: are the thickness of glass and the interlayer gl ass thicknes s es resp ectively. After running the minitab software, the results can be summarized as follows: 1) The equation that relates the maximum load capac- it y ( y) as a dependent variable and thic kness of glas s (x1) and the thickness of the PVB bonding interlayer (x2) as independent variables is: 12 Maximum load capacity(PVC)34817458.3xx=−+ − (2) The observations, which were described by this rela- tionship, are independent random variable as can be seen on Figure 8(a) as this figure presents the normal percent prob ability of the resid uals and the p lot points lie a long a straight line. So, the h ypothesi zed distrib ution ade qua tely describe data and the model is appropriate. Furthermore, the model explains about 91.5% of the variability of the process because the adjusted R-sq = 91.5%. The analysis 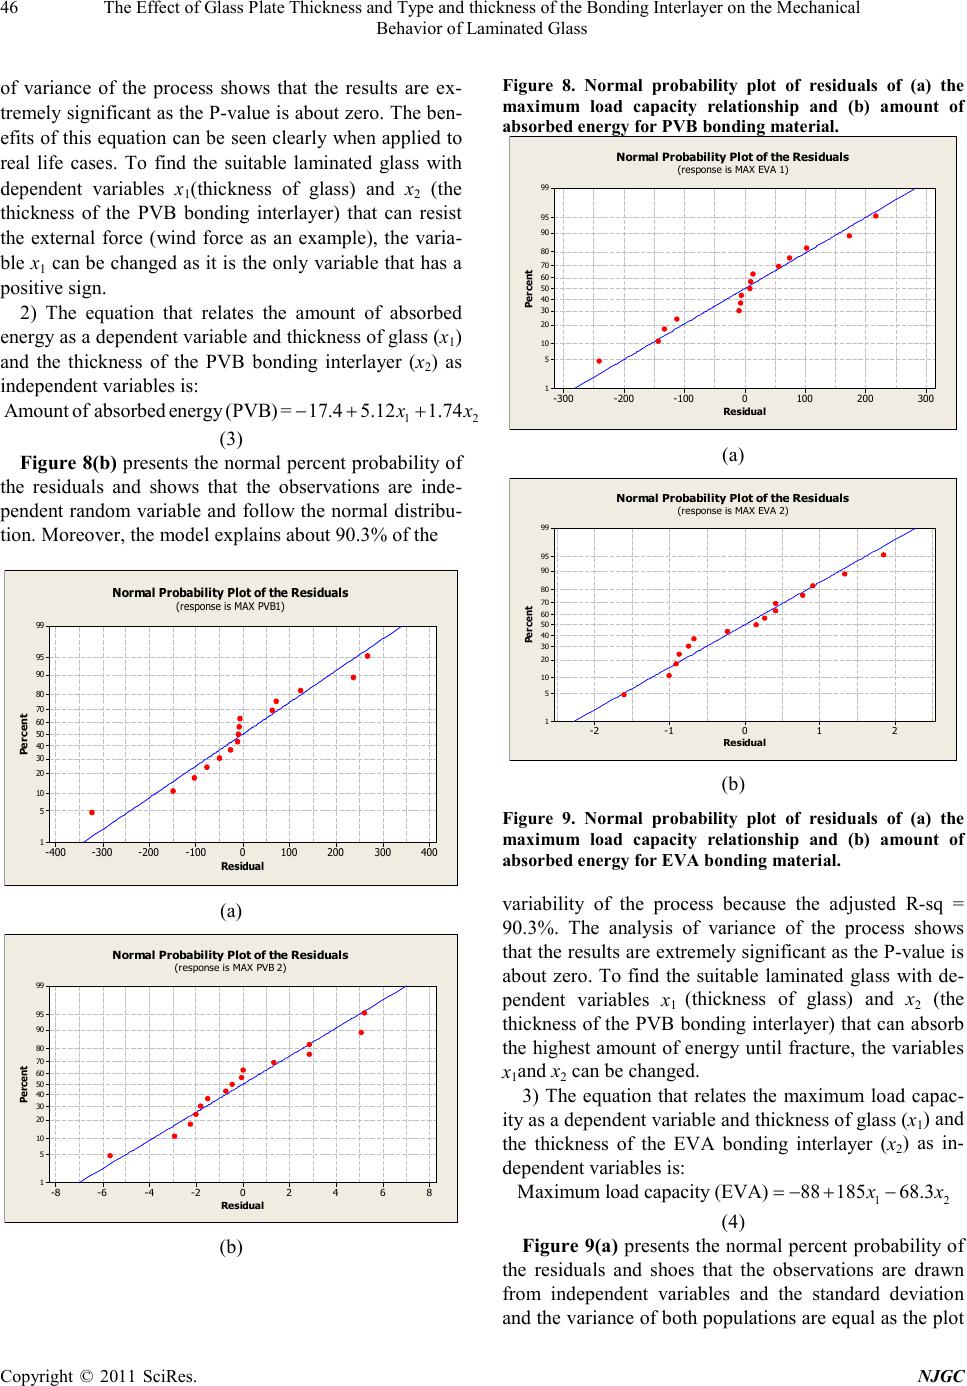 The Effect of Glass Plate Thickness and Type and thickness of the Bonding Int er layer on the Mechanical Behavio r of Laminated Glass Copyright © 2011 SciRes. NJGC 46 of variance of the process shows that the results are ex- tre mely si gni fic ant a s t he P -value is about zero. T he ben- efits of this equation can be seen clearly when applied to real life cases. To find the suitable laminated glass with dependent variables x1(thickness of glass) and x2 (the thickness of the PVB bonding interlayer) that can resist the external force (wind force as an example), the varia- ble x1 can be changed as it is the onl y variable that has a positive sig n. 2) The equation that relates the amount of absorbed energy as a dependent variable and thickness of glass (x1) and the thickness of the PVB bonding interlayer (x2) as independent variables is: 12 Amountofabsorbedenergy(PVB)=17.45.121.74 xx −+ + (3) Figure 8 (b) presents the normal per cent probability of the residuals and shows that the observations are inde- pendent rando m variable and follow the normal distribu- tion. Moreover, the model explains about 90.3% of the Residual Percent 4003002001000-100-200-300-400 99 95 90 80 70 60 50 40 30 20 10 5 1 Normal Probability Plot of the Residuals (response is MAX PVB1) (a) Residual Percent 86420-2-4-6-8 99 95 90 80 70 60 50 40 30 20 10 5 1 Normal Probability Plot of the Residuals (response is MAX PVB 2) (b) Figure 8. Normal probability plot of residuals of (a) the maximum load capacity relationship and (b) amount of absorbed energy for PVB bonding material. Residual Percent 3002001000-100-200-300 99 95 90 80 70 60 50 40 30 20 10 5 1 Normal Probability Plot of the Residuals (response is MAX EVA 1) (a) Residual Percent 210-1-2 99 95 90 80 70 60 50 40 30 20 10 5 1 Normal Probability Plot of the Residuals (response is MAX EVA 2) (b) Figure 9. Normal probability plot of residuals of (a) the maximum load capacity relationship and (b) amount of absorbed energy for EVA bonding material. variability of the process because the adjusted R-sq = 90.3%. The analysis of variance of the process shows that the results are extremely significant as the P-value i s about zero. To find the suitable laminated glass with de- pendent variables x1 (thickness of glass) and x2 (the thic kness of t he PVB b onding interla yer) t hat can a bsorb the highes t amount of energy unt il fra cture, t he variab les x1and x2 can be changed. 3) The equation that relates the maximum load capac- ity as a dependent variable and thickness of glass (x1) and the thickness of the EVA bonding interlayer (x2) as in- dependent variables is: 12 Maximum load capacity (EVA)8818568.3 xx =−+ − (4) Figure 9(a) presents the normal percent probability of the residuals and shoes that the observations are drawn from independent variables and the standard deviation and the variance of both populations are equal as the plot 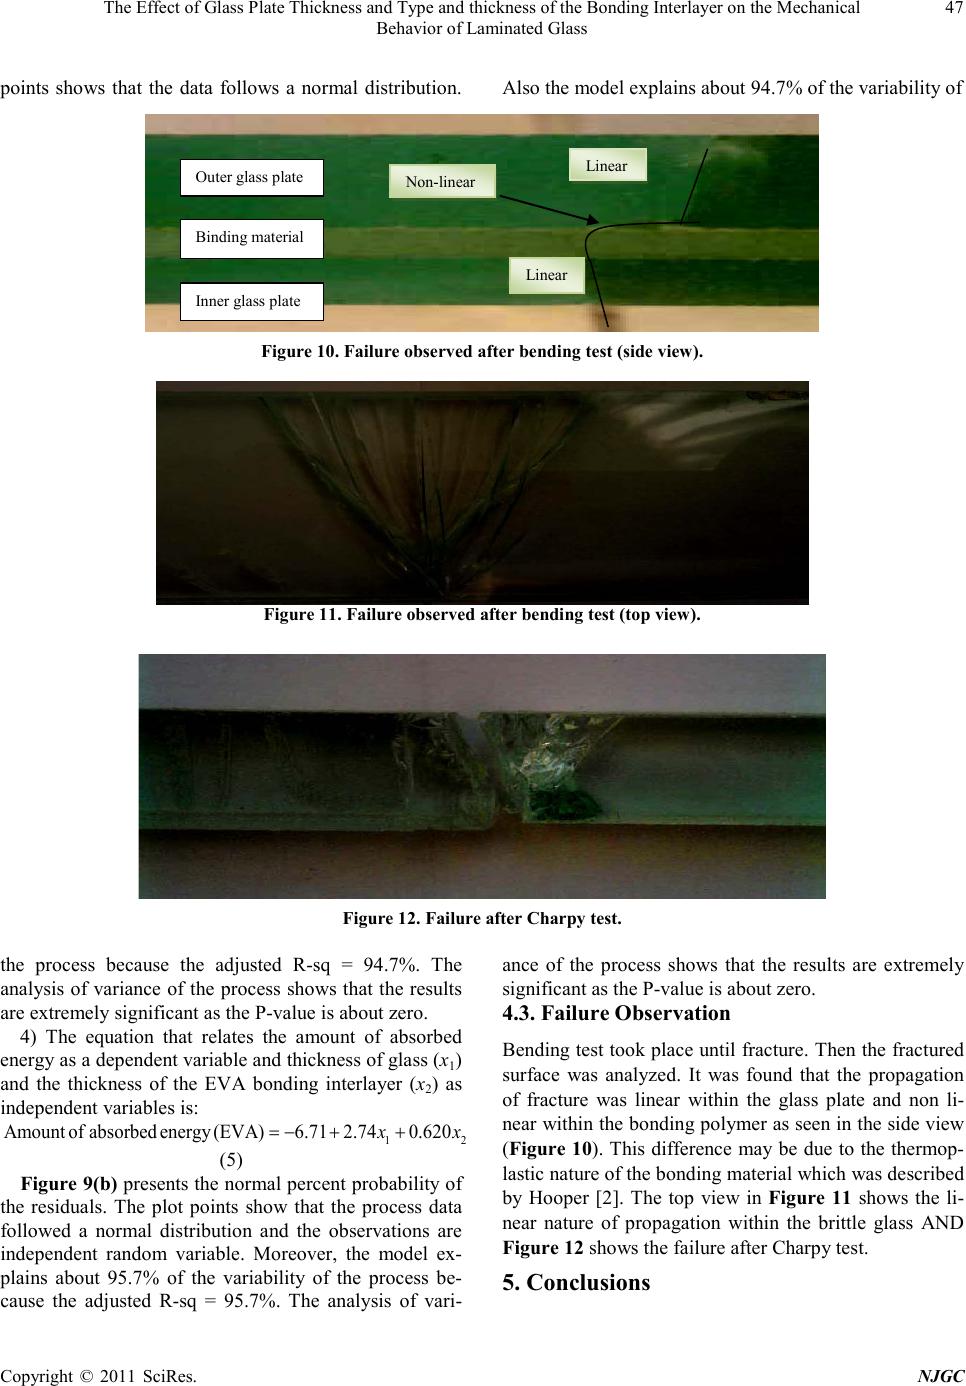 The Effect of Glass Plate Thickness and Type and thickness of the Bonding Interlayer on the Mechanical Behavio r of Laminated Glass Copyright © 2011 SciRes. NJGC 47 points shows that the data follows a normal distribution. Also the model explains about 94.7% of the variability of Figure 1 0. Failure observed aft er bendi ng test (side view). Figure 11. Failure obser ved after bending test (top view). Figure 1 2. Failure after Charpy t es t . the process because the adjusted R-sq = 94.7%. The analysis of variance of the process shows that the results are extremely significant as the P-value is about zero. 4) The equation that relates the amount of absorbed energy as a dependent variable and thickness of glass (x1) and the thickness of the EVA bonding interlayer (x2) as independent variables is: 12 Amountofabsorbedenergy(EVA)6.712.740.620xx=−+ + (5) Figure 9(b) presents the normal percent probability of the residuals. The plot points show that the process data followed a normal distribution and the observations are independent random variable. Moreover, the model ex- plains about 95.7% of the variability of the process be- cause the adjusted R-sq = 95.7%. The analysis of vari- ance of the process shows that the results are extremely significant as the P-value is about zero. 4.3. Failure Observation Bending test took place until fracture. Then the fractured surface was analyzed. It was found that the propagation of fracture was linear within the glass plate and non li- near within the bondi ng po lymer a s seen in t he side view (Figure 10). This difference may be due to the thermop- lastic nature of the bonding material which was described by Hooper [2]. The top view in Figure 11 shows the li- near nature of propagation within the brittle glass AND Figure 12 shows the failure after Charpy test. 5. Conclusions Linear Linear Non-linear Outer gla ss plate Inner glass plate Binding material  The Effect of Glass Plate Thickness and Type and thickness of the Bonding Int er layer on the Mechanical Behavio r of Laminated Glass Copyright © 2011 SciRes. NJGC 48 The conclusions that can be drawn from this investiga- tion are: 1) The higher the thickness of interlayer, the less the maximum load capacity of the laminated glass bonded whether wit h PVB or E V A bo nd ing material for the fixed thicknes s of t he inner glas s plate 2) The position of the plate of the fixed thickness does not affect the maximum load capacity and the maximum load capacity for laminated glasses bonded with EVA is grea ter than t hat for the o nes bo nded with P VB pro vided that the same conditions are maintained 3) The higher the thickness of bonding interlayer, the higher the amount of the absorbed energy whether the laminated glass bonded with PVB or EVA bonding ma- terial. Moreover, the laminated glass which is bonded with PVB absorbs more energy than those bonded with EVA 4) Regression models were developed to calculate the maximum load capacity and the amount of absorbed energy separately depending on the thickness of glass and the thick ness o f the bo nding i nterl ayer regard less the position of glass plates. Positive variables are taken into consi deration during calcula t io ns . 5) The propagation of fracture was linear within the glas s plate and non linear within the bonding polymer REFERENCES [1] R. Quenett, “The Mechanical Behavior of Laminated Safety Glass under Bending and Impact Stresses,” Ma- nuskript-Eing, Forgetragen auf dem DVM-Tag, Wurz- burg, 1967. [2] J. A. Hooper, “On the Bending of Architectural Lami- nated Glass,” International Journal of Mechanical Science, Vol. 15, No. 4, 1973, pp. 309-333. doi:10.1016/0020-7403(73)90012-X [3] P ilkington ACI, “A Practical and Theoretical Investiga- tion into the Strength of Laminated Glasses under Un- iformly Distributed Loading,” Laboratory Report and Discussion, Pilkington ACI Operations Pty. Ltd., 1971, p. 206. [4] M. P. Linden, J. E. Minor, R. A. Behr and C. V. C. Val- labh an, “Evaluation of laterally Loaded Laminated Glass Units by Theory and Experiment,” Supplemental Report No. 1, Glass Research and Testing Laboratory, Texas Tech University, Lubbock, 1983. [5] H. S. Norville, “Breakage Tests of Du Pont Laminated Glass Units,” Glass Research and Testing Laboratory, Texas Tech University, Lubbock, 1990. [6] K. Uwe, “Measuring the delaminating Energy in Lami- nated Safety Glass,” Proceedings of Glass Processing, Finland, 17-20 June 2005 , pp. 102-104. [7] S. R. Nagalla, C. V. G. Va llab han, J. E. Minor and H. S. Norville, “Stresses in Layered Units and Monolithic Glass Plates,” NTIS Accession No. PB86-142015/AS, Glass Research and Testing Laboratory, Texas Tech University, Lubbock, 1985. [8] J. E. Minor and P. L. Reznik, “Failure Strength of Lami- nated Glass, ” Journal of Structural Engineering ASCE, Vol. 116, No. 4, 1990, pp. 1030-1039. doi:10.1061/(ASCE)0733-9445(1990)116:4(1030) [9] M. P. Linden, J. E. Minor and C. V. C. Vallabhan, “Evaluation of Laterally Loaded Laminated Glass Units by Theory and Experiment,” Glass Research and Testing Laboratory, Texas Tech University, Lubbock, 1984. [10] B. Weller, “Experimental Study on Different Interlayer Materials for Laminated Glass,” Glass Processin g Days, Finland, 2005, pp. 386-394. [11] R. A. Behr and P. A. Kremer, “Dynamic St rains in Arc- hitectural Laminated Glass Subjected to Low Velocity Impacts From Small Projectiles,” Journal of Materials Scien ce, Vol. 34, No. 23, 1999, pp . 5749-5756. doi:10.1023/A:1004702100357 [12] M. Y. Zang, Z. Lei and S. F. Wang, “Investigation of Impact Fracture Behavior of Automobile Laminated Glass by 3D Discret e Element Meth od,” Sprin ger Verl ag, Berlin, 2007. [13] J. Belis, J. Depauw, D. Call ewa er, D. Deli ncé and R. Van Impe, “Failure Mechanisms and Residual Capacity of Annealed Glass/SGP Laminated Beams at Room Tem- perature,” Journal of Materials Science, Vol. 16, No. 6, 2008, pp. 1866-1875. |