

Paper Menu >>
Journal Menu >>
 Journal of Environmental Protection, 2011, 2, 525-532 doi:10.4236/jep.2011.25060 Published Online July 2011 (http://www.scirp.org/journal/jep) Copyright © 2011 SciRes. JEP Black Carbon Instead of Particle Mass Concentration as an Indicator for the Traffic Related Particles in the Brussels Capital Region Peter Vanderstraeten1, Michael Forton1, Olivier Brasseur1, Zvi Y. Offer2 1Brussels Institute for the Management of the Environment, Laboratory for Environmental Research, Brussels, Belgium; 2The Jacob Blaustein Institutes for Desert Research, Ben-Gurion University, Sede Boqer Campus, Israel. Email: {pvd, mfo}@ibgebim.be, [email protected], [email protected] Received February 20th, 2011; revised April 1st, 2011; accepted May 4th, 2011. ABSTRACT The Brussels Capital Region has difficulties in meeting the stringent EU daily limit va lue for PM10 in all its measuring sites. Postponing the attainment of the deadline was not granted by the EU Commission, mainly due to insufficient judged measures to reduce road traffic emissions. However, a thorough analysis of the data makes clear that neither the particle mass concentration (PM10 and PM2.5) nor the particle number concentration a re specific metrics for eva- luating the pa rticle pollution originated by traffic. In fa ct, increased formation o f secondary aerosol, together with ad- verse meteorological conditions and the (re) suspension of the coarser fraction are by far the three main explanations for the numerous PM10 exceeding values. From our experience, amongst the particles measured, only the results for Black Carbon (BC), mainly present in the lower submicron range, a re reflective of the direct influence of lo cal traffic. Measured at two traffic sites a long with PM mass and number concentra tions, the data for Black Carbon show a strik- ing correlation with nitrogen monoxid e, a parameter strongly related with the proximity of the lo cal traffic. The corre- lation factor between Black Carbon data and NO or NOX is much higher than between Black Carbon and the PM mass or number concentration. Therefore the assessment of traffic related particles should consider Black Carbon rather than PM10 or PM2.5. Keywords: Black Carbon, PM10, PM2.5, Particle Mass Concentration, Particle Number Concentration 1. Introduction and Methods The air quality in the Brussels urban region has been measured since 1968. The telemetric network consists of 11 measuring sites, covering a variety of distinct urban environments and measuring all pollutants imposed by the EU regulations (2008/50/CE). Nitrogen oxides are measured in all eleven measuring sites, particle mass concentration PM10 and PM2.5 are measured in 6 and 5 of these locations respectively, by the use of continuous TEOM 1400Ab analyzers (tapered element oscillating microbalance) equipped with FDMS 8500 modules (fil- ter dynamics measurement system). Other measurements concern ozone, carbon monoxide, sulfur dioxide, carbon dioxide, benzene with a selection of twelve volatile organic components (VOC), benzo a pyrene together with ten other polyaromatic hydrocar- bons (PHA) and finally heavy metals such as lead, arse- nic, nickel, cadmium and mercury vapor. Different measurements started between 1968 and 1990, and sys- tems were improved during the upgrade of the network to its present config uration (1994-2002). Since 2008 the particle number concentration is meas- ured along with the particle mass concentration in two traffic oriented sites. The number of particles is regis- tered for 31 different size classes, with diameters ranging from 0.25 µm to 32 µm, by means of Grimm laser light scattering spectrometers, model 365. One of the two sites, Woluwe, is located along a highway leading the traffic coming from the East towards the centre of Brussels, its immediate surrounding having a relatively open structure. The second one, at Molenbeek, along the economic and commercial axis of the Region, is situated mu ch closer to the Brussels urban centre. At these same sites monitoring Black Carbon was started, in July 2009 and July 2010 respectively, using an aethalometer, model AE22-ER from Magee Scientific. At the Molenbeek site, Black Smoke measurements according to the older OECD method [1] 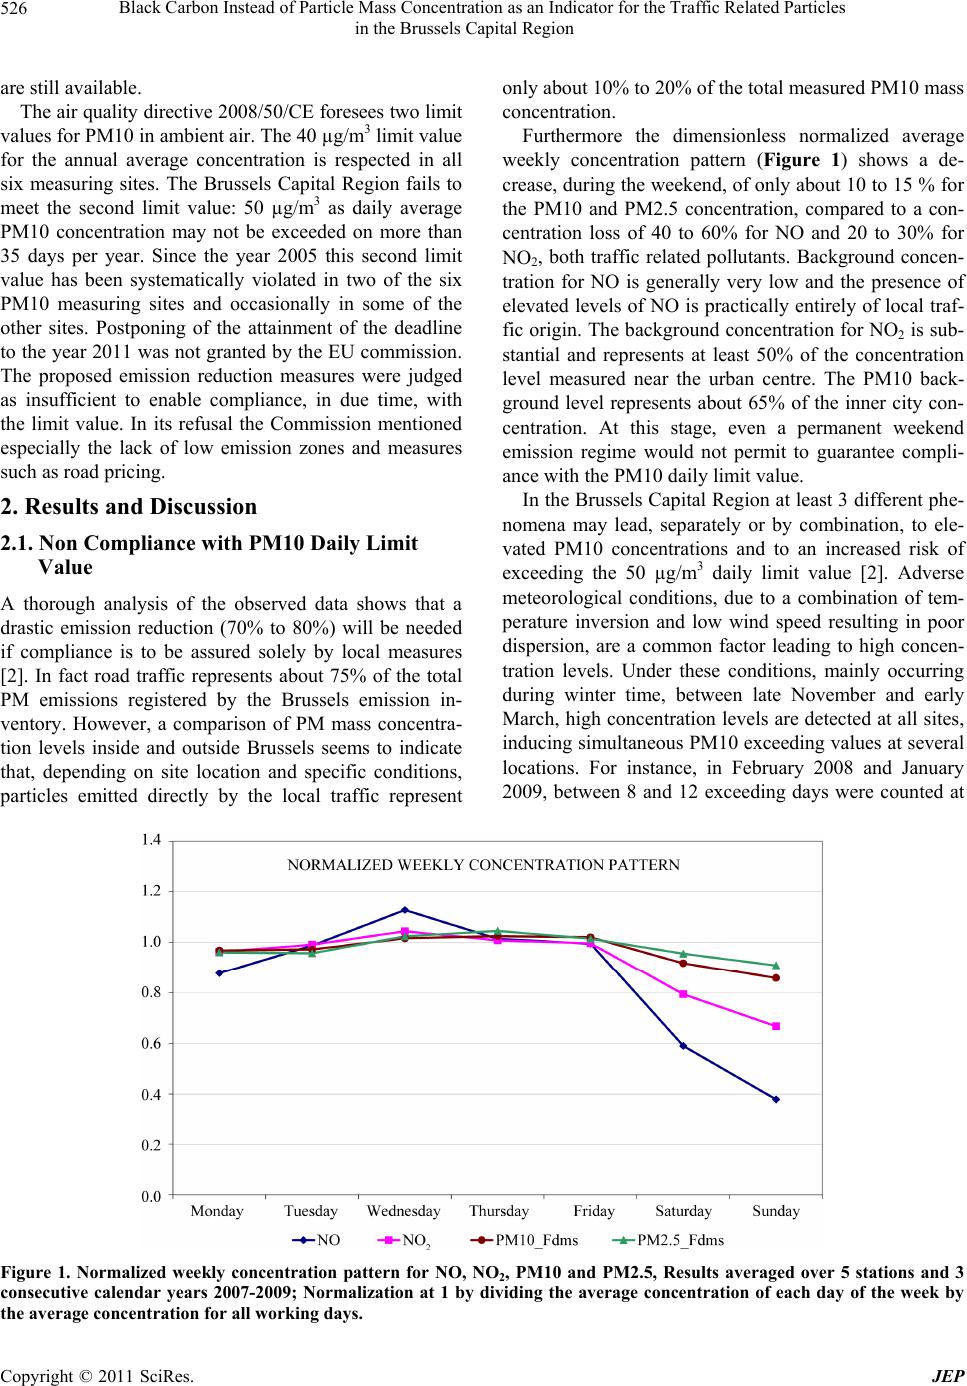 Black Carbon Instead of Particle Mass Concentration as an Indicator for the Traffic Related Particles 526 in the Brussels Capital Region are still available. The air quality directive 2008/5 0/CE foresees two limit values for PM10 in ambient air. The 40 µg/m3 limit value for the annual average concentration is respected in all six measuring sites. The Brussels Capital Region fails to meet the second limit value: 50 µg/m3 as daily average PM10 concentration may not be exceeded on more than 35 days per year. Since the year 2005 this second limit value has been systematically violated in two of the six PM10 measuring sites and occasionally in some of the other sites. Postponing of the attainment of the deadline to the year 2011 was no t granted by the EU commission. The proposed emission reduction measures were judged as insufficient to enable compliance, in due time, with the limit value. In its refusal the Commission mentioned especially the lack of low emission zones and measures such as road pricing. 2. Results and Discussion 2.1. Non Compliance with PM10 Daily Limit Value A thorough analysis of the observed data shows that a drastic emission reduction (70% to 80%) will be needed if compliance is to be assured solely by local measures [2]. In fact road traffic represents about 75% of the total PM emissions registered by the Brussels emission in- ventory. However, a comparison of PM mass concentra- tion levels inside and outside Brussels seems to indicate that, depending on site location and specific conditions, particles emitted directly by the local traffic represent only about 10% to 20% of the total measured PM10 mass concentration. Furthermore the dimensionless normalized average weekly concentration pattern (Figure 1) shows a de- crease, during the weekend, of only about 10 to 15 % for the PM10 and PM2.5 concentration, compared to a con- centration loss of 40 to 60% for NO and 20 to 30% for NO2, both traffic related pollutants. Background concen- tration for NO is generally very low and the presence of elevated levels of NO is practically entirely of local traf- fic origin. The background concentration for NO2 is sub- stantial and represents at least 50% of the concentration level measured near the urban centre. The PM10 back- ground level represents about 65% of the inner city con- centration. At this stage, even a permanent weekend emission regime would not permit to guarantee compli- ance with the PM10 daily limit value. In the Brussels Capital Region at least 3 different phe- nomena may lead, separately or by combination, to ele- vated PM10 concentrations and to an increased risk of exceeding the 50 µg/m3 daily limit value [2]. Adverse meteorological conditions, due to a combination of tem- perature inversion and low wind speed resulting in poor dispersion, are a common factor leading to high concen- tration levels. Under these conditions, mainly occurring during winter time, between late November and early March, high concentration levels are detected at all sites, inducing simultaneous PM10 exceeding values at several locations. For instance, in February 2008 and January 2009, between 8 and 12 exceeding days were counted at Figure 1. Normalized weekly concentration pattern for NO, NO2, PM10 and PM2.5, Results averaged over 5 stations and 3 consecutive calendar years 2007-2009; Normalization at 1 by dividing the average concentration of each day of the week by the average concentration for all working days. C opyright © 2011 SciRes. JEP  Black Carbon Instead of Particle Mass Concentration as an Indicator for the Traffic Related Particles 527 in the Brussels Capital Region the different measuring sites in Brussels. A second phenomenon, very important and still unde- restimated is the formation of secondary aerosol, mainly during the period March-April and to a lesser extent dur- ing September-October. The spreading of manure on a large scale, in the surrounding regions, before and after the agricultural season, releases a massive source of am- monia. At conditions of moderate temperature and high relative humidity, together with the presence of NO2, a stable secondary aerosol is formed with ammonium ni- trate as a main component. During the month of April 2007 and again in April 2009 this formation caused be- tween 8 and 16 exceeding days at the different measuring sites in Brussels. Due to the same phenomenon the 2006 car free Sunday achieved the second highest daily value of that year [3] and the car free Su nd ay of 2009 proved to be one of the other surprising exceeding days. Numerous studies, performed at different locations in Europe as well as in the USA, emphasize the importance of secon- dary aerosol and the inorganic and/or organic compo- nents involved. This has also been reported more recently by several research teams [4-8]. The third phenomenon, (re)suspension of the coarser fraction (particles between 2.5 and 10 µm) is linked with the advection of dry air, mainly coming from the large eastern sector. Under these conditions and in the pres- ence of a local source, particles of the coarser fraction are suspended by the wind and/or by the turbulences created by the traffic [2]. Due to the presence of local sources, this phenomenon is more frequently encountered at the two measuring sites where the limit value is systemati- cally exceeded. 2.2. Car Free Sunday 2009—Black Carbon, Particle Mass and Number Concentration On Sunday the 20 th September 2009, for the eighth time, a car free Sunday was organized by the Brussels authori- ties. From 9:00 till 19:00 h local time (7:00 till 17:00 h UT), all private road traffic was banned over the entire Brussels Capital Region. Only public transport, emer- gency services, taxis and a limited number of exceptions were allowed and the speed limit was set at 30 km/hr. During the morning the wind was mainly coming from the south, just before noon suddenly it changed and started blowing from north-northwest till late in the eve- ning, importing polluted air masses with secondary aerosol already formed over the western part of Belgium. Meteorological conditions could be considered as rela- tively unfavorable to pollution dispersion during the ear- ly morning, but rather favorable in the late morning and the afternoon. The boundary layer computed from ECMWF fields, increased from 60 m in the morning to 950 m in the afternoon. In the middle of the car free period a sharp and sudden concentration increase of PM10 and PM2.5 mass con- centrations was observed in all Brussels measuring sites, with maximum h alf hourly PM10 concen trations ranging between 100 an d 120 µg /m3 (>90% as PM2.5), leading to average PM10 concentrations exceeding the 50 µg/m3 daily limit value. At the same time particle number con- centrations increased for all size ranges between 0.25 and 2.5 µm, with a maximum of ±1.200 .000 p articles per liter of air for the total number of particles above 0.25 µm (Figure 2), reaching one of the highest half hourly values (99.8the percentile) of the whole year 2009. However, such an increase was not observed for the coarser frac- tion, particles above 2.5 µm, mainly from mineral origin, put into (re)suspension by the wind or by the turbulences created by road traffic. The graph in Figure 3 represents, for the period from Friday the 18th till Tuesday 22 September 2009, the dy- namic evolution of the half hourly values for Black Car- bon, the PM10 mass concentration and NO at the Wolu- we site. The data for Black Carbon refer to the concentra- tion scale on the left (0 - 21 µg/m3) and those for PM10 and NO to the scale on the right (0 - 140 µg/m3). The traffic ban hours during the car free Sunday are indicated by the short horizontal line in the middle. During the traffic ban hours the PM10 concentration peaks, while the Black Carbon level continues to decrease, quite op- posed to PM10. Clearly, the evolution of Black Carbon does not always follow that for PM10 but rather that of the traffic related NO, as can be seen from the results on Saturday the 19th and during the morning and evening rush hours of Monday 21st Septembe r. 2.3. Correlation between Black Carbon, NO, NOX, PM Mass and Number Concentration The observations made during the 2009 car free Sunday stand also for longer periods. This is well illustrated by the evolution of the half hourly data for February 2010. The graph in Figure 4 represents the data for Black Car- bon and PM10 and the graph in Figure 5 those for BC and NO. Data for BC refer to the left scale (0 - 14 µg/m3) and those for PM10 and NO respectively to the scales on the right (0 - 140 µg/m3). On average and for most of the time, the BC and PM10 concentrations follow nearly the same pattern (Figure 4), meaning that there is roughly a factor 10, corresponding to the scaling factor, between the concen- tration levels. However, although many peak values do coincide, there are several discrepancies during other peak periods: high peak values for PM10 and not for BC or vice versa. Copyright © 2011 SciRes. JEP  Black Carbon Instead of Particle Mass Concentration as an Indicator for the Traffic Related Particles 528 in the Brussels Capital Region Figure 2. Particle Number concentration—Number of Particles > 0.25 µm on an average Sunday, an average working day and the car free Sunday 20 September 2009. Figure 3. Black Carbon, PM10 and NO—Concentration Evolution between Friday 18 and Tuesday 22 September 2009 with the Car free Sunday 20 Se ptember. C opyright © 2011 SciRes. JEP  Black Carbon Instead of Particle Mass Concentration as an Indicator for the Traffic Related Particles 529 in the Brussels Capital Region Figure 4. Black Carbon and PM10—Woluwe site—February 2010, Evolution half hourly concentration values. Figure 5. Black Carbon and NO—Woluwe site—February 2010, Evolution half hourly concentration values. A very clear example is illustrated by the situation between February 6th - 9th, indicated in the graph between two vertical dashed lines. The presence of high peak values, both for PM10 and PM2.5, but without an associ- ated Black Carbon peak, gives a strong indication for pollution by particles that are not from local origin. This may be the result of the formation of secondary aerosol and/or an importation of particles from a distant origin. When however no high PM2.5 values would be associ- ated with a PM10 peak, then the (re)suspension of the coarser particles (2.5 - 10 µm), would be a more likely explanation. Copyright © 2011 SciRes. JEP 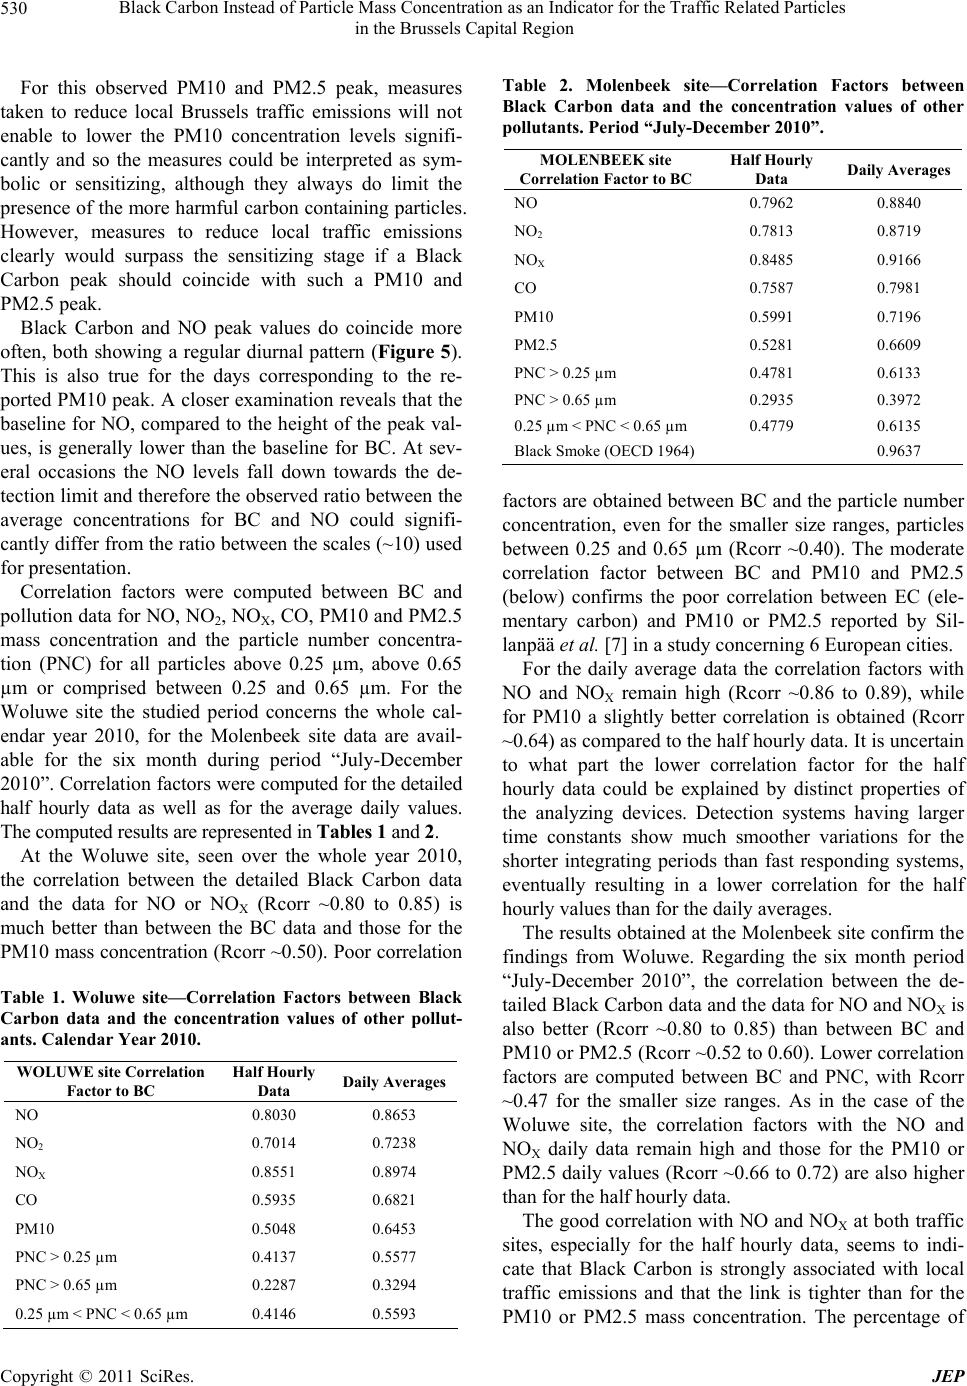 Black Carbon Instead of Particle Mass Concentration as an Indicator for the Traffic Related Particles 530 in the Brussels Capital Region For this observed PM10 and PM2.5 peak, measures taken to reduce local Brussels traffic emissions will not enable to lower the PM10 concentration levels signifi- cantly and so the measures could be interpreted as sym- bolic or sensitizing, although they always do limit the presence of the more harmful carbon containing particles. However, measures to reduce local traffic emissions clearly would surpass the sensitizing stage if a Black Carbon peak should coincide with such a PM10 and PM2.5 peak. Black Carbon and NO peak values do coincide more often, both showing a regular diurnal pattern (Figure 5). This is also true for the days corresponding to the re- ported PM10 peak. A closer examination reveals that the baseline for NO, compared to the height of the peak val- ues, is generally lower than the baseline for BC. At sev- eral occasions the NO levels fall down towards the de- tection limit and therefore the observed ratio between the average concentrations for BC and NO could signifi- cantly differ from the ratio between the scales (~10) used for presentation. Correlation factors were computed between BC and pollution data for NO, NO2, NOX, CO, P M10 and PM2.5 mass concentration and the particle number concentra- tion (PNC) for all particles above 0.25 µm, above 0.65 µm or comprised between 0.25 and 0.65 µm. For the Woluwe site the studied period concerns the whole cal- endar year 2010, for the Molenbeek site data are avail- able for the six month during period “July-December 2010”. Correlation factors were computed for the detailed half hourly data as well as for the average daily values. The computed results are represented in Tables 1 and 2. At the Woluwe site, seen over the whole year 2010, the correlation between the detailed Black Carbon data and the data for NO or NOX (Rcorr ~0.80 to 0.85) is much better than between the BC data and those for the PM10 mass concentration (Rcorr ~0.50). Poor correlation Table 1. Woluwe site—Correlation Factors between Black Carbon data and the concentration values of other pollut- ants. Calendar Year 2010. WOLUWE site Correlation Factor to BC Half Hourly Data Daily Averages NO 0.8030 0.8653 NO2 0.7014 0.7238 NOX 0.8551 0.8974 CO 0.5935 0.6821 PM10 0.5048 0.6453 PNC > 0.25 µm 0.4137 0.5577 PNC > 0.65 µm 0.2287 0.3294 0.25 µm < PNC < 0.65 µm 0.4146 0.5593 Table 2. Molenbeek site—Correlation Factors between Black Carbon data and the concentration values of other pollutants. Period “July-December 2010”. MOLENBEEK site Correlation Factor to BC Half Hourly Data Daily Averages NO 0.7962 0.8840 NO2 0.7813 0.8719 NOX 0.8485 0.9166 CO 0.7587 0.7981 PM10 0.5991 0.7196 PM2.5 0.5281 0.6609 PNC > 0.25 µm 0.4781 0.6133 PNC > 0.65 µm 0.2935 0.3972 0.25 µm < PNC < 0.65 µm 0.4779 0.6135 Black Smoke (OECD 1964) 0.9637 factors are obtained between BC and the particle number concentration, even for the smaller size ranges, particles between 0.25 and 0.65 µm (Rcorr ~0.40). The moderate correlation factor between BC and PM10 and PM2.5 (below) confirms the poor correlation between EC (ele- mentary carbon) and PM10 or PM2.5 reported by Sil- lanpää et al. [7] in a study concerning 6 Euro pean cities. For the daily average data the correlation factors with NO and NOX remain high (Rcorr ~0.86 to 0.89), while for PM10 a slightly better correlation is obtained (Rcorr ~0.64) as compar ed to the half hour ly data. It is uncertain to what part the lower correlation factor for the half hourly data could be explained by distinct properties of the analyzing devices. Detection systems having larger time constants show much smoother variations for the shorter integrating periods than fast responding systems, eventually resulting in a lower correlation for the half hourly values than for the daily averages. The results obtained at the Molenbeek site co nfirm the findings from Woluwe. Regarding the six month period “July-December 2010”, the correlation between the de- tailed Black Carbon data and th e data for NO and NOX is also better (Rcorr ~0.80 to 0.85) than between BC and PM10 or PM2.5 (Rcorr ~0.52 to 0.60). Lower correlation factors are computed between BC and PNC, with Rcorr ~0.47 for the smaller size ranges. As in the case of the Woluwe site, the correlation factors with the NO and NOX daily data remain high and those for the PM10 or PM2.5 daily values (Rcorr ~0.66 to 0.72) are also higher than for the hal f hourly data. The good correlation with NO an d NOX at both traffic sites, especially for the half hourly data, seems to indi- cate that Black Carbon is strongly associated with local traffic emissions and that the link is tighter than for the PM10 or PM2.5 mass concentration. The percentage of C opyright © 2011 SciRes. JEP 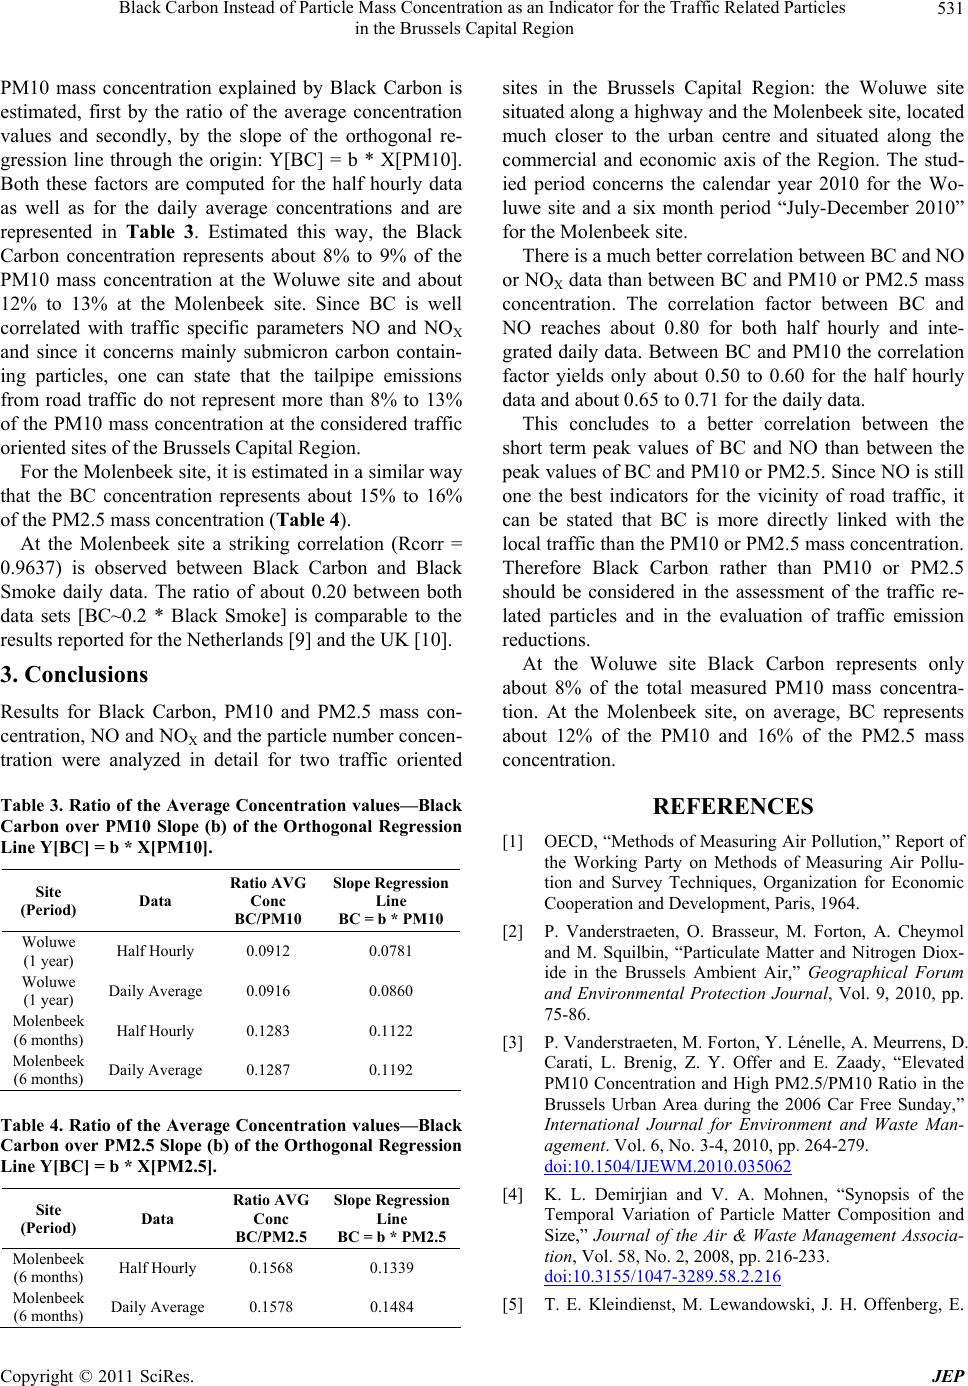 Black Carbon Instead of Particle Mass Concentration as an Indicator for the Traffic Related Particles 531 in the Brussels Capital Region PM10 mass concentration explained by Black Carbon is estimated, first by the ratio of the average concentration values and secondly, by the slope of the orthogonal re- gression line through the origin: Y[BC] = b * X[PM10]. Both these factors are computed for the half hourly data as well as for the daily average concentrations and are represented in Table 3. Estimated this way, the Black Carbon concentration represents about 8% to 9% of the PM10 mass concentration at the Woluwe site and about 12% to 13% at the Molenbeek site. Since BC is well correlated with traffic specific parameters NO and NOX and since it concerns mainly submicron carbon contain- ing particles, one can state that the tailpipe emissions from road traffic do not represent more than 8% to 13% of the PM10 mass concentration at the considered traffic oriented sites of the Brussels Capital Reg ion. For the Molenbeek site, it is estimated in a similar way that the BC concentration represents about 15% to 16% of the PM2.5 mass concent ration (Table 4). At the Molenbeek site a striking correlation (Rcorr = 0.9637) is observed between Black Carbon and Black Smoke daily data. The ratio of about 0.20 between both data sets [BC~0.2 * Black Smoke] is comparable to the results reported for the Netherlands [9] and the UK [10]. 3. Conclusions Results for Black Carbon, PM10 and PM2.5 mass con- centration, NO and NOX and the particle number concen- tration were analyzed in detail for two traffic oriented Table 3. Ratio of the Average Concentration values—Black Carbon over PM10 Slope (b) of the Orthogonal Regression Line Y[BC] = b * X[PM10]. Site (Period) Data Ratio AVG Conc BC/PM10 Slope Regression Line BC = b * PM10 Woluwe (1 year) Half Hourly 0.0912 0.0781 Woluwe (1 year) Daily Average 0.0916 0.0860 Molenbeek (6 months) Half Hourly 0.1283 0.1122 Molenbeek (6 months) Daily Average 0.1287 0.1192 Table 4. Ratio of the Average Concentration values—Black Carbon over PM2.5 Slope (b) of the Orthogonal Regression Line Y[BC] = b * X[PM2.5]. Site (Period) Data Ratio AVG Conc BC/PM2.5 Slope Regression Line BC = b * PM2.5 Molenbeek (6 months) Half Hourly 0.1568 0. 1 3 39 Molenbeek (6 months) Daily Average 0.1578 0.1484 sites in the Brussels Capital Region: the Woluwe site situated along a highway and the Molenbeek site, located much closer to the urban centre and situated along the commercial and economic axis of the Region. The stud- ied period concerns the calendar year 2010 for the Wo- luwe site and a six month period “July-December 2010” for the Molenbeek site. There is a much better correlation between BC and NO or NOX data than between BC and PM10 or PM2.5 mass concentration. The correlation factor between BC and NO reaches about 0.80 for both half hourly and inte- grated daily data. Between BC and PM10 the correlation factor yields only about 0.50 to 0.60 for the half hourly data and about 0.65 to 0.71 for the daily data. This concludes to a better correlation between the short term peak values of BC and NO than between the peak values of BC and PM10 or PM2.5. Since NO is still one the best indicators for the vicinity of road traffic, it can be stated that BC is more directly linked with the local traffic than the PM10 or PM2.5 mass concentration. Therefore Black Carbon rather than PM10 or PM2.5 should be considered in the assessment of the traffic re- lated particles and in the evaluation of traffic emission reductions. At the Woluwe site Black Carbon represents only about 8% of the total measured PM10 mass concentra- tion. At the Molenbeek site, on average, BC represents about 12% of the PM10 and 16% of the PM2.5 mass concentration. REFERENCES [1] OECD, “Methods of Measuring Air Pollution,” Report of the Working Party on Methods of Measuring Air Pollu- tion and Survey Techniques, Organization for Economic Cooperation and Development, Paris, 1964. [2] P. Vanderstraeten, O. Brasseur, M. Forton, A. Cheymol and M. Squilbin, “Particulate Matter and Nitrogen Diox- ide in the Brussels Ambient Air,” Geographical Forum and Environmental Protection Journal, Vol. 9, 2010, pp. 75-86. [3] P. Vanderstraeten, M. Forton, Y. Lénelle, A. Meurrens, D. Carati, L. Brenig, Z. Y. Offer and E. Zaady, “Elevated PM10 Concentration and High PM2.5/PM10 Ratio in the Brussels Urban Area during the 2006 Car Free Sunday,” International Journal for Environment and Waste Man- agement. Vol. 6, No. 3-4, 2010, pp. 264-279. doi:10.1504/IJEWM.2010.035062 [4] K. L. Demirjian and V. A. Mohnen, “Synopsis of the Temporal Variation of Particle Matter Composition and Size,” Journal of the Air & Waste Management Associa- tion, Vol. 58, No. 2, 2008, pp. 216-233. doi:10.3155/1047-3289.58.2.216 [5] T. E. Kleindienst, M. Lewandowski, J. H. Offenberg, E. Copyright © 2011 SciRes. JEP  Black Carbon Instead of Particle Mass Concentration as an Indicator for the Traffic Related Particles in the Brussels Capital Region Copyright © 2011 SciRes. JEP 532 O. Edney, M. Jaoui, M. Zheng, X. Ding, E. S. Edegerton, “Contribution of Secondary Sources to Organic Aerosol and PM2.5 at Search Network Sites,” Journal of the Air & Waste Management Association, Vol. 60, No. 11, 2010, pp. 1388-1399. doi:10.3155/1047-3289.60.11.1388 [6] J.-P. Putaud, et al. “A European Aerosol Phenomenology – 3: Physical and Chemical Characteristics of Particulate Matter from 60 Rural, Urban and Kerbside Sites across Europe,” Atmospheric Environment, Vol. 44, No. 10, 2010, pp. 1308-1320. doi:10.1016/j.atmosenv.2009.12.011 [7] M. Sillanpää, et al. “Chemical Composition and Mass Closure of Particulate Matter at Six Urban Sites in Eu- rope,” Atmospheric Environment, Vol. 40, Suppl. 2, 2006, pp. 212-223. doi:10.1016/j.atmosenv.2006.01.063 [8] X. Querol, A. Alastuey, C. R. Ruiz, B. Artinano, H. C. Hansson, R. M. Harisson, E. Buringh, H. M. ten Brink, M. Lutz, P. Bruckmann, P. Straehl, J. Schneider, “Specifia- tion and Origin of PM10 and PM2.5 in Selected European Cities,” Atmospheric Environment, Vol. 38, No. 38, 2004, pp. 6547-6555. doi:10.1016/j.atmosenv.2004.08.037 [9] M. Schaap and H. A. C. Denier van der Gon, “On the Variability of Black Smoke and Carbonaceous Aerosols in the Netherlands,” Atmospheric Environment, Vol. 41, No. 28, 2007, pp. 5908-5920. doi:10.1016/j.atmosenv.2007.03.042 [10] P. Quincey, “A Relationship between Black Smoke Index and Black Carbon concentration,” Atmospheric Environ- ment, Vol. 41, No. 36, 2007, pp. 7964-7968. doi:10.1016/j.atmosenv.2007.09.033 |