

Paper Menu >>
Journal Menu >>
 Sociology Mind 2011. Vol.1, No.3, 130-137 Copyright © 2011 SciRes. DOI:10.4236/sm.2011.13016 Remittances from Internal Migration and Poverty in Botswana* Eugene K. Campbell1, Ngianga-Bakwin Kandala2 1Department of Population Studies, University of Botswana, Botswana; 2University of Warwick, Warwick Medical School, Coventry, England. Email: [email protected] Received April 19th, 2011; revised May 23rd, 2011; accepted June 24th, 2011. This study seeks to address the question of the existence of a relationship between remittances from internal la- bour migrants and poverty. Data was obtained from a stratified random sample survey of internal migrants and poverty in Botswana in 2004. A structured questionnaire was used to collect data from the migrants. A total of 1160 migrant households were enumerated. The lived poverty index method is used to estimate the level of pov- erty. It takes the social aspect of development into consideration, thereby reducing the limitations of the eco- nomic measurement of poverty. Logistic regression analysis is used to examine the remittance-poverty relation- ship. Though female-headed households are transitorily poorer than their male counterparts, there is no signifi- cant gender difference among the extremely poor. The results do not show conclusively that migrant remittances have moderating effect on poverty in the country. Policy implications are addressed. Keywords: Botswana, Migrant, Poverty, Remittance Introduction Though migrant remittances have increased considerably since the 1980s, it is still not certain what impact remittances from internal migration make on poverty mitigation in develop- ing countries and especially in Sub Saharan Africa (SSA). This is partly because, until recently, much of the funding for popula- tion studies went to reproductive health while the effects of globalization focused recent research on international migration. It is general knowledge that pre-1990 remittances were generally quite low in SSA (Caldwell, 1969; Adepoju, 1974; Lucas, 1982). Rempel & Lobdell (1978) concluded that the monies migrants remitted from urban areas in Kenya made no significant contri- bution to economic development in rural areas. These findings may have been due to the assumption that urban-rural remit- tances were made primarily to develop rural communities, as Gould (1995) also appears to have done. An additional contrib- uting factor may be the relatively low real wages received in urban areas plus the negative effects of structural adjustment programmes on human development. As Taylor et al. (2005) and several others have observed, not much has been done to inves- tigate the relationship between migrants’ remittances and pov- erty. Using data from 71 developing countries throughout the world, Adams and Page (2005) found that international migra- tion reduces poverty significantly. This position is supported by studies in Latin America (Acosta et al., 2007) and Sub Saharan Africa (Gupta et al., 2009). But while there seems to be certainty at the international level, there is considerable uncertainty about the effect of internal migration on poverty. Moreover there still exist pessimists who fail to see the relationship between migra- tion and poverty mitigation. Among the principle areas of con- tention is the definition of poverty. However, personal incomes have increased substantially in many African countries and much more so in Botswana. Recent studies indicate increases in urban-rural remittances in South Africa and North Africa (Posel & Casale, 2003; Deshingkar & Grimm, 2004). This provides incentives to investigate changes that might have occurred in the ability of internal migrants to remit. The current paper re-examines the hypothesis that remit- tances assist families in Botswana to live above the poverty line. In a recent book on the Zimbabwean exodus, the resonance of remittance confirms the dominance of remittance as a determi- nant of African emigration (Crush & Tevera, 2010). The com- bination of poverty and altruism in rural African families has helped to fuel migrant remittances in the continent. There is considerable evidence to the effect that, in addition to the joy of having children, traditional and early transitional families in SSA and Asia value children particularly for the anticipated financial rewards that the parents accrue from them. This is the basis of the intergeneration wealth flows theory by John Cald- well (1978) and it forms a crucial part of the social behaviour of African families up till now. Though traditional African parents have not invested nearly as much financially on their children as Western parents have done since the early 20th century, it is within the framework of this theory that strong social bonds have developed between parent and child to the extent that the latter willingly offer to assist their parents (poor and not-poor) to obtain their basic and other needs. According to Foster (1998), a poor person or family is one whose resources are below the poverty threshold. Our under- standing of poverty has greatly improved since the 1960s when development was defined predominantly from an economic perspective, with per capita income as the primary factor. Hu- man development now includes social, political, psychological and biological factors and is widely acknowledged as a variable that is no longer restricted to individual and family income but serves as an index of living standards in societies (Seers, 1972; Deininger & Squire, 1996; Mattes, Bratton, & Davids, 2003). *This study was funded by the Canadian International Development Agency (CIDA) and the Department for International Development (DFID) through the executing agency, Southern African Migration Project (SAMP). The authors thank these organizations and peer reviewers for their useful contri- bution to this paper.  E. K. CAMPBELL ET AL. 131 This modern interpretation of the meaning of development, and hence poverty, has led to numerous examinations of the distinc- tions between absolute and relative poverty and transitory and extreme/chronic poverty. Transitory poverty refers to a tempo- rary state of poverty (frequently associated with students in ter- tiary institutions) from which individuals may emerge through education, employment increased income and self-control (Thaler & Shefrin, 1981; Jacoby, 1994; Foster, 1998; Rodgers & Rodgers, 2006). While several studies have attested to the importance of re- mittances in supplementing household income, there is no evi- dence yet that remittances have significant influence on poverty in Botswana. Since Lucas (1982) observed this, with apparent support from Izzard (1985), no study has been done about this subject from primary sources. Botswana Profile Since attaining political independence in 1966, Botswana has grown from being among the poorest countries in the world to having one of the most developed economies and societies in Africa. Notwithstanding the devastating effects of the current global economic depression, the government produced an im- pressive budget for the 2009/2010 financial year, thus indicat- ing that the state of the national economy is strong (Gaolathe, 2009). However, two of the issues that concern the government and public a great deal are unemployment (especially among young professionals) and poverty. It was generally acknowl- edged that rural households were generally poor with the ma- jority being female-headed households (Akinsola & Popovich, 2002). The Botswana Institute for Development Policy Analy- sis estimated that in 1993/94, 47% of Botswana citizens lived below the poverty line and it was argued that this figure re- flected substantial decline in poverty since 1985/86 (BIDPA, 1997). The government of Botswana also revealed considerable decline in poverty between the 1980s and now. Reportedly, “the poverty rates (fell) from 46.6 percent in 1985/86 to 30.2 percent in 2002/03” and it was assumed to be 23 percent five years later (Gaolathe, 2007: p. 1). It is difficult to determine the current official position on poverty because the budget speeches of 2008 and 2009 exclude specific figures of the country’s pov- erty level (Gaolathe, 2008, 2009). Much of the poverty in Botswana is due to unemployment. Though employment opportunities have increased over ten times since 1966, the production of skilled nationals has surpassed available jobs. Since 2000, the government has found it difficult to increase employment nationally (Anonymous, 2005). In a paper presented at the Review of the National Population Policy Delivery in June 2007, the UNECA revealed that unemployment began to rise in the 1990s especially among the youth. The Household Income and Expenditure Survey in 2002/2003 also revealed a national unemployment rate of 24% with school leavers between 15 and 24 years old being the worst affected (Botswana, 2007). The observations about unemployment in Botswana and the higher poverty figures provided by other sources make contentious the government’s poverty rate. Meanwhile, since the 19th Century, poverty has been influential in encouraging spouses, offspring and siblings to migrate in anticipation of financial returns to families at home (Schapera, 1947). Though Lucas (1982) observed that remittances from internal and international sources were quite low previously, the situation has changed considerably for the better especially due to accelerated increase in education and income since the 1990s. Research Methodology This paper is part of a major study of migration, remittances and poverty which was undertaken by the Southern African Migration Project (SAMP) in eight countries in the Southern African Development Community (SADC) region between June and August 2004. The objectives, organization, sample design and questionnaires used in these surveys are described elsewhere (see Campbell, 2010). The survey was done from a random sample of internal migrants and the design used is appropriate to minimize bias in the selection of migrant households. Briefly, the data collection was national and was based on stratified and cluster sampling. The sample was selected from internal migrant households and was designed to be propor- tional to population size in each stratum. The households were drawn from all major land use areas of the country including primary and secondary urban centers as well as major commu- nal areas. Hence the major areas of origin and destination of internal migrants were represented. A two-stage sample selec- tion was done. The first stage was a random selection of district and urban areas from 36 census districts. This determined the number of primary sampling units (PSU) selected countrywide. Where the population was very small no selection was done as it was not cost effective. In the second stage, enumeration areas (EA) were randomly selected from each of the rural and urban areas. The sample EAs were selected to be proportionate to the size of the PSU. A sample of 30 EAs was randomly selected from each of the enumeration areas. From the 2001 national census population, an initial sample of 1200 migrant house- holds was selected. An example of the proportional selection is that in Gaborone about 11.8% of the households were drawn as this was the proportion of households in the city in relation to the national population of households. In Gaborone and Fran- cistown (the two cities in the country) the sample EAs were further stratified into clusters of sub-EAs so that each cluster had approximately 30 to 50 households. The sub-EAs were numbered continuously in a more or less serpentine manner and the sample clusters were selected randomly thereafter. All mi- grant households in each sample cluster were enumerated. In other urban and rural areas the sample households in each sam- ple EA were selected as in simple random selection. With few non-responses, 1160 households were enumerated. Interviews were conducted by students of the University of Botswana and supervision was rigorously done by the author and a collaborating lecturer. Hence quality assurance was maximized, ensuring the data were free of bias and errors. In each sample household the respondent was the head of house- hold. In few cases where the household head was unavailable after several recalls, a responsible adult who was present was interviewed. Individual data were provided by the household member or (in the case of children and absentees) the house- hold head or a knowledgeable person in the household.Quality assurance was maximized to minimize bias and errors. SPSS was used in all analyses. Logistic regression analysis was used to determine the relationship between remittances and poverty. Reflecting on Poverty Measurement Though extreme and chronic poverty have similar connota-  E. K. CAMPBELL ET AL. 132 tions, the first may be measured from cross-sectional data while chronic poverty is obtained from time series data. Considering that both types may be conceptualized within the “culture of poverty”, Oscar Lewis (1971: p. 21) observed that people in these categories “have a strong feeling of marginality, of help- lessness, of dependency (and) of not belonging. They are like aliens in their own country, convinced that the existing institu- tions do not serve their interests and needs. They also experi- ence feelings of “powerlessness…inferiority (and) personal unworthiness”. It is within the context of self-gratification that Africans tended to value children to the extent that fertility in SSA was persistently high until the 1990s; and the expectation was that at least one of the offspring would attain the ability in future to assist the parents financially and materially. Migration and remittances have been established as effective mechanisms with which these aspirations are being realized. The unit of measurement (at individual or household level) is also crucial to achieving plausible and comparable measures of poverty. Much of the ensuing debates about the feminization of poverty (i.e. dominance of females among the poor) derive from the units of measurement that various researchers have used. Thus while the results of several studies of households are consistent with the theory of the feminization of poverty the intra-household approach indicates otherwise. Hence increas- ingly, questions are being raised about the reliability of the feminization of household poverty in developing countries (Buvini & Gupta, 1997; Quisumbing et al., 2001; Medeiros & Costa, 2006). On the other hand, while there is relatively little conflict over the definition of remittances, the primary unit of investigation could significantly influence the results obtained. For instance, expenditure and consumption of remittance are best studied where the primary sample unit is the recipient while knowledge about remitting attitudes and behaviour may be best obtained from the remitter as the primary unit of inves- tigation (Taylor, 1999). A poverty index is developed here to assist investigation of the remittance-poverty hypothesis. The household is defined here as a group of people who share food from a common source, sleep in the same house or compound at least 15 days in the past year and share in a common resource pool. Unlike the de jure definition of household which excludes migrants from the home household (Sanni, 2006), the culture of Bat- swana permits their inclusion in the household (Lucas, 1982; Izzard, 1985). A migrant is a person who moved from one re- gion (district) in Botswana to another to work or seek work. Transitory poverty occurs within populations with annual in- come that is above poverty level and extreme poverty refers to sustained poverty throughout the 12 months preceding the date of this study. Poverty Measurement The official (BIDPA and Government) estimates of absolute poverty in Botswana were obtained by methods that are basi- cally economic and therefore restrictive, given the poor treat- ment of social factors which contribute significantly to human development. Probably mindful of this, Mattes et al. (2003) developed the lived poverty index (henceforth referred to as LPI) which was applied to data from surveys of the living conditions of people in southern Africa in 2000. It implied cognizance of the hierarchy of needs by Maslow (1943) and Sen’s (1999) view that poverty should be measured from the standpoint of access to basic needs. Mattes et al. (2003) obtained that citizens of Bot- swana and South Africa enjoyed the best standard of living in southern Africa. Among the merits of the LPI method are that it is simple, it provides a direct measure of people’s access to basic assets and it considers the multi-dimensionality of human well- being. This method was applied to the data on which the current study is based, using twenty-one questions. The questions asked how frequently households were forced to live without basic assets (such as money, food, clean water, etc.) as well as fear of crime, domestic violence, etc. (Table 1). For example, “how often have you or your family gone without food, etc?” and “how often have you or your family feared crime, etc. in your home?” In the first question, “food” was subsequently replaced by “clean water”, “medical treatment”, etc. while in the second question “crime” was subsequently replaced by “house break- ing”, “physical assault”, etc. The joint use of attitude and behaviour approaches in the measurement of poverty was mainly influenced by expected affirmative responses to questions about people’s fears, given the existence of that which they fear. Experiences have shown that to a large extent people’s attitudes tend to be realized. Throughout the developing world, exposure to shortage of cash, water, electricity, etc. is a continuous factor, given the transi- tory nature of its occurrence. On the contrary, exposure to crime, physical abuse, etc. is subject to factors that may be less difficult to control; and this therefore reduces the actual ex- perience. The control of crime, etc. is assisted by government interventions which include continuous maintenance of peace- keeping forces such as the police and military and support of non-governmental organizations (NGO). The second reason for using the actual experience/fear approach was premised on the attitude-behaviour relationship. Notwithstanding the on-going debate about this relationship, several studies have demon- strated that to a large extent it is significant (Ajzen & Fishbein, 1977; Bankole, 1995; Holland et al., 2002). A study by Kim & Hunter (1993) points toward strong and significant relationship between attitude and behaviour while Elliot et al. (2007) re- vealed intention as the sole predictor of observed speeding behaviour. The LPI ranges from 0 to 4 (0 = zero poverty and 4 = ex- treme poverty). The means of the poverty ratios for food, etc. were computed from grouped poverty levels (0-1, 1-2, 2-3, 3-4) as m = Σfx/n. For example, the index for food was computed as Σ (720(0.5), 220(1.5), 182(2.5), 13(3.5))/1135. Table 1 shows the computed LPI of the basic assets and fear or experience of negative events. With the exception of fear of crime, much of the hindrance to attaining satisfactory living standard is appar- ently influenced by access to basic assets. Medical treatment and clean water are the only two assets that have LPI less than 1. Most of the credit for good access to medical treatment goes to the national government for its vigorous implementation of the health policy that was designed to improve the state of wellness of the population (Botswana, 1991). Electricity and cash income seem to be the most troublesome obstacles to liv- ing above poverty. Crime has increased in Botswana since 1990; and while this is largely an effect of development, it is fre- quently associated with irregular immigration. Where basic assets only are considered, the LPI is 1.13 (i.e. Σ(1.05, 0.86, 0.80, 1.59, 1.04, 1.46)/6. This is lower than Mattes et al.’s (2003) estimate (1.98) for Botswana in 2000 (the lowest in  E. K. CAMPBELL ET AL. 133 southern Africa then). When fear (related to crime, violence, etc.) was included among the units of analysis, the overall LPI dropped to 0.84, implying a good feeling of security among the study population. A better understanding of poverty levels in Botswana was obtained from an examination of the dummy variables that were created from six basic assets of our sample population (i.e. cash, food, water, medicine, electricity and fuel) for use as re- sponse variables in the logistic regression analysis. Each vari- able represents poverty where people lived without these basic assets most of the time and always. From these variables a composite variable (POVERTY) was computed to represent the population that was not poor (0) and those that were at a level of poverty (1…..6). The six are cases where households lived without one or more of the six basic assets. Poverty was subse- quently divided into 1 = Transitory Poverty and 2-6 = Extreme Poverty. This grouping was influenced by the need to maximize the valid sample size in each category when using logistic re- gression method. The choice of predictors to include in the logistic regression models was influenced by the need to produce models with the best fit (Pregibon, 1981; Hosmer & Lemeshow, 2000). The intention was to produce the best model in each case. Thus only variables which assisted the goodness of fit were finally entered. In each model the economic predictors are: migrant remits to household (yes = 1; no = 0), amount of cash remitted by mi- grant (less than P1,000 = 1; P1,000 or more = 0), frequency of migrant remittance (monthly = 1; every 3 months = 2; six to twelve months = 0), household remits to migrant (yes = 1; no = 0), household borrowed money in past 12 months (yes = 1; no = 0), and annual income of household head (less than P30,000 = 1; P30,000 or more = 0). Income includes total earnings from wages, formal and informal business, farm and pension. The demographic variables are: age of respondent (defined as <45 years = 1; 45 + years = 0), sex (male = 1; female = 0), educa- tion (none and primary = 1; secondary and tertiary = 0) and marital status (married = 1; otherwise [includes separated, di- vorced and cohabiting] = 0). The socio-cultural variables are: frequency of migrant’s home visits (monthly = 1; once in three months = 2; once in six months = 3; once a year = 0) and household member visit migrant (yes = 1; no = 0) and the geo- graphic variable is the region of household (rural = 1; urban = 0). In each analysis, the last category is the reference category. Results Table 2 indicates that the majority (63%) of households was never forced to live without sufficient food during the twelve months preceding August 2004. Seven percent always lived without sufficient food throughout this period. Much higher proportion of households (77% and 79%, respectively) had never been without clean water and medicine/medical treatment. Electricity ranked lowest among the basic assets that the popula- tion had access to. However, given the financial cost versus utility function of this power source to rural populations’ pref- erences for cheaper alternative sources of fuel (such as candle, firewood, paraffin and gas), the satisfaction derived from using non-electrical appliances probably puts the wellbeing of house- holds higher than the figures suggest. This position tends to receive support from the observation that only 7% of households always lacked sufficient cooking fuel during the reference pe- riod. Cash income ranked lowest among the basic factors that households never lacked. The composite variable (POVERTY) indicates that 48% of the households were not poor while 27% were transitorily poor and 25% were extremely poor. There seemed to be significant gender difference in the exposure to poverty (X2 = 10.84, p < .01). Table 3 shows a dominance of male households (i.e. male-headed households) among those which were not poor. Substantially more female than male households were transito- rily poor; but contrary to general opinion that extreme poverty affects significantly more female than male households in Botswana, the results suggest otherwise. The difference be- tween extremely poor male-headed households and women- headed households is apparently not significant. Table 1. Lived poverty index (LPI). Unit of Index LPI N Food 1.05 1135 Clean water 0.86 1152 Medicine 0.80 1131 Electricity 1.59 984 Fuel 1.04 1138 Money 1.46 1136 Crime 1.30 1143 House breaking 0.84 1146 Physically assaulted 0.66 1144 Domestic violence 0.60 1139 Communal violence 0.61 1137 Fear of being raped 0.53 1143 Fear of being murdered0.53 1127 Witchcraft 0.94 985 Livestock stolen 0.71 1127 Land dispute 0.60 1137 Serious illness 0.91 1147 Young child die 0.67 1142 Young adult die 0.68 1144 Drought 0.72 1136 Flood 0.55 1141 Total 0.84 1125 Table 2. Percentage of household members’ experience of having gone without food, etc. Unit of basic necessity Never Just Once or Twice/ Several Times Many times/ Always TotalN Enough food to eat 63.430.0 6.6 100.01136 Enough clean water 76.817.8 5.4 100.01142 Medi- cine/medical treatment 79.117.1 3.8 100.01132 Electricity in the home 55.113.8 31.1 100.0984 Enough cook- ing fuel 65.127.6 7.3 100.01138 Cash income45.536.8 17.7 100.01137 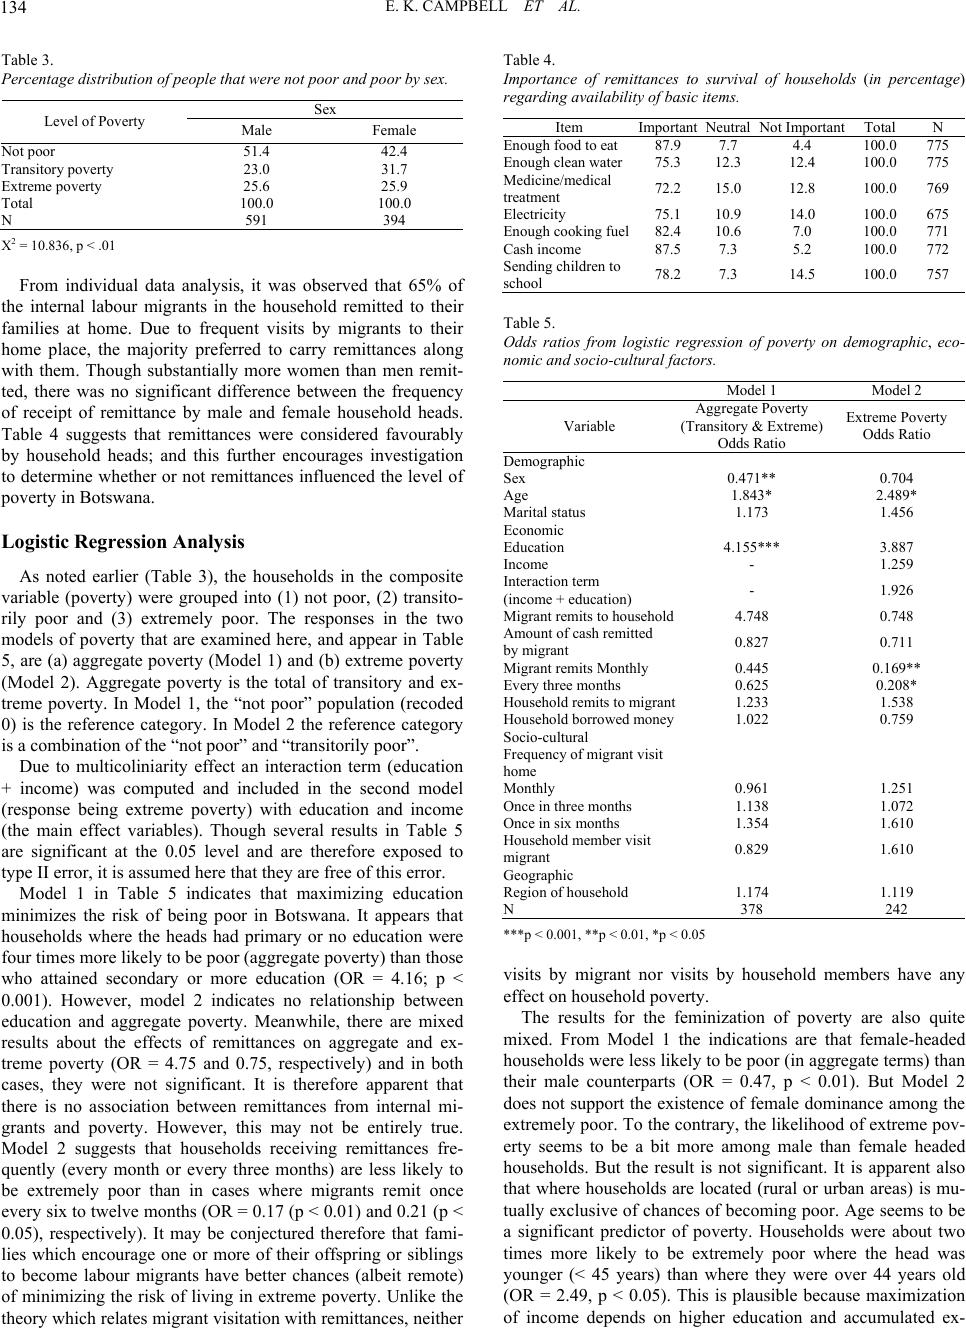 E. K. CAMPBELL ET AL. 134 Table 3. Percentage distribution of peopl e t h at were not poor and poor by sex. Sex Level of Poverty Male Female Not poor 51.4 42.4 Transitory poverty 23.0 31.7 Extreme poverty 25.6 25.9 Total 100.0 100.0 N 591 394 X2 = 10.836, p < .01 From individual data analysis, it was observed that 65% of the internal labour migrants in the household remitted to their families at home. Due to frequent visits by migrants to their home place, the majority preferred to carry remittances along with them. Though substantially more women than men remit- ted, there was no significant difference between the frequency of receipt of remittance by male and female household heads. Table 4 suggests that remittances were considered favourably by household heads; and this further encourages investigation to determine whether or not remittances influenced the level of poverty in Botswana. Logistic Regression Analysis As noted earlier (Table 3), the households in the composite variable (poverty) were grouped into (1) not poor, (2) transito- rily poor and (3) extremely poor. The responses in the two models of poverty that are examined here, and appear in Table 5, are (a) aggregate poverty (Model 1) and (b) extreme poverty (Model 2). Aggregate poverty is the total of transitory and ex- treme poverty. In Model 1, the “not poor” population (recoded 0) is the reference category. In Model 2 the reference category is a combination of the “not poor” and “transitorily poor”. Due to multicoliniarity effect an interaction term (education + income) was computed and included in the second model (response being extreme poverty) with education and income (the main effect variables). Though several results in Table 5 are significant at the 0.05 level and are therefore exposed to type II error, it is assumed here that they are free of this error. Model 1 in Table 5 indicates that maximizing education minimizes the risk of being poor in Botswana. It appears that households where the heads had primary or no education were four times more likely to be poor (aggregate poverty) than those who attained secondary or more education (OR = 4.16; p < 0.001). However, model 2 indicates no relationship between education and aggregate poverty. Meanwhile, there are mixed results about the effects of remittances on aggregate and ex- treme poverty (OR = 4.75 and 0.75, respectively) and in both cases, they were not significant. It is therefore apparent that there is no association between remittances from internal mi- grants and poverty. However, this may not be entirely true. Model 2 suggests that households receiving remittances fre- quently (every month or every three months) are less likely to be extremely poor than in cases where migrants remit once every six to twelve months (OR = 0.17 (p < 0.01) and 0.21 (p < 0.05), respectively). It may be conjectured therefore that fami- lies which encourage one or more of their offspring or siblings to become labour migrants have better chances (albeit remote) of minimizing the risk of living in extreme poverty. Unlike the theory which relates migrant visitation with remittances, neither Table 4. Importance of remittances to survival of households (in percentage) regarding availability of basic items. Item ImportantNeutral Not Important Total N Enough food to eat 87.9 7.7 4.4 100.0 775 Enough clean water75.3 12.3 12.4 100.0 775 Medicine/medical treatment 72.2 15.0 12.8 100.0 769 Electricity 75.1 10.9 14.0 100.0 675 Enough cooking fuel82.4 10.6 7.0 100.0 771 Cash income 87.5 7.3 5.2 100.0 772 Sending children to school 78.2 7.3 14.5 100.0 757 Table 5. Odds ratios from logistic regression of poverty on demographic, eco- nomic and socio-cultural factors. Model 1 Model 2 Variable Aggregate Poverty (Transitory & Extreme) Odds Ratio Extreme Poverty Odds Ratio Demographic Sex 0.471** 0.704 Age 1.843* 2.489* Marital status 1.173 1.456 Economic Education 4.155*** 3.887 Income - 1.259 Interaction term (income + education) - 1.926 Migrant remits to household4.748 0.748 Amount of cash remitted by migrant 0.827 0.711 Migrant remits Monthly 0.445 0.169** Every three months 0.625 0.208* Household remits to migrant1.233 1.538 Household borrowed money1.022 0.759 Socio-cultural Frequency of migrant visit home Monthly 0.961 1.251 Once in three months 1.138 1.072 Once in six months 1.354 1.610 Household member visit migrant 0.829 1.610 Geographic Region of household 1.174 1.119 N 378 242 ***p < 0.001, **p < 0.01, *p < 0.05 visits by migrant nor visits by household members have any effect on household poverty. The results for the feminization of poverty are also quite mixed. From Model 1 the indications are that female-headed households were less likely to be poor (in aggregate terms) than their male counterparts (OR = 0.47, p < 0.01). But Model 2 does not support the existence of female dominance among the extremely poor. To the contrary, the likelihood of extreme pov- erty seems to be a bit more among male than female headed households. But the result is not significant. It is apparent also that where households are located (rural or urban areas) is mu- tually exclusive of chances of becoming poor. Age seems to be a significant predictor of poverty. Households were about two times more likely to be extremely poor where the head was younger (< 45 years) than where they were over 44 years old (OR = 2.49, p < 0.05). This is plausible because maximization of income depends on higher education and accumulated ex- 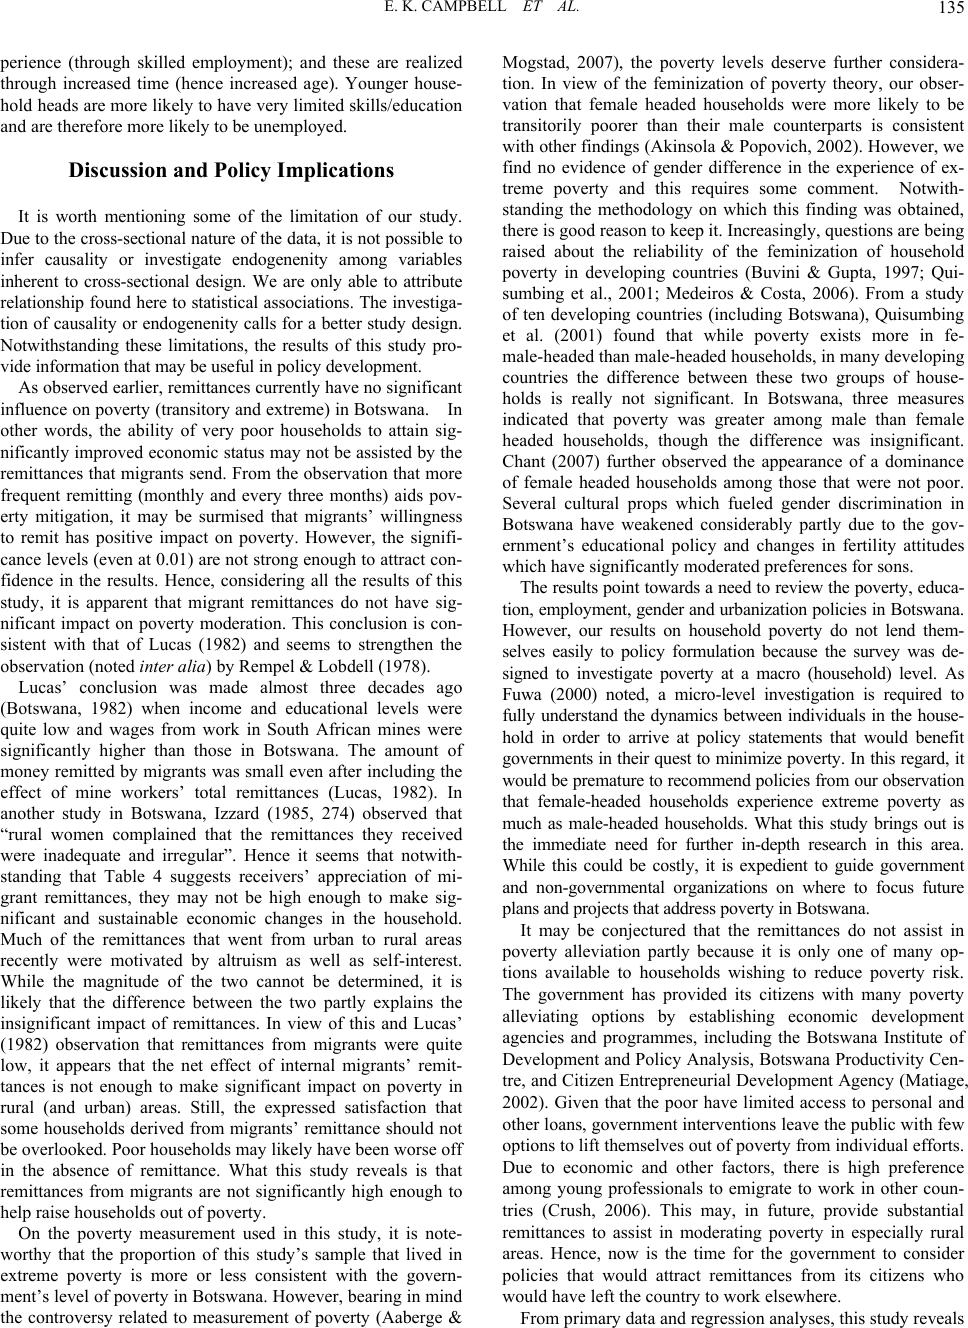 E. K. CAMPBELL ET AL. 135 perience (through skilled employment); and these are realized through increased time (hence increased age). Younger house- hold heads are more likely to have very limited skills/education and are therefore more likely to be unemployed. Discussion and Policy Implications It is worth mentioning some of the limitation of our study. Due to the cross-sectional nature of the data, it is not possible to infer causality or investigate endogenenity among variables inherent to cross-sectional design. We are only able to attribute relationship found here to statistical associations. The investiga- tion of causality or endogenenity calls for a better study design. Notwithstanding these limitations, the results of this study pro- vide information that may be useful in policy development. As observed earlier, remittances currently have no significant influence on poverty (transitory and extreme) in Botswana. In other words, the ability of very poor households to attain sig- nificantly improved economic status may not be assisted by the remittances that migrants send. From the observation that more frequent remitting (monthly and every three months) aids pov- erty mitigation, it may be surmised that migrants’ willingness to remit has positive impact on poverty. However, the signifi- cance levels (even at 0.01) are not strong enough to attract con- fidence in the results. Hence, considering all the results of this study, it is apparent that migrant remittances do not have sig- nificant impact on poverty moderation. This conclusion is con- sistent with that of Lucas (1982) and seems to strengthen the observation (noted inter alia) by Rempel & Lobdell (1978). Lucas’ conclusion was made almost three decades ago (Botswana, 1982) when income and educational levels were quite low and wages from work in South African mines were significantly higher than those in Botswana. The amount of money remitted by migrants was small even after including the effect of mine workers’ total remittances (Lucas, 1982). In another study in Botswana, Izzard (1985, 274) observed that “rural women complained that the remittances they received were inadequate and irregular”. Hence it seems that notwith- standing that Table 4 suggests receivers’ appreciation of mi- grant remittances, they may not be high enough to make sig- nificant and sustainable economic changes in the household. Much of the remittances that went from urban to rural areas recently were motivated by altruism as well as self-interest. While the magnitude of the two cannot be determined, it is likely that the difference between the two partly explains the insignificant impact of remittances. In view of this and Lucas’ (1982) observation that remittances from migrants were quite low, it appears that the net effect of internal migrants’ remit- tances is not enough to make significant impact on poverty in rural (and urban) areas. Still, the expressed satisfaction that some households derived from migrants’ remittance should not be overlooked. Poor households may likely have been worse off in the absence of remittance. What this study reveals is that remittances from migrants are not significantly high enough to help raise households out of poverty. On the poverty measurement used in this study, it is note- worthy that the proportion of this study’s sample that lived in extreme poverty is more or less consistent with the govern- ment’s level of poverty in Botswana. However, bearing in mind the controversy related to measurement of poverty (Aaberge & Mogstad, 2007), the poverty levels deserve further considera- tion. In view of the feminization of poverty theory, our obser- vation that female headed households were more likely to be transitorily poorer than their male counterparts is consistent with other findings (Akinsola & Popovich, 2002). However, we find no evidence of gender difference in the experience of ex- treme poverty and this requires some comment. Notwith- standing the methodology on which this finding was obtained, there is good reason to keep it. Increasingly, questions are being raised about the reliability of the feminization of household poverty in developing countries (Buvini & Gupta, 1997; Qui- sumbing et al., 2001; Medeiros & Costa, 2006). From a study of ten developing countries (including Botswana), Quisumbing et al. (2001) found that while poverty exists more in fe- male-headed than male-headed households, in many developing countries the difference between these two groups of house- holds is really not significant. In Botswana, three measures indicated that poverty was greater among male than female headed households, though the difference was insignificant. Chant (2007) further observed the appearance of a dominance of female headed households among those that were not poor. Several cultural props which fueled gender discrimination in Botswana have weakened considerably partly due to the gov- ernment’s educational policy and changes in fertility attitudes which have significantly moderated preferences for sons. The results point towards a need to review the poverty, educa- tion, employment, gender and urbanization policies in Botswana. However, our results on household poverty do not lend them- selves easily to policy formulation because the survey was de- signed to investigate poverty at a macro (household) level. As Fuwa (2000) noted, a micro-level investigation is required to fully understand the dynamics between individuals in the house- hold in order to arrive at policy statements that would benefit governments in their quest to minimize poverty. In this regard, it would be premature to recommend policies from our observation that female-headed households experience extreme poverty as much as male-headed households. What this study brings out is the immediate need for further in-depth research in this area. While this could be costly, it is expedient to guide government and non-governmental organizations on where to focus future plans and projects that address poverty in Botswana. It may be conjectured that the remittances do not assist in poverty alleviation partly because it is only one of many op- tions available to households wishing to reduce poverty risk. The government has provided its citizens with many poverty alleviating options by establishing economic development agencies and programmes, including the Botswana Institute of Development and Policy Analysis, Botswana Productivity Cen- tre, and Citizen Entrepreneurial Development Agency (Matiage, 2002). Given that the poor have limited access to personal and other loans, government interventions leave the public with few options to lift themselves out of poverty from individual efforts. Due to economic and other factors, there is high preference among young professionals to emigrate to work in other coun- tries (Crush, 2006). This may, in future, provide substantial remittances to assist in moderating poverty in especially rural areas. Hence, now is the time for the government to consider policies that would attract remittances from its citizens who would have left the country to work elsewhere. From primary data and regression analyses, this study reveals 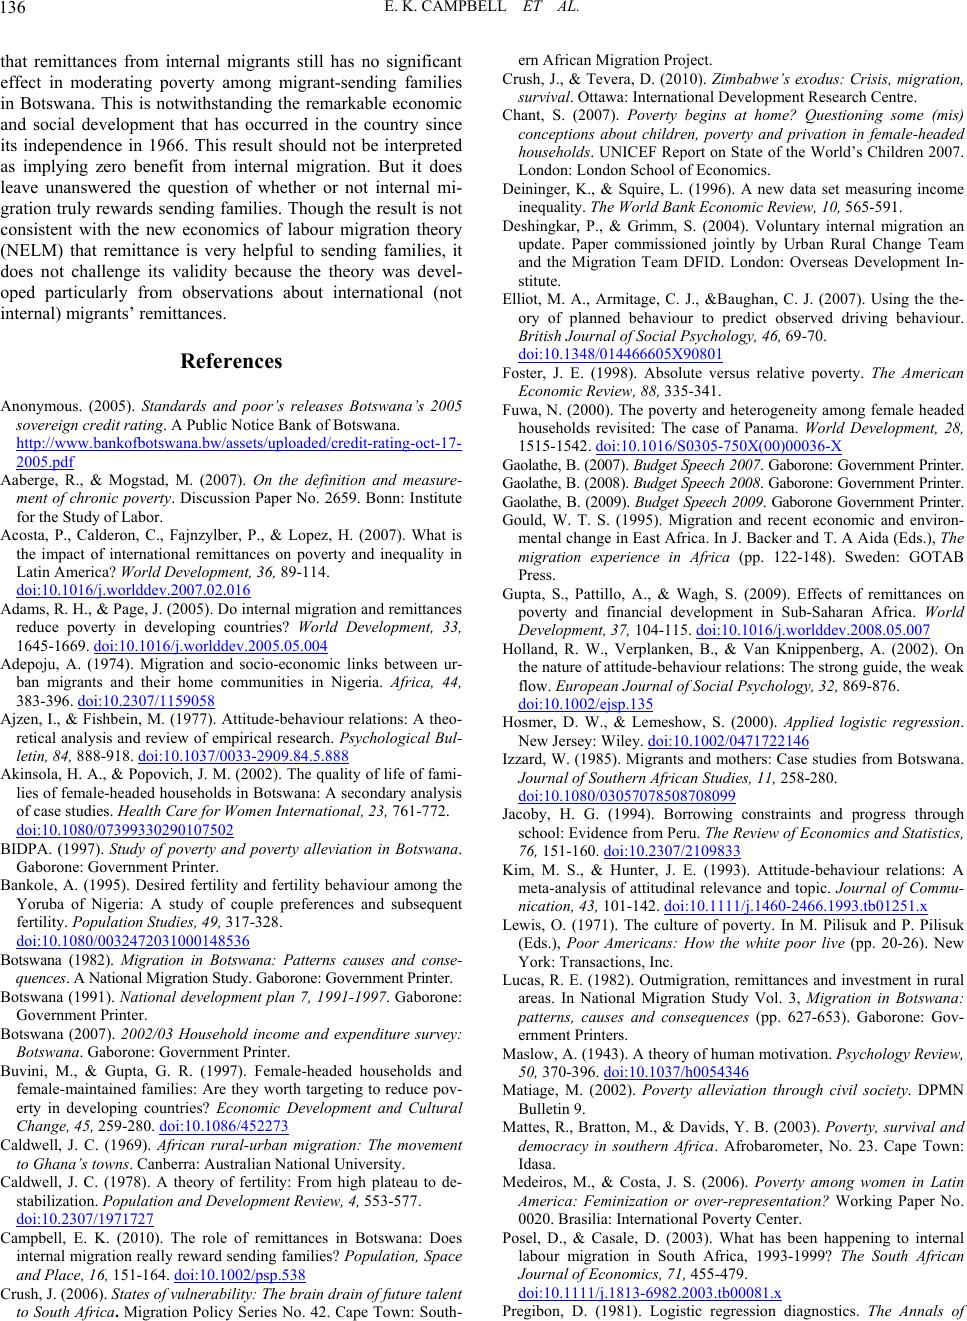 E. K. CAMPBELL ET AL. 136 that remittances from internal migrants still has no significant effect in moderating poverty among migrant-sending families in Botswana. This is notwithstanding the remarkable economic and social development that has occurred in the country since its independence in 1966. This result should not be interpreted as implying zero benefit from internal migration. But it does leave unanswered the question of whether or not internal mi- gration truly rewards sending families. Though the result is not consistent with the new economics of labour migration theory (NELM) that remittance is very helpful to sending families, it does not challenge its validity because the theory was devel- oped particularly from observations about international (not internal) migrants’ remittances. References Anonymous. (2005). Standards and poor’s releases Botswana’s 2005 sovereign credit rating. A Public Notice Bank of Botswana. http://www.bankofbotswana.bw/assets/uploaded/credit-rating-oct-17- 2005.pdf Aaberge, R., & Mogstad, M. (2007). On the definition and measure- ment of chronic poverty. Discussion Paper No. 2659. Bonn: Institute for the Study of Labor. Acosta, P., Calderon, C., Fajnzylber, P., & Lopez, H. (2007). What is the impact of international remittances on poverty and inequality in Latin America? World Development, 36, 89-114. doi:10.1016/j.worlddev.2007.02.016 Adams, R. H., & Page, J. (2005). Do internal migration and remittances reduce poverty in developing countries? World Development, 33, 1645-1669. doi:10.1016/j.worlddev.2005.05.004 Adepoju, A. (1974). Migration and socio-economic links between ur- ban migrants and their home communities in Nigeria. Africa, 44, 383-396. doi:10.2307/1159058 Ajzen, I., & Fishbein, M. (1977). Attitude-behaviour relations: A theo- retical analysis and review of empirical research. Psychological Bul- letin, 84, 888-918. doi:10.1037/0033-2909.84.5.888 Akinsola, H. A., & Popovich, J. M. (2002). The quality of life of fami- lies of female-headed households in Botswana: A secondary analysis of case studies. Health Care for Women International, 23, 761-772. doi:10.1080/07399330290107502 BIDPA. (1997). Study of poverty and poverty alleviation in Botswana. Gaborone: Government Printer. Bankole, A. (1995). Desired fertility and fertility behaviour among the Yoruba of Nigeria: A study of couple preferences and subsequent fertility. Population Studies, 49, 317-328. doi:10.1080/0032472031000148536 Botswana (1982). Migration in Botswana: Patterns causes and conse- quences. A National Migration Study. Gaborone: Government Printer. Botswana (1991). National development plan 7, 1991-1997. Gaborone: Government Printer. Botswana (2007). 2002/03 Household income and expenditure survey: Botswana. Gaborone: Government Printer. Buvini, M., & Gupta, G. R. (1997). Female-headed households and female-maintained families: Are they worth targeting to reduce pov- erty in developing countries? Economic Development and Cultural Change, 45, 259-280. doi:10.1086/452273 Caldwell, J. C. (1969). African rural-urban migration: The movement to Ghana’s towns. Canberra: Australian National University. Caldwell, J. C. (1978). A theory of fertility: From high plateau to de- stabilization. Population and Development Re v iew, 4 , 553-577. doi:10.2307/1971727 Campbell, E. K. (2010). The role of remittances in Botswana: Does internal migration really reward sending families? Population, Space and Place, 16, 151-164. doi:10.1002/psp.538 Crush, J. (2006). States of vulnerability: The brain drain of future talent to South Africa. Migration Policy Series No. 42. Cape Town: South- ern African Migration Project. Crush, J., & Tevera, D. (2010). Zimbabwe’s exodus: Crisis, migration, survival. Ottawa: International Development Research Centre. Chant, S. (2007). Poverty begins at home? Questioning some (mis) conceptions about children, poverty and privation in female-headed households. UNICEF Report on State of the World’s Children 2007. London: London School of Economics. Deininger, K., & Squire, L. (1996). A new data set measuring income inequality. The World Bank Economic Review, 10, 565-591. Deshingkar, P., & Grimm, S. (2004). Voluntary internal migration an update. Paper commissioned jointly by Urban Rural Change Team and the Migration Team DFID. London: Overseas Development In- stitute. Elliot, M. A., Armitage, C. J., &Baughan, C. J. (2007). Using the the- ory of planned behaviour to predict observed driving behaviour. British Journal of Social Psyc h o lo g y, 46, 69-70. doi:10.1348/014466605X90801 Foster, J. E. (1998). Absolute versus relative poverty. The American Economic Review, 88, 335-341. Fuwa, N. (2000). The poverty and heterogeneity among female headed households revisited: The case of Panama. World Development, 28, 1515-1542. doi:10.1016/S0305-750X(00)00036-X Gaolathe, B. (2007). Budget Speech 2 007. Gaborone: Government Printer. Gaolathe, B. (2008). Budget Speech 2 008. Gaborone: Government Printer. Gaolathe, B. (2009). Budget Speech 2009. Gaborone Government Printer. Gould, W. T. S. (1995). Migration and recent economic and environ- mental change in East Africa. In J. Backer and T. A Aida (Eds.), The migration experience in Africa (pp. 122-148). Sweden: GOTAB Press. Gupta, S., Pattillo, A., & Wagh, S. (2009). Effects of remittances on poverty and financial development in Sub-Saharan Africa. World Development, 37, 104-115. doi:10.1016/j.worlddev.2008.05.007 Holland, R. W., Verplanken, B., & Van Knippenberg, A. (2002). On the nature of attitude-behaviour relations: The strong guide, the weak flow. European Journal of Social Psychology, 32, 869-876. doi:10.1002/ejsp.135 Hosmer, D. W., & Lemeshow, S. (2000). Applied logistic regression. New Jersey: Wiley. doi:10.1002/0471722146 Izzard, W. (1985). Migrants and mothers: Case studies from Botswana. Journal of Southern African Studies, 11, 258-280. doi:10.1080/03057078508708099 Jacoby, H. G. (1994). Borrowing constraints and progress through school: Evidence from Peru. The Review of Economics and Statistics, 76, 151-160. doi:10.2307/2109833 Kim, M. S., & Hunter, J. E. (1993). Attitude-behaviour relations: A meta-analysis of attitudinal relevance and topic. Journal of Commu- nication, 43, 101-142. doi:10.1111/j.1460-2466.1993.tb01251.x Lewis, O. (1971). The culture of poverty. In M. Pilisuk and P. Pilisuk (Eds.), Poor Americans: How the white poor live (pp. 20-26). New York: Transactions, Inc. Lucas, R. E. (1982). Outmigration, remittances and investment in rural areas. In National Migration Study Vol. 3, Migration in Botswana: patterns, causes and consequences (pp. 627-653). Gaborone: Gov- ernment Printers. Maslow, A. (1943). A theory of human motivation. Psychology Review, 50, 370-396. doi:10.1037/h0054346 Matiage, M. (2002). Poverty alleviation through civil society. DPMN Bulletin 9. Mattes, R., Bratton, M., & Davids, Y. B. (2003). Poverty, survival and democracy in southern Africa. Afrobarometer, No. 23. Cape Town: Idasa. Medeiros, M., & Costa, J. S. (2006). Poverty among women in Latin America: Feminization or over-representation? Working Paper No. 0020. Brasilia: International Poverty Center. Posel, D., & Casale, D. (2003). What has been happening to internal labour migration in South Africa, 1993-1999? The South African Journal of Economics, 71, 455-479. doi:10.1111/j.1813-6982.2003.tb00081.x Pregibon, D. (1981). Logistic regression diagnostics. The Annals of  E. K. CAMPBELL ET AL. 137 Statistics, 9, 705-724. doi:10.1214/aos/1176345513 Quisumbing, A. R., Haddad, L., & Pena, C. (2001). Are women over- represented among the poor? An analysis of poverty in ten develop- ing countries. Discussion Paper No. 115, Food Consumption and Nutrition Division. Washington, D.C: International Food Policy Re- search Institute. Rempel, H., & Lobdel, R. A. (1978). The role of urban-to-rural remit- tances in rural development. Journal of Development Studies, 14, 324-341. doi:10.1080/00220387808421678 Rodgers, J. R., & Rodgers, J. L. (2006). Chronic and transitory poverty in Australia 2001-2004. Economics Working Paper Series (WP 06-28). Wollongong: University of Wollongong. Sanni, L. (2006). Comparative study of female-headed households in the city of Ibadan. JENDA: A Journal of Culture and African Women Studies, 8, 1-14. Schapera, I. (1947). Migrant labour and tribal life. London: Oxford University Press. Seers, D. (1972). What are we trying to measure? Journal of Develop- ment Studies, 8, 21-36. doi:10.1080/00220387208421410 Sen, A. (1999). Development a s f r e ed o m. New York: Anchor Books. Taylor, J. E. (1999). The new economics of labour migration and the role of remittances in the migration process. International Migration, 37, 63-86. doi:10.1111/1468-2435.00066 Taylor, J. E., Mora, J., Adams, R., & Lopez-Feldman, A. (2005). Re- mittance, inequality and poverty: Evidence from Mexico. Working Paper No. 05-003, Giannini Foundation for Agricultural Economics. Oakland, California: University of California. Thaler, R.H. and Shefrin, H.M. (1981), An economic theory of self-control. The Journal of Political Economy, 89, 392-406. doi:10.1086/260971 |