

Paper Menu >>
Journal Menu >>
 Journal of Modern Physics, 2011, 2, 538-543 doi:10.4236/jmp.2011.26063 Published Online June 2011 (http://www.SciRP.org/journal/jmp) Copyright © 2011 SciRes. JMP Spectroscopic Investigation of Modified Single Wall Carbon Nanotube (SWCNT) S. Hussain1, P. Jha3, A. Chouksey3, R. Raman3, S. S. Islam1, T. Islam2, P. K. Choudhary3, Harsh3 1Department of Applied Sciences and Humanities, Nano Sensor Research Laboratory, Faculty of Engineering & Technology, Jamia Millia Islamia, India 2Department of Electrical Engineering, Faculty of Engineering & Technology, Jamia Millia Islamia, India 3Solid State Physics Laboratory, Delhi, India E-mail: [email protected] Received January 14, 2011; revised March 16, 2011; accepted April 1, 2011 Abstract We have investigated the effects of chemical treatment on Single Wall Carbon Nanotube (SWCNT) before and after being modified with HNO3/H2SO4 by Raman, FTIR and UV-Vis-NIR spectroscopy. The results show successful carboxylation of the CNT sidewalls as observed from FTIR and UV-Vis-NIR spectroscopy. This successful functionalization is achieved in 6-8 hrs of refluxing. We also report changes in the first and second order Raman spectra of SWNTs functionalized with oxygenated groups. During the experiment, we observe some important Raman features: Radial breathing mode (RBM), Tangential mode (G-band), and Disordered mode (D-band); which are affected due to the chemical oxidation of carbon nanotubes. We found that the ratio of D- to the G-band intensity (Id/Ig), increase after functionalization and the RBM mode in acid treated SWCNTs is almost disappeared. Keywords: Single Wall Carbon Nanotubes, Functionalization, Raman Spectroscopy, Ftir and UV-Vis-NIR Spectroscopy 1. Introduction Carbon nanotubes (CNTs) have attracted much attention of researchers worldwide because of their pseudo 1D structure and exceptional mechanical, electrical, and thermal properties [1]. Carbon nanotubes become very useful for many applications such as nanoelectonic de- vices, chemical sensors, gas sensors, solar cells and so forth. CNT based sensors, an emerging application area of the nanotubes and have caught the attention of a large number of researchers. Due to the enormously high spe- cific surface area, SWNTs can absorb large amount of gases, which makes them a potential candidate for chemical sensors with very high sensitivity. However, for any practical purpose, apart from sensitivity, selectiv- ity must also be introduced on to the CNT surface; for which the CNT sidewalls/ end caps need to be function- alized with different functional moieties. Functionaliza- tion process of CNT decreases van der Waals’ forces, leading to de-bundling between the CNT, and aiding binding to other materials [2]. Since carbon nanotubes remain insoluble in common solvents due to the high cohesive energy of more than 0.5 eV/nm arising from tube – tube van der Waals’ attraction, therefore function- alization is also useful in reducing the magnitude of this energy and rendering them soluble [3]. The first step to functionalize the relatively inert CNT surface is to oxi- dize the CNTs. The various oxidation methods have used for this purpose [4-8]. Liquid phase oxidation is a very simple method to make nanotubes more easily dispersi- ble or soluble in liquids; it is necessary to physically or chemically attach functional groups to their sidewalls without changing significant properties and also opens the closed ends of CNTs [9]. The chemical modification and oxidation of CNTs has been well represented in lit- erature [10,11]. During acid oxidation, the carbon-carbon bonded network of the graphitic layers is broken allow- ing the introduction of oxygen atoms in the form of car- boxyl, which has been extensively exploited for further 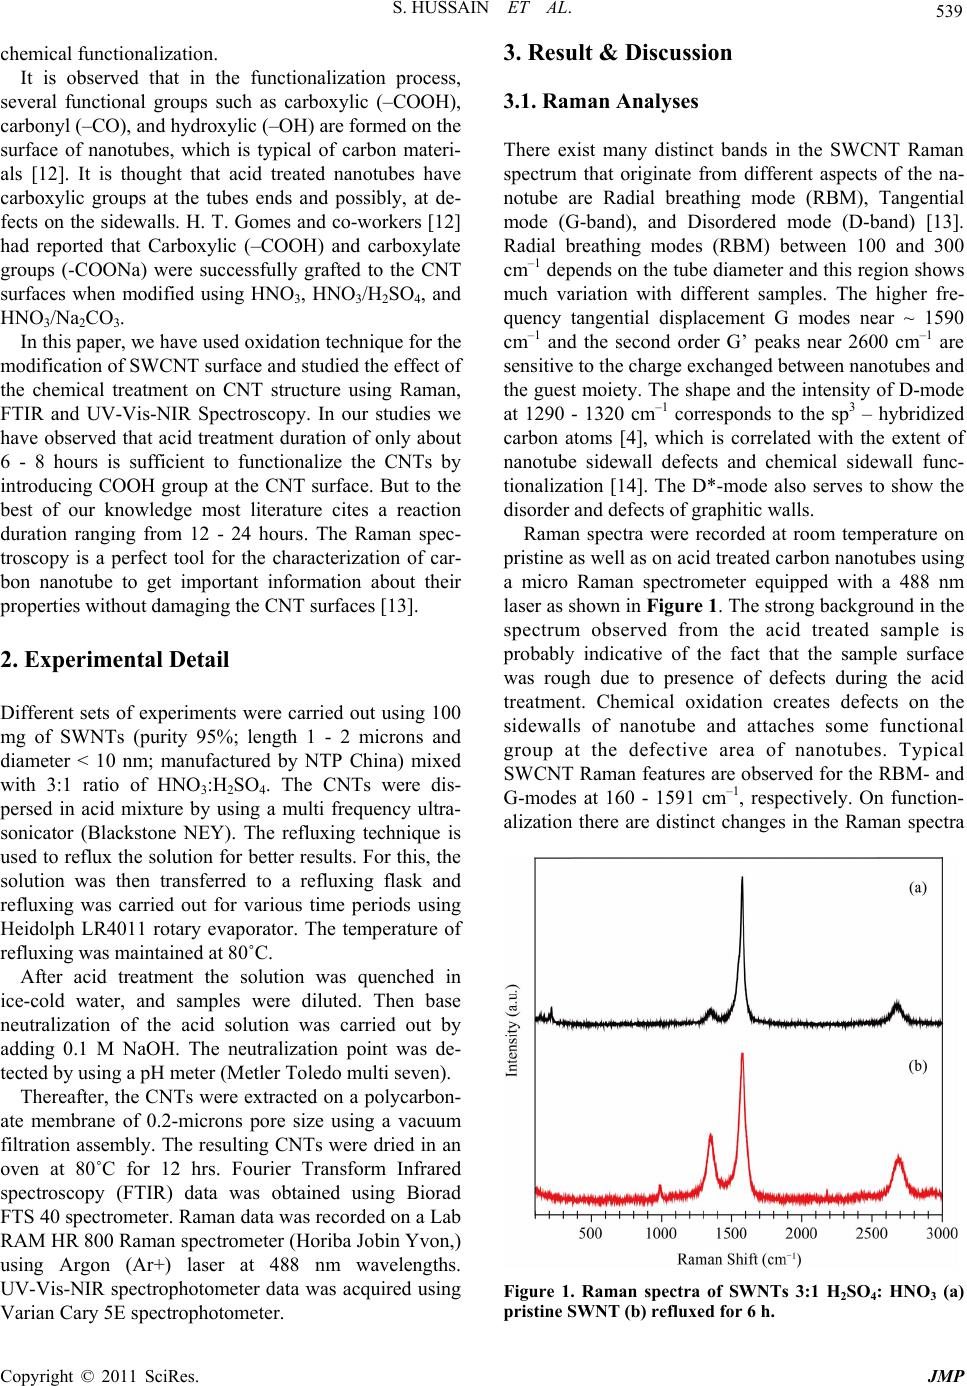 S. HUSSAIN ET AL. 539 chemical functionalization. It is observed that in the functionalization process, several functional groups such as carboxylic (–COOH), carbonyl (–CO), and hydroxylic (–OH) are formed on the surface of nanotubes, which is typical of carbon materi- als [12]. It is thought that acid treated nanotubes have carboxylic groups at the tubes ends and possibly, at de- fects on the sidewalls. H. T. Gomes and co-workers [12] had reported that Carboxylic (–COOH) and carboxylate groups (-COONa) were successfully grafted to the CNT surfaces when modified using HNO3, HNO3/H2SO4, and HNO3/Na2CO3. In this paper, we have used oxidation technique for the modification of SWCNT surface and studied the effect of the chemical treatment on CNT structure using Raman, FTIR and UV-Vis-NIR Spectroscopy. In our studies we have observed that acid treatment duration of only about 6 - 8 hours is sufficient to functionalize the CNTs by introducing COOH group at the CNT surface. But to the best of our knowledge most literature cites a reaction duration ranging from 12 - 24 hours. The Raman spec- troscopy is a perfect tool for the characterization of car- bon nanotube to get important information about their properties without damaging the CNT surfaces [13]. 2. Experimental Detail Different sets of experiments were carried out using 100 mg of SWNTs (purity 95%; length 1 - 2 microns and diameter < 10 nm; manufactured by NTP China) mixed with 3:1 ratio of HNO3:H2SO4. The CNTs were dis- persed in acid mixture by using a multi frequency ultra- sonicator (Blackstone NEY). The refluxing technique is used to reflux the solution for better results. For this, the solution was then transferred to a refluxing flask and refluxing was carried out for various time periods using Heidolph LR4011 rotary evaporator. The temperature of refluxing was maintained at 80˚C. After acid treatment the solution was quenched in ice-cold water, and samples were diluted. Then base neutralization of the acid solution was carried out by adding 0.1 M NaOH. The neutralization point was de- tected by using a pH meter (Metler Toledo multi seven). Thereafter, the CNTs were extracted on a polycarbon- ate membrane of 0.2-microns pore size using a vacuum filtration assembly. The resulting CNTs were dried in an oven at 80˚C for 12 hrs. Fourier Transform Infrared spectroscopy (FTIR) data was obtained using Biorad FTS 40 spectrometer. Raman data was recorded on a Lab RAM HR 800 Raman spectrometer (Horiba Jobin Yvon,) using Argon (Ar+) laser at 488 nm wavelengths. UV-Vis-NIR spectrophotometer data was acquired using Varian Cary 5E spectrophotometer. 3. Result & Discussion 3.1. Raman Analyses There exist many distinct bands in the SWCNT Raman spectrum that originate from different aspects of the na- notube are Radial breathing mode (RBM), Tangential mode (G-band), and Disordered mode (D-band) [13]. Radial breathing modes (RBM) between 100 and 300 cm–1 depends on the tube diameter and this region shows much variation with different samples. The higher fre- quency tangential displacement G modes near ~ 1590 cm–1 and the second order G’ peaks near 2600 cm–1 are sensitive to the charge exchanged between nanotubes and the guest moiety. The shape and the intensity of D-mode at 1290 - 1320 cm–1 corresponds to the sp3 – hybridized carbon atoms [4], which is correlated with the extent of nanotube sidewall defects and chemical sidewall func- tionalization [14]. The D*-mode also serves to show the disorder and defects of graphitic walls. Raman spectra were recorded at room temperature on pristine as well as on acid treated carbon nanotubes using a micro Raman spectrometer equipped with a 488 nm laser as shown in Figure 1. The strong background in the spectrum observed from the acid treated sample is probably indicative of the fact that the sample surface was rough due to presence of defects during the acid treatment. Chemical oxidation creates defects on the sidewalls of nanotube and attaches some functional group at the defective area of nanotubes. Typical SWCNT Raman features are observed for the RBM- and G-modes at 160 - 1591 cm–1, respectively. On function- alization there are distinct changes in the Raman spectra Figure 1. Raman spectra of SWNTs 3:1 H2SO4: HNO3 (a) pristine SWNT (b) refluxed for 6 h. Copyright © 2011 SciRes. JMP 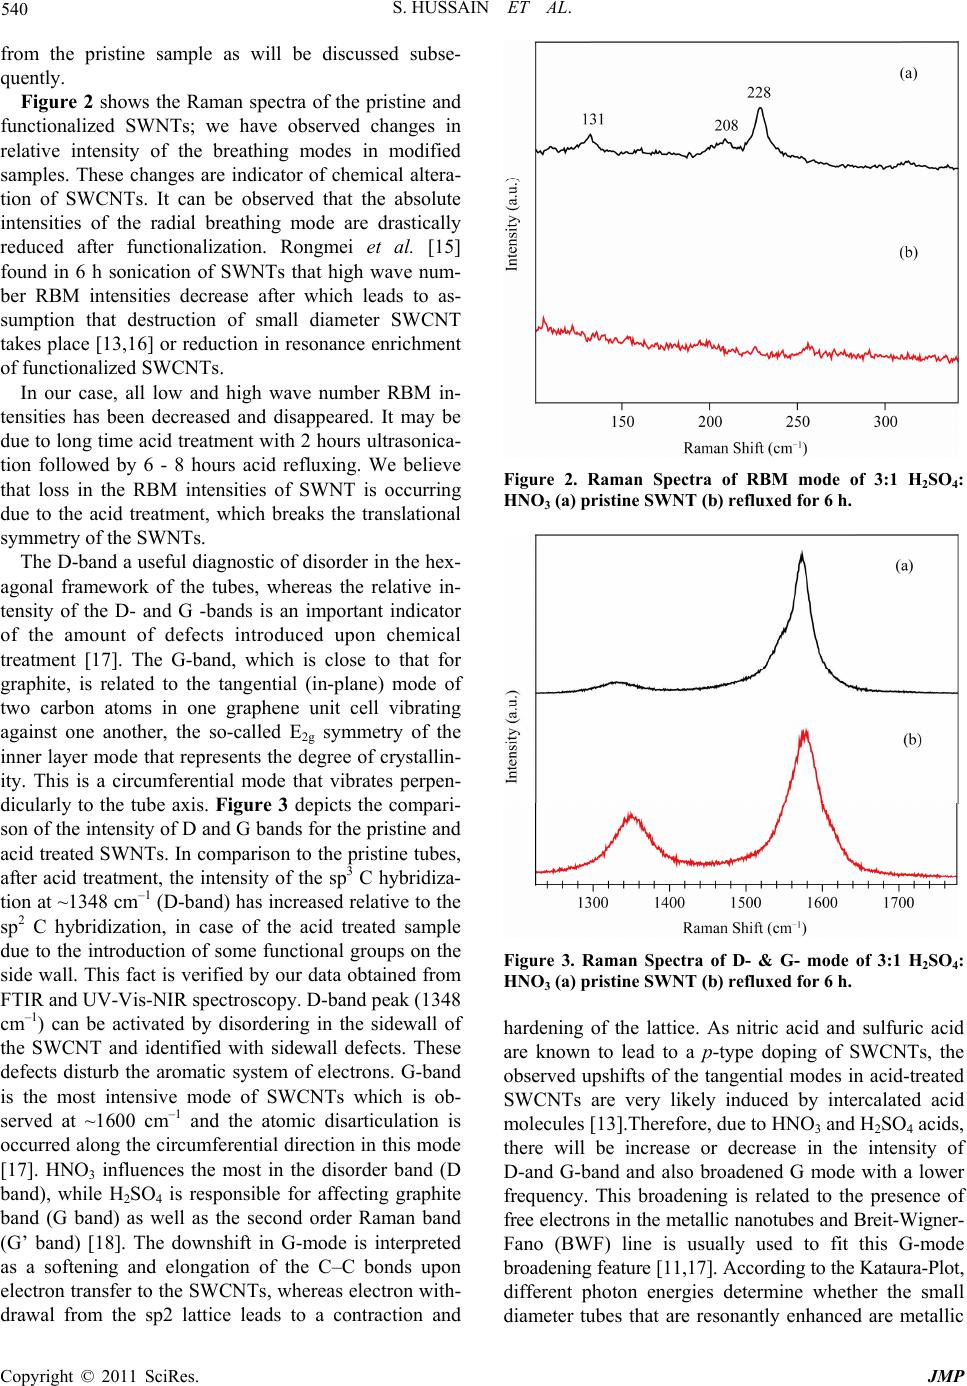 540 S. HUSSAIN ET AL. from the pristine sample as will be discussed subse- quently. Figure 2 shows the Raman spectra of the pristine and functionalized SWNTs; we have observed changes in relative intensity of the breathing modes in modified samples. These changes are indicator of chemical altera- tion of SWCNTs. It can be observed that the absolute intensities of the radial breathing mode are drastically reduced after functionalization. Rongmei et al. [15] found in 6 h sonication of SWNTs that high wave num- ber RBM intensities decrease after which leads to as- sumption that destruction of small diameter SWCNT takes place [13,16] or reduction in resonance enrichment of functionalized SWCNTs. In our case, all low and high wave number RBM in- tensities has been decreased and disappeared. It may be due to long time acid treatment with 2 hours ultrasonica- tion followed by 6 - 8 hours acid refluxing. We believe that loss in the RBM intensities of SWNT is occurring due to the acid treatment, which breaks the translational symmetry of the SWNTs. The D-band a useful diagnostic of disorder in the hex- agonal framework of the tubes, whereas the relative in- tensity of the D- and G -bands is an important indicator of the amount of defects introduced upon chemical treatment [17]. The G-band, which is close to that for graphite, is related to the tangential (in-plane) mode of two carbon atoms in one graphene unit cell vibrating against one another, the so-called E2g symmetry of the inner layer mode that represents the degree of crystallin- ity. This is a circumferential mode that vibrates perpen- dicularly to the tube axis. Figure 3 depicts the compari- son of the intensity of D and G bands for the pristine and acid treated SWNTs. In comparison to the pristine tubes, after acid treatment, the intensity of the sp3 C hybridiza- tion at ~1348 cm–1 (D-band) has increased relative to the sp2 C hybridization, in case of the acid treated sample due to the introduction of some functional groups on the side wall. This fact is verified by our data obtained from FTIR and UV-Vis-NIR spectroscopy. D-band peak (1348 cm–1) can be activated by disordering in the sidewall of the SWCNT and identified with sidewall defects. These defects disturb the aromatic system of electrons. G-band is the most intensive mode of SWCNTs which is ob- served at ~1600 cm–1 and the atomic disarticulation is occurred along the circumferential direction in this mode [17]. HNO3 influences the most in the disorder band (D band), while H2SO4 is responsible for affecting graphite band (G band) as well as the second order Raman band (G’ band) [18]. The downshift in G-mode is interpreted as a softening and elongation of the C–C bonds upon electron transfer to the SWCNTs, whereas electron with- drawal from the sp2 lattice leads to a contraction and Figure 2. Raman Spectra of RBM mode of 3:1 H2SO4: HNO3 (a) pristine SWNT (b) refluxed for 6 h. Figure 3. Raman Spectra of D- & G- mode of 3:1 H2SO4: HNO3 (a) pristine SWNT (b) refluxed for 6 h. hardening of the lattice. As nitric acid and sulfuric acid are known to lead to a p-type doping of SWCNTs, the observed upshifts of the tangential modes in acid-treated SWCNTs are very likely induced by intercalated acid molecules [13].Therefore, due to HNO3 and H2SO4 acids, there will be increase or decrease in the intensity of D-and G-band and also broadened G mode with a lower frequency. This broadening is related to the presence of free electrons in the metallic nanotubes and Breit-Wigner- Fano (BWF) line is usually used to fit this G-mode broadening feature [11,17]. According to the Kataura-Plot, different photon energies determine whether the small diameter tubes that are resonantly enhanced are metallic Copyright © 2011 SciRes. JMP 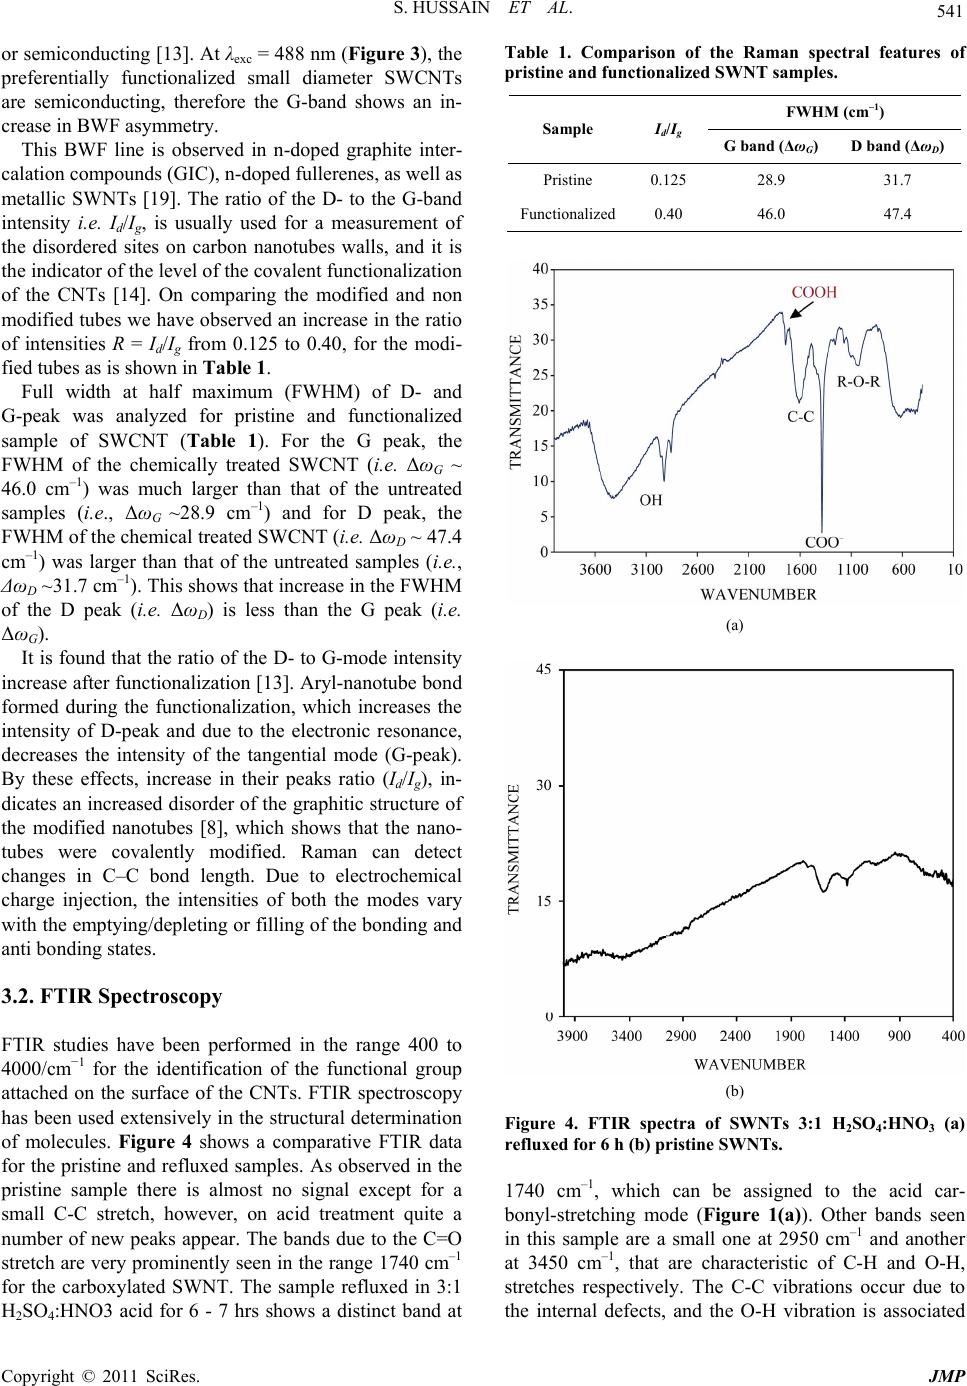 S. HUSSAIN ET AL. 541 or semiconducting [13]. At λexc = 488 nm (Figure 3), the preferentially functionalized small diameter SWCNTs are semiconducting, therefore the G-band shows an in- crease in BWF asymmetry. This BWF line is observed in n-doped graphite inter- calation compounds (GIC), n-doped fullerenes, as well as metallic SWNTs [19]. The ratio of the D- to the G-band intensity i.e. Id/Ig, is usually used for a measurement of the disordered sites on carbon nanotubes walls, and it is the indicator of the level of the covalent functionalization of the CNTs [14]. On comparing the modified and non modified tubes we have observed an increase in the ratio of intensities R = Id/Ig from 0.125 to 0.40, for the modi- fied tubes as is shown in Table 1. Full width at half maximum (FWHM) of D- and G-peak was analyzed for pristine and functionalized sample of SWCNT (Table 1). For the G peak, the FWHM of the chemically treated SWCNT (i.e. ΔωG ~ 46.0 cm–1) was much larger than that of the untreated samples (i.e., ΔωG ~28.9 cm–1) and for D peak, the FWHM of the chemical treated SWCNT (i.e. ΔωD ~ 47.4 cm–1) was larger than that of the untreated samples (i.e., ΔωD ~31.7 cm–1). This shows that increase in the FWHM of the D peak (i.e. ΔωD) is less than the G peak (i.e. ΔωG). It is found that the ratio of the D- to G-mode intensity increase after functionalization [13]. Aryl-nanotube bond formed during the functionalization, which increases the intensity of D-peak and due to the electronic resonance, decreases the intensity of the tangential mode (G-peak). By these effects, increase in their peaks ratio (Id/Ig), in- dicates an increased disorder of the graphitic structure of the modified nanotubes [8], which shows that the nano- tubes were covalently modified. Raman can detect changes in C–C bond length. Due to electrochemical charge injection, the intensities of both the modes vary with the emptying/depleting or filling of the bonding and anti bonding states. 3.2. FTIR Spectroscopy FTIR studies have been performed in the range 400 to 4000/cm−1 for the identification of the functional group attached on the surface of the CNTs. FTIR spectroscopy has been used extensively in the structural determination of molecules. Figure 4 shows a comparative FTIR data for the pristine and refluxed samples. As observed in the pristine sample there is almost no signal except for a small C-C stretch, however, on acid treatment quite a number of new peaks appear. The bands due to the C=O stretch are very prominently seen in the range 1740 cm–1 for the carboxylated SWNT. The sample refluxed in 3:1 H2SO4:HNO3 acid for 6 - 7 hrs shows a distinct band at Table 1. Comparison of the Raman spectral features of pristine and functionalized SWNT samples. FWHM (cm–1) Sample Id/Ig G band (ΔωG) D band (ΔωD) Pristine 0.125 28.9 31.7 Functionalized0.40 46.0 47.4 (a) (b) Figure 4. FTIR spectra of SWNTs 3:1 H2SO4:HNO3 (a) refluxed for 6 h (b) pristine SWNTs. 1740 cm–1, which can be assigned to the acid car- bonyl-stretching mode (Figure 1(a)). Other bands seen in this sample are a small one at 2950 cm–1 and another at 3450 cm–1, that are characteristic of C-H and O-H, stretches respectively. The C-C vibrations occur due to the internal defects, and the O-H vibration is associated Copyright © 2011 SciRes. JMP 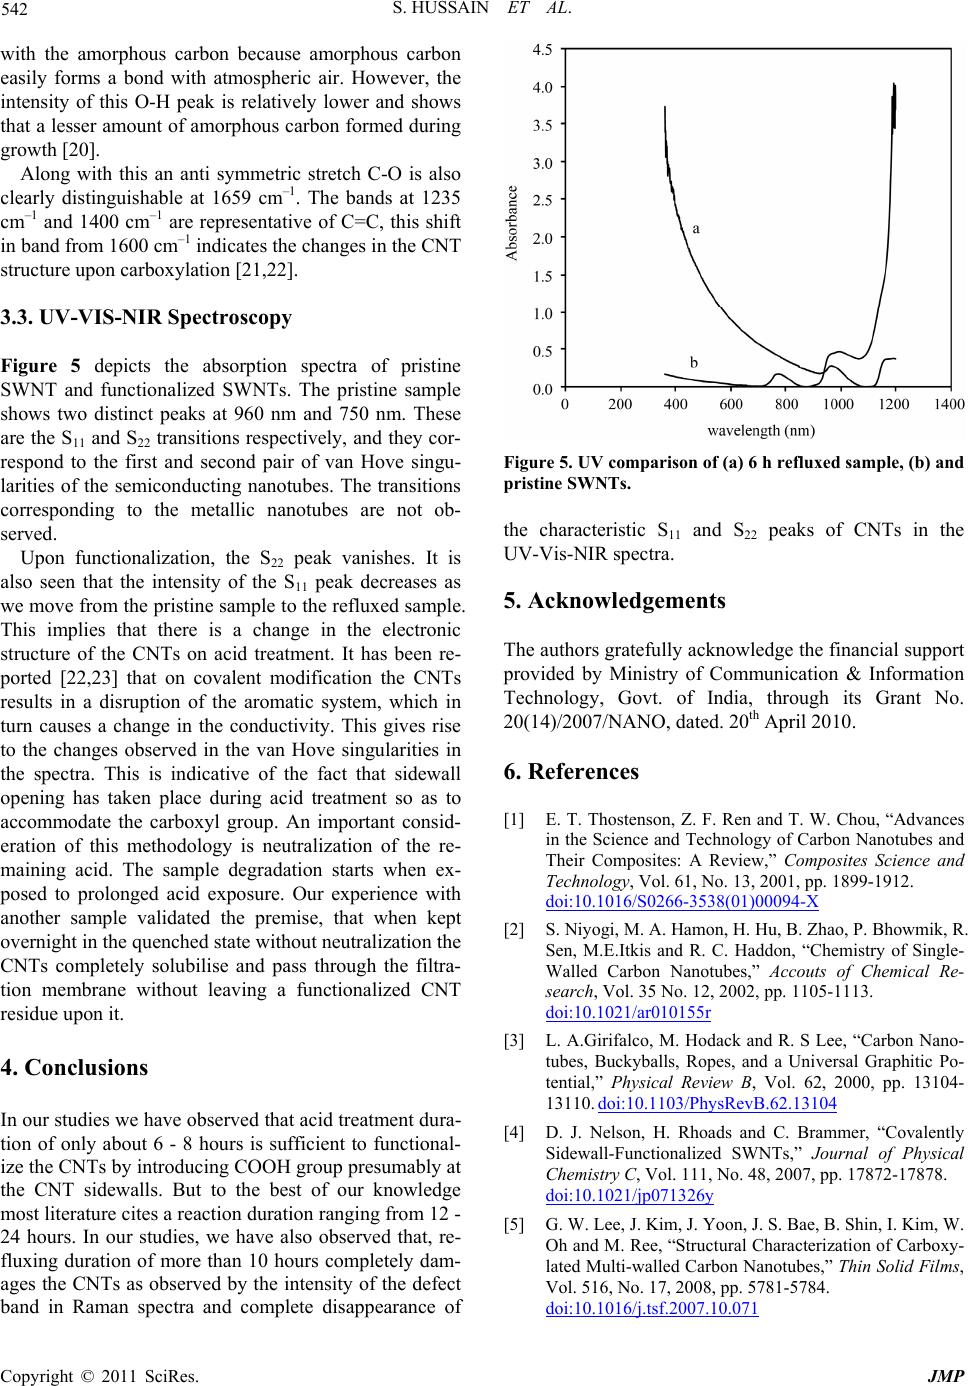 542 S. HUSSAIN ET AL. with the amorphous carbon because amorphous carbon easily forms a bond with atmospheric air. However, the intensity of this O-H peak is relatively lower and shows that a lesser amount of amorphous carbon formed during growth [20]. Along with this an anti symmetric stretch C-O is also clearly distinguishable at 1659 cm–1. The bands at 1235 cm–1 and 1400 cm–1 are representative of C=C, this shift in band from 1600 cm–1 indicates the changes in the CNT structure upon carboxylation [21,22]. 3.3. UV-VIS-NIR Spectroscopy Figure 5 depicts the absorption spectra of pristine SWNT and functionalized SWNTs. The pristine sample shows two distinct peaks at 960 nm and 750 nm. These are the S11 and S22 transitions respectively, and they cor- respond to the first and second pair of van Hove singu- larities of the semiconducting nanotubes. The transitions corresponding to the metallic nanotubes are not ob- served. Upon functionalization, the S22 peak vanishes. It is also seen that the intensity of the S11 peak decreases as we move from the pristine sample to the refluxed sample. This implies that there is a change in the electronic structure of the CNTs on acid treatment. It has been re- ported [22,23] that on covalent modification the CNTs results in a disruption of the aromatic system, which in turn causes a change in the conductivity. This gives rise to the changes observed in the van Hove singularities in the spectra. This is indicative of the fact that sidewall opening has taken place during acid treatment so as to accommodate the carboxyl group. An important consid- eration of this methodology is neutralization of the re- maining acid. The sample degradation starts when ex- posed to prolonged acid exposure. Our experience with another sample validated the premise, that when kept overnight in the quenched state without neutralization the CNTs completely solubilise and pass through the filtra- tion membrane without leaving a functionalized CNT residue upon it. 4. Conclusions In our studies we have observed that acid treatment dura- tion of only about 6 - 8 hours is sufficient to functional- ize the CNTs by introducing COOH group presumably at the CNT sidewalls. But to the best of our knowledge most literature cites a reaction duration ranging from 12 - 24 hours. In our studies, we have also observed that, re- fluxing duration of more than 10 hours completely dam- ages the CNTs as observed by the intensity of the defect band in Raman spectra and complete disappearance of Figure 5. UV comparison of (a) 6 h refluxed sample, (b) and pristine SWNTs. the characteristic S11 and S22 peaks of CNTs in the UV-Vis-NIR spectra. 5. Acknowledgements The authors gratefully acknowledge the financial support provided by Ministry of Communication & Information Technology, Govt. of India, through its Grant No. 20(14)/2007/NANO, dated. 20th April 2010. 6. References [1] E. T. Thostenson, Z. F. Ren and T. W. Chou, “Advances in the Science and Technology of Carbon Nanotubes and Their Composites: A Review,” Composites Science and Technology, Vol. 61, No. 13, 2001, pp. 1899-1912. doi:10.1016/S0266-3538(01)00094-X [2] S. Niyogi, M. A. Hamon, H. Hu, B. Zhao, P. Bhowmik, R. Sen, M.E.Itkis and R. C. Haddon, “Chemistry of Single- Walled Carbon Nanotubes,” Accouts of Chemical Re- search, Vol. 35 No. 12, 2002, pp. 1105-1113. doi:10.1021/ar010155r [3] L. A.Girifalco, M. Hodack and R. S Lee, “Carbon Nano- tubes, Buckyballs, Ropes, and a Universal Graphitic Po- tential,” Physical Review B, Vol. 62, 2000, pp. 13104- 13110. doi:10.1103/PhysRevB.62.13104 [4] D. J. Nelson, H. Rhoads and C. Brammer, “Covalently Sidewall-Functionalized SWNTs,” Journal of Physical Chemistry C, Vol. 111, No. 48, 2007, pp. 17872-17878. doi:10.1021/jp071326y [5] G. W. Lee, J. Kim, J. Yoon, J. S. Bae, B. Shin, I. Kim, W. Oh and M. Ree, “Structural Characterization of Carboxy- lated Multi-walled Carbon Nanotubes,” Thin Solid Films, Vol. 516, No. 17, 2008, pp. 5781-5784. doi:10.1016/j.tsf.2007.10.071 Copyright © 2011 SciRes. JMP 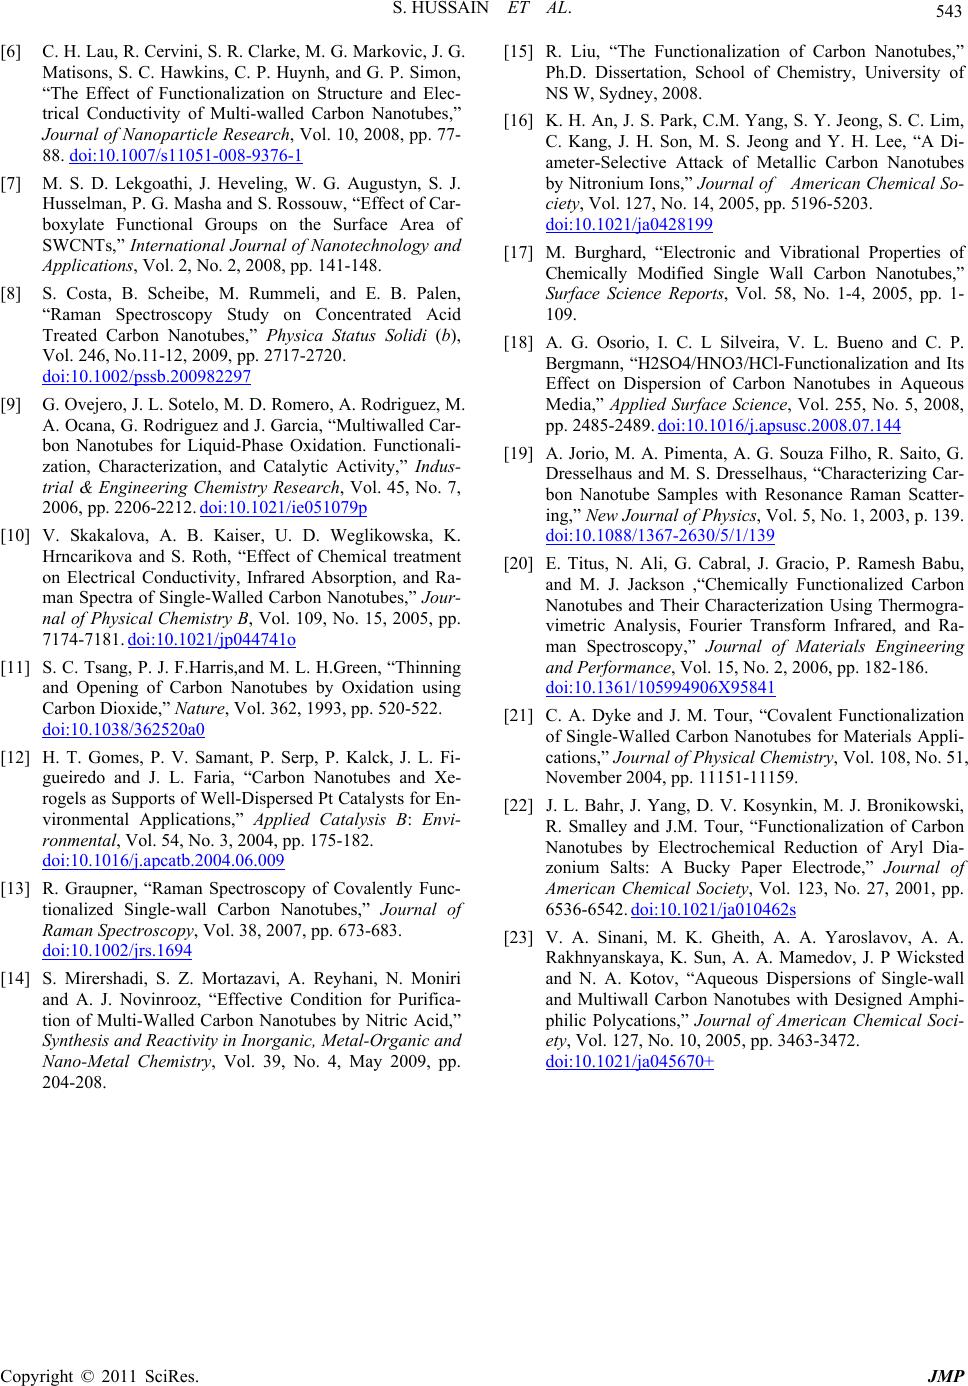 S. HUSSAIN ET AL. Copyright © 2011 SciRes. JMP 543 [6] C. H. Lau, R. Cervini, S. R. Clarke, M. G. Markovic, J. G. Matisons, S. C. Hawkins, C. P. Huynh, and G. P. Simon, “The Effect of Functionalization on Structure and Elec- trical Conductivity of Multi-walled Carbon Nanotubes,” Journal of Nanoparticle Research, Vol. 10, 2008, pp. 77- 88. doi:10.1007/s11051-008-9376-1 [7] M. S. D. Lekgoathi, J. Heveling, W. G. Augustyn, S. J. Husselman, P. G. Masha and S. Rossouw, “Effect of Car- boxylate Functional Groups on the Surface Area of SWCNTs,” International Journal of Nanotechnology and Applications, Vol. 2, No. 2, 2008, pp. 141-148. [8] S. Costa, B. Scheibe, M. Rummeli, and E. B. Palen, “Raman Spectroscopy Study on Concentrated Acid Treated Carbon Nanotubes,” Physica Status Solidi (b), Vol. 246, No.11-12, 2009, pp. 2717-2720. doi:10.1002/pssb.200982297 [9] G. Ovejero, J. L. Sotelo, M. D. Romero, A. Rodriguez, M. A. Ocana, G. Rodriguez and J. Garcia, “Multiwalled Car- bon Nanotubes for Liquid-Phase Oxidation. Functionali- zation, Characterization, and Catalytic Activity,” Indus- trial & Engineering Chemistry Research, Vol. 45, No. 7, 2006, pp. 2206-2212. doi:10.1021/ie051079p [10] V. Skakalova, A. B. Kaiser, U. D. Weglikowska, K. Hrncarikova and S. Roth, “Effect of Chemical treatment on Electrical Conductivity, Infrared Absorption, and Ra- man Spectra of Single-Walled Carbon Nanotubes,” Jour- nal of Physical Chemistry B, Vol. 109, No. 15, 2005, pp. 7174-7181. doi:10.1021/jp044741o [11] S. C. Tsang, P. J. F.Harris,and M. L. H.Green, “Thinning and Opening of Carbon Nanotubes by Oxidation using Carbon Dioxide,” Nature, Vol. 362, 1993, pp. 520-522. doi:10.1038/362520a0 [12] H. T. Gomes, P. V. Samant, P. Serp, P. Kalck, J. L. Fi- gueiredo and J. L. Faria, “Carbon Nanotubes and Xe- rogels as Supports of Well-Dispersed Pt Catalysts for En- vironmental Applications,” Applied Catalysis B: Envi- ronmental, Vol. 54, No. 3, 2004, pp. 175-182. doi:10.1016/j.apcatb.2004.06.009 [13] R. Graupner, “Raman Spectroscopy of Covalently Func- tionalized Single-wall Carbon Nanotubes,” Journal of Raman Spectroscopy, Vol. 38, 2007, pp. 673-683. doi:10.1002/jrs.1694 [14] S. Mirershadi, S. Z. Mortazavi, A. Reyhani, N. Moniri and A. J. Novinrooz, “Effective Condition for Purifica- tion of Multi-Walled Carbon Nanotubes by Nitric Acid,” Synthesis and Reactivity in Inorganic, Metal-Organic and Nano-Metal Chemistry, Vol. 39, No. 4, May 2009, pp. 204-208. [15] R. Liu, “The Functionalization of Carbon Nanotubes,” Ph.D. Dissertation, School of Chemistry, University of NS W, Sydney, 2008. [16] K. H. An, J. S. Park, C.M. Yang, S. Y. Jeong, S. C. Lim, C. Kang, J. H. Son, M. S. Jeong and Y. H. Lee, “A Di- ameter-Selective Attack of Metallic Carbon Nanotubes by Nitronium Ions,” Journal of American Chemical So- ciety, Vol. 127, No. 14, 2005, pp. 5196-5203. doi:10.1021/ja0428199 [17] M. Burghard, “Electronic and Vibrational Properties of Chemically Modified Single Wall Carbon Nanotubes,” Surface Science Reports, Vol. 58, No. 1-4, 2005, pp. 1- 109. [18] A. G. Osorio, I. C. L Silveira, V. L. Bueno and C. P. Bergmann, “H2SO4/HNO3/HCl-Functionalization and Its Effect on Dispersion of Carbon Nanotubes in Aqueous Media,” Applied Surface Science, Vol. 255, No. 5, 2008, pp. 2485-2489. doi:10.1016/j.apsusc.2008.07.144 [19] A. Jorio, M. A. Pimenta, A. G. Souza Filho, R. Saito, G. Dresselhaus and M. S. Dresselhaus, “Characterizing Car- bon Nanotube Samples with Resonance Raman Scatter- ing,” New Journal of Physics, Vol. 5, No. 1, 2003, p. 139. doi:10.1088/1367-2630/5/1/139 [20] E. Titus, N. Ali, G. Cabral, J. Gracio, P. Ramesh Babu, and M. J. Jackson ,“Chemically Functionalized Carbon Nanotubes and Their Characterization Using Thermogra- vimetric Analysis, Fourier Transform Infrared, and Ra- man Spectroscopy,” Journal of Materials Engineering and Performance, Vol. 15, No. 2, 2006, pp. 182-186. doi:10.1361/105994906X95841 [21] C. A. Dyke and J. M. Tour, “Covalent Functionalization of Single-Walled Carbon Nanotubes for Materials Appli- cations,” Journal of Physical Chemistry, Vol. 108, No. 51, November 2004, pp. 11151-11159. [22] J. L. Bahr, J. Yang, D. V. Kosynkin, M. J. Bronikowski, R. Smalley and J.M. Tour, “Functionalization of Carbon Nanotubes by Electrochemical Reduction of Aryl Dia- zonium Salts: A Bucky Paper Electrode,” Journal of American Chemical Society, Vol. 123, No. 27, 2001, pp. 6536-6542. doi:10.1021/ja010462s [23] V. A. Sinani, M. K. Gheith, A. A. Yaroslavov, A. A. Rakhnyanskaya, K. Sun, A. A. Mamedov, J. P Wicksted and N. A. Kotov, “Aqueous Dispersions of Single-wall and Multiwall Carbon Nanotubes with Designed Amphi- philic Polycations,” Journal of American Chemical Soci- ety, Vol. 127, No. 10, 2005, pp. 3463-3472. doi:10.1021/ja045670+ |