

Paper Menu >>
Journal Menu >>
 J. Biomedical Science and Engineering, 2009, 2, 210-215 doi: 10.4236/jbise.2009.24034 Published Online August 2009 (http://www.SciRP.org/journal/jbise/ JBiSE ). Published Online August 2009 in SciRes. http:// www.scirp.org/journal/jbise Changes in cerebral perfusion detected by dynamic susceptibility contrast magnetic resonance imaging: normal volunteers examined during normal breathing and hyperventilation Ronnie Wirestam1*, Christian Engvall2, Erik Ryding3, Stig Holtås4, Freddy Ståhlberg1,4, Peter Reinstrup2 1Department of Medical Radiation Physics, Lund University, Lund, Sweden; 2Department of Anaesthesiology & Intensive Care, Lund University Hospital, Lund, Sweden; 3Department of Clinical Neurophysiology, Lund University Hospital, Lund, Sweden; 4Department of Diagnostic Radiology, Lund University, Lund, Sweden. Email: [email protected] Received 3 March 2009; revised 2 April 2009; accepted 24 April 2009. ABSTRACT Global cerebral perfusion parameters were measured using dynamic susceptibility contrast magnetic resonance imaging (DSC-MRI) in eight healthy volunteers examined during normal breathing and spontaneous hyperventilation. DSC-MRI-based cerebral blood flow (CBF) de- creased during hyperventilation in all volun- teers (average decrease 29%), and the corre- sponding global CBF estimates were 73±19ml/ (min100g) during normal breathing and 52± 7.9ml/(min100g) during hyperventilation (mean ±SD, n=8). Furthermore, the hypocapnic condi- tions induced by hyperventilation resulted in a prolongation of the global mean transit time (MTT) by on average 14%. The observed CBF estimates appeared to be systematically over- estimated, in accordance with previously pub- lished DSC-MRI results, but reduced to more reasonable levels when a previously retrieved calibration factor was applied. Keywords: Magnetic Resonance Imaging; Perfu- sion; Cerebral Blood Flow; Mean Transit Time; Hypocapnia 1. INTRODUCTION The use of dynamic susceptibility contrast magnetic resonance imaging (DSC-MRI) for assessment of perfu- sion-related parameters is promising [1,2], but the con- cept shows a number of methodological complications. For example, accurate registration of the arterial input function (AIF), i.e. the concentration-versus-time curve in an appropriate tissue-feeding artery, is hampered by arterial signal saturation [3] and local geometrical distor- tion [4] at peak concentration, as well as by partial- volume effects [5]. Furthermore, the T2* relaxivities of the paramagnetic contrast agent are, most likely, differ- ent in arterial and tissue environments, and the non-lin- ear relationship in whole blood between transversal re- laxation-rate change (R2*) and contrast-agent concen- tration needs to be considered when gradient-echo pulse sequences are used [6]. Attempts to achieve absolute quantification of perfusion parameters by standard DSC- MRI have typically been characterized by overestimated absolute values of cerebral blood volume (CBV) and cerebral blood flow (CBF) [1,3,7,8,9], and these obser- vations are attributed, at least in part, to a correspond- ingly underestimated arterial concentration time integral. Hence, most existing implementations of DSC-MRI provide perfusion parameters only in relative terms. Reproducible absolute quantification of CBF is indeed desirable, for example, in the follow-up of tumour or stroke therapy, for determining tissue at risk in acute ischaemic stroke and when a global change in CBF can be expected. The potential of DSC-MRI for absolute or semi-absolute CBF quantification is not yet fully estab- lished, and additional information is warranted. Hence, in order to further investigate the usefulness of DSC- MRI for absolute quantification as well as for detection of controlled changes in perfusion, estimates of global CBF and mean transit time (MTT) were acquired in a group of normal volunteers examined during normal breathing and spontaneous hyperventilation. The pri- mary aim of this study was to test the capability of DSC-MRI to detect and quantify changes in global cere- bral perfusion caused by spontaneous hyperventilation. 2. METHODS 2.1. Subjects and Experimental Procedure Eight healthy volunteers (mean age 33 years) were in- *Corresponding author. 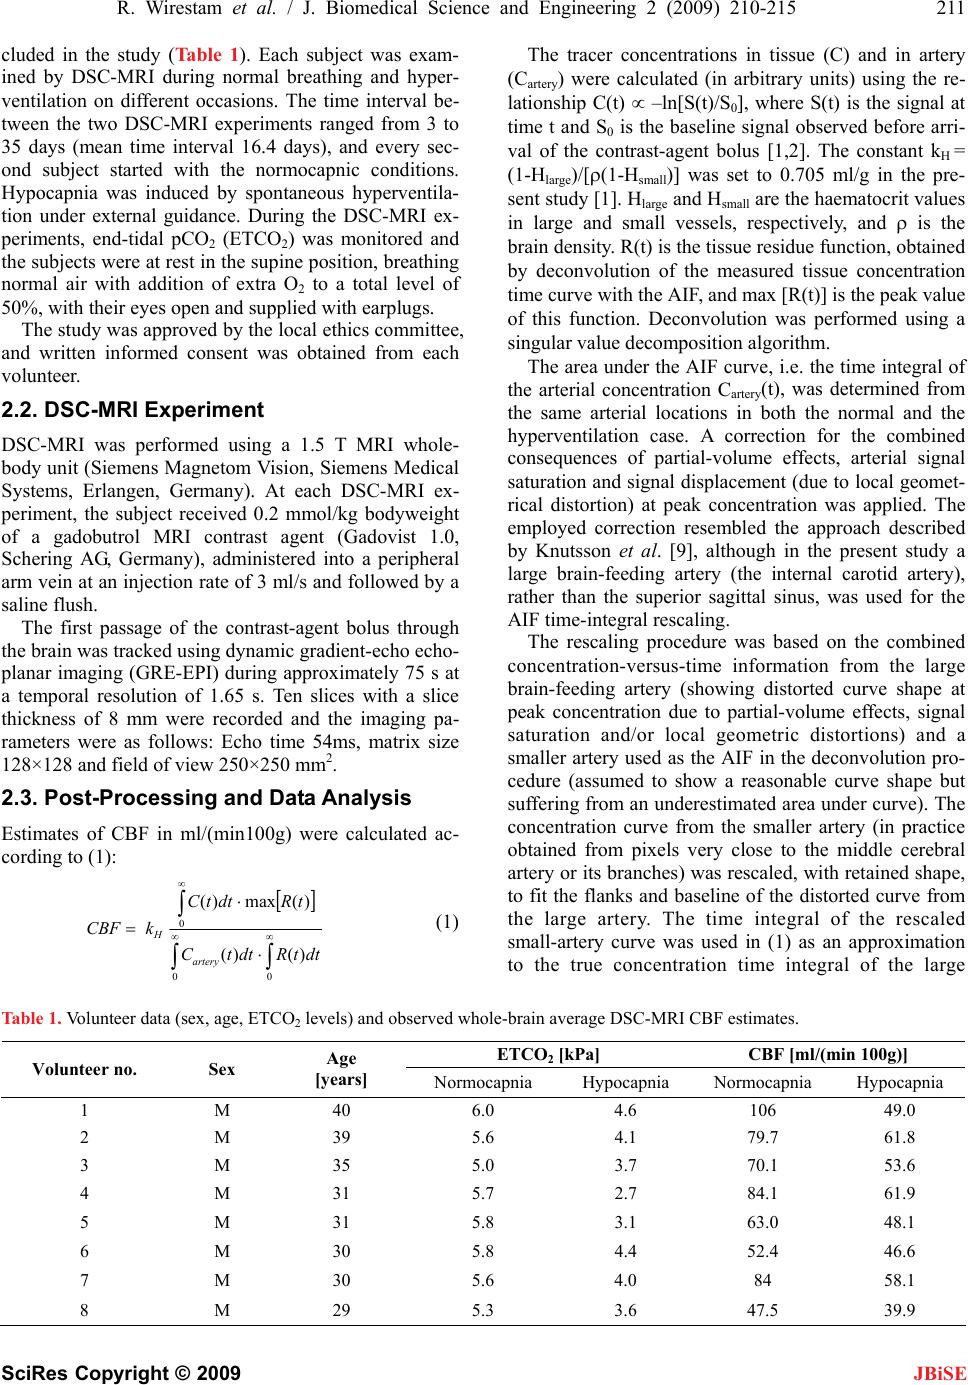 R. Wirestam et al. / J. Biomedical Science and Engineering 2 (2009) 210-215 211 SciRes Copyright © 2009 JBiSE cluded in the study (Table 1). Each subject was exam- ined by DSC-MRI during normal breathing and hyper- ventilation on different occasions. The time interval be- tween the two DSC-MRI experiments ranged from 3 to 35 days (mean time interval 16.4 days), and every sec- ond subject started with the normocapnic conditions. Hypocapnia was induced by spontaneous hyperventila- tion under external guidance. During the DSC-MRI ex- periments, end-tidal pCO2 (ETCO2) was monitored and the subjects were at rest in the supine position, breathing normal air with addition of extra O2 to a total level of 50%, with their eyes open and supplied with earplugs. The study was approved by the local ethics committee, and written informed consent was obtained from each volunteer. 2.2. DSC-MRI Experiment DSC-MRI was performed using a 1.5 T MRI whole- body unit (Siemens Magnetom Vision, Siemens Medical Systems, Erlangen, Germany). At each DSC-MRI ex- periment, the subject received 0.2 mmol/kg bodyweight of a gadobutrol MRI contrast agent (Gadovist 1.0, Schering AG, Germany), administered into a peripheral arm vein at an injection rate of 3 ml/s and followed by a saline flush. The first passage of the contrast-agent bolus through the brain was tracked using dynamic gradient-echo echo- planar imaging (GRE-EPI) during approximately 75 s at a temporal resolution of 1.65 s. Ten slices with a slice thickness of 8 mm were recorded and the imaging pa- rameters were as follows: Echo time 54ms, matrix size 128×128 and field of view 250×250 mm2. 2.3. Post-Processing and Data Analysis Estimates of CBF in ml/(min100g) were calculated ac- cording to (1): 00 0 )()( )(max)( dttRdttC tRdttC kCBF artery H (1) The tracer concentrations in tissue (C) and in artery (Cartery) were calculated (in arbitrary units) using the re- lationship C(t) –ln[S(t)/S0], where S(t) is the signal at time t and S0 is the baseline signal observed before arri- val of the contrast-agent bolus [1,2]. The constant kH = (1-Hlarge)/[(1-Hsmall)] was set to 0.705 ml/g in the pre- sent study [1]. Hlarge and Hsmall are the haematocrit values in large and small vessels, respectively, and is the brain density. R(t) is the tissue residue function, obtained by deconvolution of the measured tissue concentration time curve with the AIF, and max [R(t)] is the peak value of this function. Deconvolution was performed using a singular value decomposition algorithm. The area under the AIF curve, i.e. the time integral of the arterial concentration Cartery(t), was determined from the same arterial locations in both the normal and the hyperventilation case. A correction for the combined consequences of partial-volume effects, arterial signal saturation and signal displacement (due to local geomet- rical distortion) at peak concentration was applied. The employed correction resembled the approach described by Knutsson et al. [9], although in the present study a large brain-feeding artery (the internal carotid artery), rather than the superior sagittal sinus, was used for the AIF time-integral rescaling. The rescaling procedure was based on the combined concentration-versus-time information from the large brain-feeding artery (showing distorted curve shape at peak concentration due to partial-volume effects, signal saturation and/or local geometric distortions) and a smaller artery used as the AIF in the deconvolution pro- cedure (assumed to show a reasonable curve shape but suffering from an underestimated area under curve). The concentration curve from the smaller artery (in practice obtained from pixels very close to the middle cerebral artery or its branches) was rescaled, with retained shape, to fit the flanks and baseline of the distorted curve from the large artery. The time integral of the rescaled small-artery curve was used in (1) as an approximation to the true concentration time integral of the large Table 1. Volunteer data (sex, age, ETCO2 levels) and observed whole-brain average DSC-MRI CBF estimates. ETCO2 [kPa] CBF [ml/(min 100g)] Volunteer no. Sex Age [years] Normocapnia Hypocapnia Normocapnia Hypocapnia 1 M 40 6.0 4.6 106 49.0 2 M 39 5.6 4.1 79.7 61.8 3 M 35 5.0 3.7 70.1 53.6 4 M 31 5.7 2.7 84.1 61.9 5 M 31 5.8 3.1 63.0 48.1 6 M 30 5.8 4.4 52.4 46.6 7 M 30 5.6 4.0 84 58.1 8 M 29 5.3 3.6 47.5 39.9 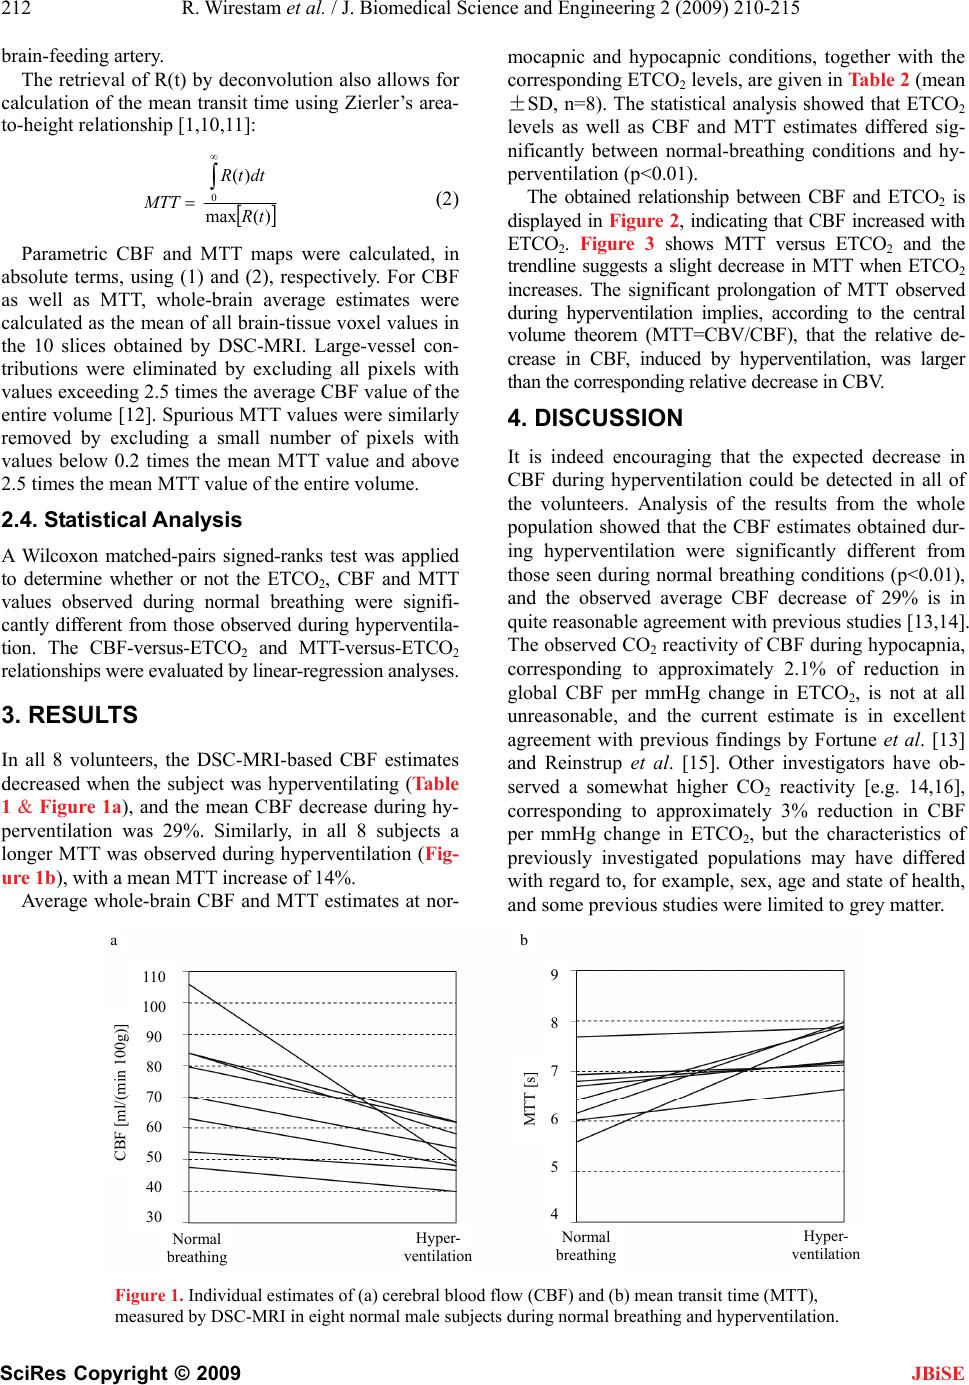 212 R. Wirestam et al. / J. Biomedical Science and Engineering 2 (2009) 210-215 SciRes Copyright © 2009 JBiSE brain-feeding artery. The retrieval of R(t) by deconvolution also allows for calculation of the mean transit time using Zierler’s area- to-height relationship [1,10,11]: )(max )( 0 tR dttR MTT Parametric CBF and MTT maps were calculated, in absolute terms, using (1) and (2), respectively. For CBF as well as MTT, whole-brain average estimates were calculated as the mean of all brain-tissue voxel values in the 10 slices obtained by DSC-MRI. Large-vessel con- tributions were eliminated by excluding all pixels with values exceeding 2.5 times the average CBF value of the entire volume [12]. Spurious MTT values were similarly removed by excluding a small number of pixels with values below 0.2 times the mean MTT value and above 2.5 times the mean MTT value of the entire volume. 2.4. Statistical Analysis A Wilcoxon matched-pairs signed-ranks test was applied to determine whether or not the ETCO2, CBF and MTT values observed during normal breathing were signifi- cantly different from those observed during hyperventila- tion. The CBF-versus-ETCO2 and MTT-versus-ETCO2 relationships were evaluated by linear-regression analyses. 3. RESULTS In all 8 volunteers, the DSC-MRI-based CBF estimates decreased when the subject was hyperventilating (Table 1 & Figure 1a), and the mean CBF decrease during hy- perventilation was 29%. Similarly, in all 8 subjects a longer MTT was observed during hyperventilation (Fig- ure 1b), with a mean MTT increase of 14%. Average whole-brain CBF and MTT estimates at nor- mocapnic and hypocapnic conditions, together with the corresponding ETCO2 levels, are given in Table 2 (mean ±SD, n=8). The statistical analysis showed that ETCO2 levels as well as CBF and MTT estimates differed sig- nificantly between normal-breathing conditions and hy- perventilation (p<0.01). The obtained relationship between CBF and ETCO2 is displayed in Figure 2, indicating that CBF increased with ETCO2. Figure 3 shows MTT versus ETCO2 and the trendline suggests a slight decrease in MTT when ETCO2 increases. The significant prolongation of MTT observed during hyperventilation implies, according to the central volume theorem (MTT=CBV/CBF), that the relative de- crease in CBF, induced by hyperventilation, was larger than the corresponding relative decrease in CBV. 4. DISCUSSION It is indeed encouraging that the expected decrease in CBF during hyperventilation could be detected in all of the volunteers. Analysis of the results from the whole population showed that the CBF estimates obtained dur- ing hyperventilation were significantly different from those seen during normal breathing conditions (p<0.01), and the observed average CBF decrease of 29% is in quite reasonable agreement with previous studies [13,14]. The observed CO2 reactivity of CBF during hypocapnia, corresponding to approximately 2.1% of reduction in global CBF per mmHg change in ETCO2, is not at all unreasonable, and the current estimate is in excellent agreement with previous findings by Fortune et al. [13] and Reinstrup et al. [15]. Other investigators have ob- served a somewhat higher CO2 reactivity [e.g. 14,16], corresponding to approximately 3% reduction in CBF per mmHg change in ETCO2, but the characteristics of previously investigated populations may have differed with regard to, for example, sex, age and state of health, and some previous studies were limited to grey matter. 110 100 Figure 1. Individual estimates of (a) cerebral blood flow (CBF) and (b) mean transit time (MTT), measured by DSC-MRI in eight normal male subjects during normal breathing and hyperventilation. CBF [ml/(min 100g)] 90 80 70 60 50 40 30 a b MTT [s] 9 8 7 6 5 4 Normal breathing Normal Hyper- ventilation Hyper- ventilation breathing 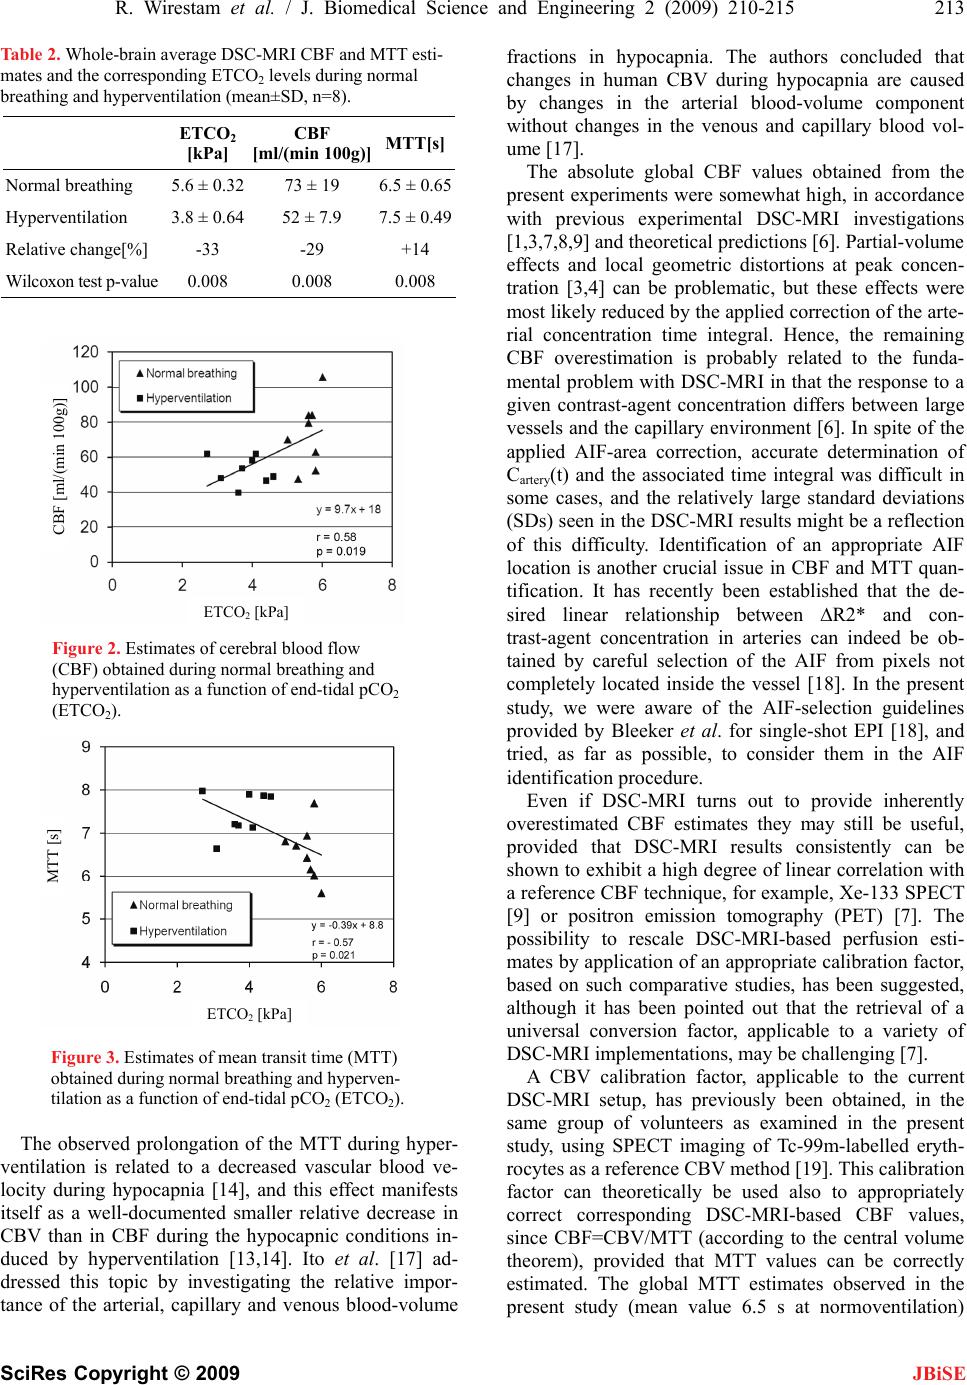 R. Wirestam et al. / J. Biomedical Science and Engineering 2 (2009) 210-215 213 SciRes Copyright © 2009 JBiSE Table 2. Whole-brain average DSC-MRI CBF and MTT esti- mates and the corresponding ETCO2 levels during normal breathing and hyperventilation (mean±SD, n=8). ETCO2 [kPa] CBF [ml/(min 100g)] MTT[s] Normal breathing 5.6 ± 0.3273 ± 19 6.5 ± 0.65 Hyperventilation 3.8 ± 0.6452 ± 7.9 7.5 ± 0.49 Relative change[%] -33 -29 +14 Wilcoxon test p-value 0.008 0.008 0.008 Figure 2. Estimates of cerebral blood flow (CBF) obtained during normal breathing and hyperventilation as a function of end-tidal pCO2 (ETCO2). Figure 3. Estimates of mean transit time (MTT) obtained during normal breathing and hyperven- tilation as a function of end-tidal pCO2 (ETCO2). The observed prolongation of the MTT during hyper- ventilation is related to a decreased vascular blood ve- locity during hypocapnia [14], and this effect manifests itself as a well-documented smaller relative decrease in CBV than in CBF during the hypocapnic conditions in- duced by hyperventilation [13,14]. Ito et al. [17] ad- dressed this topic by investigating the relative impor- tance of the arterial, capillary and venous blood-volume fractions in hypocapnia. The authors concluded that changes in human CBV during hypocapnia are caused by changes in the arterial blood-volume component without changes in the venous and capillary blood vol- ume [17]. The absolute global CBF values obtained from the present experiments were somewhat high, in accordance with previous experimental DSC-MRI investigations [1,3,7,8,9] and theoretical predictions [6]. Partial-volume effects and local geometric distortions at peak concen- tration [3,4] can be problematic, but these effects were most likely reduced by the applied correction of the arte- rial concentration time integral. Hence, the remaining CBF overestimation is probably related to the funda- mental problem with DSC-MRI in that the response to a given contrast-agent concentration differs between large vessels and the capillary environment [6]. In spite of the applied AIF-area correction, accurate determination of Cartery(t) and the associated time integral was difficult in some cases, and the relatively large standard deviations (SDs) seen in the DSC-MRI results might be a reflection of this difficulty. Identification of an appropriate AIF location is another crucial issue in CBF and MTT quan- tification. It has recently been established that the de- sired linear relationship between R2* and con- trast-agent concentration in arteries can indeed be ob- tained by careful selection of the AIF from pixels not completely located inside the vessel [18]. In the present study, we were aware of the AIF-selection guidelines provided by Bleeker et al. for single-shot EPI [18], and tried, as far as possible, to consider them in the AIF identification procedure. CBF [ml/(min 100g)] ETCO2 [kPa] Even if DSC-MRI turns out to provide inherently overestimated CBF estimates they may still be useful, provided that DSC-MRI results consistently can be shown to exhibit a high degree of linear correlation with a reference CBF technique, for example, Xe-133 SPECT [9] or positron emission tomography (PET) [7]. The possibility to rescale DSC-MRI-based perfusion esti- mates by application of an appropriate calibration factor, based on such comparative studies, has been suggested, although it has been pointed out that the retrieval of a universal conversion factor, applicable to a variety of DSC-MRI implementations, may be challenging [7]. MTT [s] ETCO2 [kPa] A CBV calibration factor, applicable to the current DSC-MRI setup, has previously been obtained, in the same group of volunteers as examined in the present study, using SPECT imaging of Tc-99m-labelled eryth- rocytes as a reference CBV method [19]. This calibration factor can theoretically be used also to appropriately correct corresponding DSC-MRI-based CBF values, since CBF=CBV/MTT (according to the central volume theorem), provided that MTT values can be correctly estimated. The global MTT estimates observed in the present study (mean value 6.5 s at normoventilation)  214 R. Wirestam et al. / J. Biomedical Science and Engineering 2 (2009) 210-215 SciRes Copyright © 2009 JBiSE were quite reasonable, and in accordance with previ- ously published PET results from normal subjects. For example, Kaneko et al. [20] observed MTT values of 6.1 s in grey matter and 8.1 s in white matter, and the large study by Leenders et al. [21] showed CBV-to-CBF ratios of 5.7 s in insular grey matter and 7.3 s in white matter. Application of the calibration factor to the present data resulted in a corrected whole-brain average CBF of ap- proximately 42 ml/(min100g). Literature values of nor- mal global CBF in humans at rest vary over a consider- able range [22,23], but are typically between 40 and 50ml/(min100g) for the adult population. For example, Knutsson et al. [9] obtained a whole-brain average CBF of 40ml/(min100g) (in elderly normal subjects) by Xe-133 SPECT, Slosman et al. [24] observed a global CBF of 43ml/(min100g) in male volunteers (age interval 29-38 years), also by use of Xe-133 SPECT, Dörfler et al. [22] reported a global CBF estimate of 48ml/ (min100g) based on extracranial sonography and Mat- thew et al. [25] observed 40 ml/(min100g) using H2 15O PET. Finally, Yonas et al. [26] employed stable xenon computed tomography (Xe-CT) and extracted regional CBF values of 92ml/(min100g) in the highest-flow compartments, 54ml/(min 100g) in mixed-cortical re- gions (calculated from linear-regression equations and corresponding to the age of 33 years) and an age-inde- pendent white-matter regional CBF of 20ml/(min100g). In conclusion, DSC-MRI showed promising results in the detection of controlled perfusion changes, induced by spontaneous hyperventilation, in individual subjects. In accordance with previously reported DSC-MRI ex- periments, uncorrected absolute CBF values appeared to be overestimated. 5. ACKNOWLEDGEMENTS This study was supported by the Swedish Research Council (project no. 13514), the Swedish Cancer Society and the Crafoord Foundation, Lund. REFERENCES [1] K. A. Rempp, G. Brix, F. Wenz, C. R. Becker , F. Gückel, and W. J. Lorenz, (1994) Quantification of regional cerebral blood flow and volume with dynamic suscepti- bility contrast-enhanced MR imaging, Radiology, 193, 637-641. [2] L. Østergaard, R. M. Weisskoff, D. A. Chesler, C. Gyldensted, and B. R. Rosen, (1996) High resolution measurement of cerebral blood flow using intravascular tracer bolus passages, Part I: Mathematical Approach and Statistical Analysis, Magnetic Resonance in Medicine, 36, 715-725. [3] R. Ellinger, C. Kremser, M. F. Schocke, C. Kolbitsch, J. Griebel, S. R. Felber, and F. T.Aichner, (2000) The impact of peak saturation of the arterial input function on quantitative evaluation of dynamic susceptibility con- trast-enhanced MR studies, Journal of Computer Assisted Tomography, 24, 942-948. [4] M. Rausch, K. Scheffler, M. Rudin, and E. W. Radu, (2000) Analysis of input functions from different arterial branches with gamma variate functions and cluster analysis for quantitative blood volume measurements, Magnetic Resonance Imaging, 18, 1235-1243. [5] J. J. Chen, M. R. Smith, and R. Frayne, (2005) The impact of partial-volume effects in dynamic suscepti- bility contrast magnetic resonance perfusion imaging, Journal of Magnetic Resonance Imaging, 22, 390-399. [6] B. F. Kjølby, L. Østergaard, and V. G. Kiselev, (2006) Theoretical model of intravascular paramagnetic tracers effect on tissue relaxation, Magnetic Resonance in Medicine, 56, 187-197. [7] C. B. Grandin, A. Bol, A. M. Smith, C. Michel, and G. Cosnard, (2005) Absolute CBF and CBV measurements by MRI bolus tracking before and after acetazolamide challenge: Repeatability and comparison with PET in humans, NeuroImage, 26, 525-535. [8] K. E. Sakaie, W. Shin, K. R. Curtin, R. M. McCarthy, T. A. Cashen, T. J. and Carroll, (2005) Method for improving the accuracy of quantitative cerebral perfusion imaging, Journal of Magnetic Resonance Imaging, 21, 512-519. [9] L. Knutsson, S. Börjesson, E. M. Larsson, J. Risberg, L. Gustafson, U. Passant, F. Ståhlberg, and R. Wirestam, (2007) Absolute quantification of cerebral blood flow in normal volunteers: Correlation between Xe-133 SPECT and dynamic susceptibility contrast MRI, Journal of Magnetic Resonance Imaging, 26, 913-920. [10] P. Meier and K. L. Zierler, (1954) On the theory of indicator-dilution method for measurement of blood flow and volume, Journal of Applied Physiology, 6, 731-744. [11] K. L. Zierler, (1965) Equations for measuring blood flow by external monitoring of radioisotopes, Circulation Research, 16, 309-321. [12] T. Ernst, L. Chang, L. Itti, and O. Speck, (1999) Correlation of regional cerebral blood flow from perfusion MRI and SPECT in normal subjects, Magnetic Resonance Imaging, 17, 349–354. [13] J. B. Fortune, P. J. Feustel, C. deLuna, L. Graca, J. Hasselbarth, and A. M. Kupinski, (1995) Cerebral blood flow and blood volume in response to O2 and CO2 changes in normal humans, Journal of Trauma, 39, 463-472. [14] H. Ito, I. Kanno, M. Ibaraki, J. Hatazawa, and S. Miura, (2003) Changes in human cerebral blood flow and cerebral blood volume during hypercapnia and hypocapnia measured by positron emission tomography, Journal of Cerebral Blood Flow and Metabolism, 23, 665-670. [15] P. Reinstrup, E. Ryding, L. Algotsson, L. Berntman, and T. Uski, (1994) Effects of nitrous oxide on human regional cerebral blood flow and isolated pial arteries, Anesthesiology, 81, 396–402. [16] W. D. Obrist, T. W. Langfitt, J. L. Jaggi, J. Cruz, and T. A. Gennarelli, (1984) Cerebral blood flow and meta- bolism in comatose patients with acute head injury. Relationship to intracranial hypertension, Journal of Neurosurgery, 61, 241-253. [17] H. Ito, M. Ibaraki, I. Kanno, H. Fukuda, and S. Miura, (2005) Changes in the arterial fraction of human cerebral blood volume during hypercapnia and hypocapnia  R. Wirestam et al. / J. Biomedical Science and Engineering 2 (2009) 210-215 215 SciRes Copyright © 2009 JBiSE measured by positron emission tomography, Journal of Cerebral Blood Flow and Metabolism, 25, 852-857. [18] E. J. W. Bleeker, M. A. van Buchem, and M. J. P. van Osch, (2009) Optimal location for arterial input function measurements near the middle cerebral artery in first-pass perfusion MRI, Journal of Cerebral Blood Flow and Metabolism, 29, 840-852. [19] C. Engvall, E. Ryding, R. Wirestam, S. Holtås, K. Ljunggren, T. Ohlsson, and P. Reinstrup, (2008) Human cerebral blood volume (CBV) measured by dynamic susceptibility contrast MRI and 99mTc-RBC SPECT, Journal of Neurosurgical Anesthesiology, 20, 41–44. [20] K. Kaneko, Y. Kuwabara, F. Mihara, T. Yoshiura, M. Nakagawa, A. Tanaka, M. Sasaki, H. Koga, K. Hayashi, and H. Honda, (2004) Validation of the CBF, CBV, and MTT values by perfusion MRI in chronic occlusive cerebrovascular disease: A comparison with 15O-PET, Academic Radiology, 11, 489-497. [21] K. L. Leenders, D. Perani, A. A. Lammertsma, J. D. Heather, P. Buckingham, M. J. Healy, J. M. Gibbs, R. J. Wise, J. Hatazawa, S. Herold, R. P. Beaney, D. J. Brooks, T. Spinks, C. Rhodes, R. S. Frackowiak, and T. Jones, (1990) Cerebral blood flow, blood volume and oxygen utilization: Normal values and effect of age, Brain, 113, 27-47. [22] P. Dörfler, I. Puls, M. Schliesser, M. Mäurer, and G. Becker, (2000) Measurement of cerebral blood flow volume by extracranial sonography, Journal of Cerebral Blood Flow and Metabolism, 20, 269-271. [23] N. A. Lassen, (1985) Normal average value of CBF in young adults is 50ml100 g-1 min-1, Journal of Cerebral Blood Flow and Metabolism [Editorial], 5, 347-349. [24] D. O. Slosman, C. Chicherio, C. Ludwig, L. Genton, S. de Ribaupierre, D. Hans, C. Pichard, E. Mayer, J. M. Annoni, and A. de Ribaupierre, (2001) 133Xe SPECT cerebral blood flow study in a healthy population: Determination of T-scores, Journal of Nuclear Medicine, 42, 864-870. [25] E. Matthew, P. Andreason, R. E. Carson, P. Herscovitch, K. Pettigrew, R. Cohen, C. King, C. E. Johanson, and S. M. Paul, (1993) Reproducibility of resting cerebral blood flow measurements with H2 15O positron emission tomography in humans, Journal of Cerebral Blood Flow and Metabolism, 13, 748-754. [26] H. Yonas, J. M. Darby, E. C. Marks, S. R. Durham, and C. Maxwell, (1991) CBF measured by Xe-CT: Approach to analysis and normal values, Journal of Cerebral Blood Flow and Metabolism, 11, 716-725. |