

Paper Menu >>
Journal Menu >>
 Advances in Materials Physics and Chemistry, 2011, 1, 1-5 doi:10.4236/ampc.2011.11001 Published Online June 2011 (http://www.SciRP.org/journal/ampc) Copyright © 2011 SciRes. AMPC Effectiveness of Selected Reaction Monitoring for rapid assay of Cypermethrin Residue in Perilla Leaves Noriyasu Niimura DATUM Solution Business Op erations, JEOL Ltd., Tokyo, Japan E-mail: [email protected] Received May 20, 2011; revised June 14, 2011; accepted J u ne 25, 2011 Abstract Many kinds of pesticides have been developed and used to yield a good harvest but the residues in agricul- tural products cause health problems. It is important to keep watch on these residues by using adequate methods of analysis. Pretreatment such as gel permeation chromatography (GPC) or column chromatography is often needed for the quantitative analysis of pesticide in agricultural products by conventional methods such as gas chromatography/low resolving power mass spectrometry (GC/LRMS). However, these pretreat- ments need a lot of work and take time. New methods saving the necessity of these pretreatments have been desired. We have applied selected reaction monitoring (SRM) to quantitatively determine cypermethrin residues in Perilla frutescens samples and compared the results with LRMS and HRMS in SIM mode. A background peak caused by the matrix overlapped the cypermethrin peak in the analysis using LRMS. SRM and HRMS in SIM mode provided chromatograms without matrix interference. The high selectivity of the product ion (m/z 127) produced from precursor ion (m/z 163) isolated the target peaks from the matrix peaks when using SRM. This method eliminates the pretreatment step, thus saving time and simplify ing the ana- lytical process. Keywords: Pesticide Residue, Cypermethrin, Perilla Frutescens, Selected Reaction Monitoring, high Re- solving Power mass Spectrometry 1. Introduction Many kinds of pesticides have been used for the control of harmful insects in agriculture. These have helped to improve the productivity of crops, but these residues in agricultural products have unfortunately posed a health hazard to the consumers. As for mammalian neurotoxic- ity, the serious damage to health by prolonged exposure to cypermethrin was reported [1]. Stricter consumer pro- tection laws have been enacted for the control of pesti- cides in Japan [2]. The legal limit for cypermethrin in Perilla frutescens leaves was set to be less than 6 g/ml. This underscores the need for efficient analytical proce- dures for pesticide residue detection in agricultural products. Conventional methods are complicated and time consuming, because the sample matrixes extracted from agricultural products are usually very complex [3]. For example, methods using a gas chromatography/low resolving power mass spectrometry (GC/LRMS) or a GC with an electron capture detector (GC-ECD) need pre- treatments such as gel permeation chromatography (GPC) or column chromatography to remove matrix interfer- ences [4-9]. A simpler method without the time consum- ing clean-up and purification procedures is needed for routine analysis. However, the method without pre- treatment using a GC/LRMS suffers from lack of accu- racy in quantitative analysis, because of the overlapping of the matrix peaks. In this study, high resolving power mass spectrometry (HRMS) and selected reaction monitoring (SRM) were applied. These methods can isolate target peaks from matrix peaks saving pretreatments. Using these methods, we analyzed cypermethrin added intentionally to the ex- tracts of the leaves of Perilla frutescens and the results were compared with that obtained by using LRMS. 2. Experiments 2.1. Standards and Reagents Cypermethrin (purity > 98%) was supplied from Dr.  2 N. NIIMURA Ehrenstorfer GmbH (Germany). Acetone, n-hexane, an- hydrous sodium sulfate and sodium chloride (pesticide residue analysis grade) were supplied from Wako Pure Chemical Industries (Japan). 2.2. Extraction The leaves of Perilla frutescens (20 g) were minced and placed into a blender cup. Acetone (100 ml) was added into the blender cup and these were homogenized at 10000 rpm for 2 min. The homogenate was filtered through a filter paper: No. 5A (Advantec Toyo, Japan). The residue was once again homogenized with 100 ml of acetone at 10000 rpm for 2 min. The homogenate was filtered through No. 5A filter paper. The filtrate was concentrated to <30 ml by using a rotary evaporator: RE 801 (Yamato Scientific, Ja- pan) at 40℃ of bath temperature. The sodium chloride aqueous solution (10%, 100 ml) and n-hexane (100 ml) were added to the extract. The mixture was shaken vigorously for 5 min and n-hexane (100 ml) was added to the parted aqueous layer. Repeat- ing this procedure, the mixture was extracted two times. The extract was added with anhydrous sodium sulfate (20 g) and concentrated to 5 ml. 2.3. Samples The standard solution of cypermethrin (Mm 415.0742 u) diluted with acetone at 100 g/ml was used to assign the peaks in mass chromatogram (m/z 163). Aliquots of cy- permethrin was added to the extracts of the leaves of Perilla frutescens at 1 g/ml and measured using HRMS and SRM. 2.4. GC/MS Condition GC/MS was carried out with an Agilent 7890A gas chromatograph (Agilent Technologies, USA) and a two- sector mass spectrometer composed of a magnetic sector and an electric sector: JMS-GCmateⅡ(JEOL, Japan). A HP-5MS fused-silica capillary column (0.25 mm i.d. × 30 m, Agilent Technologies, USA) was used for separa- tion. Each sample (1 l) was injected into a GC injector at 250℃ under splitless condition. The GC oven was programmed at a constant temperature increase of 10℃ /min from 50℃ to 200℃ after holding for 1.5 min at 50 ℃ followed by 5℃/min increase from 200℃ to 300℃. Electron ionization with 70 eV of ionization energy and 210℃ of ion source temperature was adopted on all MS analyses. LRMS in scan mode was carried out with a mass resolving power of 500 and a scan range of m/z 50-500 to analyze the standard solution of cypermethrin diluted with acetone (100 g/ml). HRMS in scan mode was carried out with a mass resolving power of 3500 and a scan range of m/z 140 - 185 to analyze the accurate mass of the fragment ion m/z 163 detected as the base peak in the LRMS. Perfluorokerosene (PFK) was simul- taneously analyzed as an internal reference to correct a mass drift. LRMS in selected ion monitoring (SIM) mode was carried out monitoring m/z 163.0076 with a mass resolving power of 500. HRMS applied SIM mode was carried out monitoring m/z 163.0076 with a mass resolving power of 3500. SRM was also performed with the instrument, which is the BE geometry mass spec- trometer, with the dissociation occurring in reaction re- gion, prior to the magnetic sector [10,11]. The monitored reaction was m/z 163 → 127, which was determined by applying a linked scan MS at constant B/E of m/z 163 (B and E are magnetic and electric sector field strength, respectively). 3. Results and Discussion 3.1. LRMS in scan Mode (Peak Assignment) The chromatogram of the cypermethrin standard solution (100 g/ml) obtained by GC/LRMS in scan mode is shown in Figure 1. Four peaks (peak # 1-4) attributed to the isomers of cypermethrin were detected at retention times of 30.87, 31.06, 31.20 and 31.28 min. The ratios of respective peak areas were 26.2, 29.1, 20.2 and 24.5 %. The 4 isomers of cypermethrin present very similar mass spectra and in Figure 2 is shown the mass spectrum of peak #1 as an example. Figure 3 shows the assignment of the molecular ion and the base peak ion into the mass spectrum. The molecular ion of cypermethrin was de- tected at m/z 415, the isotopic molecular ion attributed to 37Cl corresponds to m/z 417, the base peak [12C7 1H 9 35Cl2]+was detected at m/z 163 and the isotopic fragment ion [12C7 1H9 35Cl37Cl]+ was detected at m/z 165 showing about 64 % peak intensity of the base peak. Cyperme- thrin isomers were reported to be detected as four peaks [9]. These previous reports support the results in this study. 3.2. HRMS in scan Mode Using HLMS in scan mode, the accurately measured mass of the fragment ion [12C7 1H9 35Cl2]+was determined as 163.0072 u. The calculated mass of the fragment ion was 163.0076 u. The difference between the measured mass and the calculated mass was 0.0004 u. 3.3. LRMS in SIM Mode The chromatogram of perilla leaves extract spiked with cypermethrin at 1 g/ml is shown in Figure 4. A back- ground peak caused by the matrix overlapped with the Copyright © 2011 SciRes. AMPC 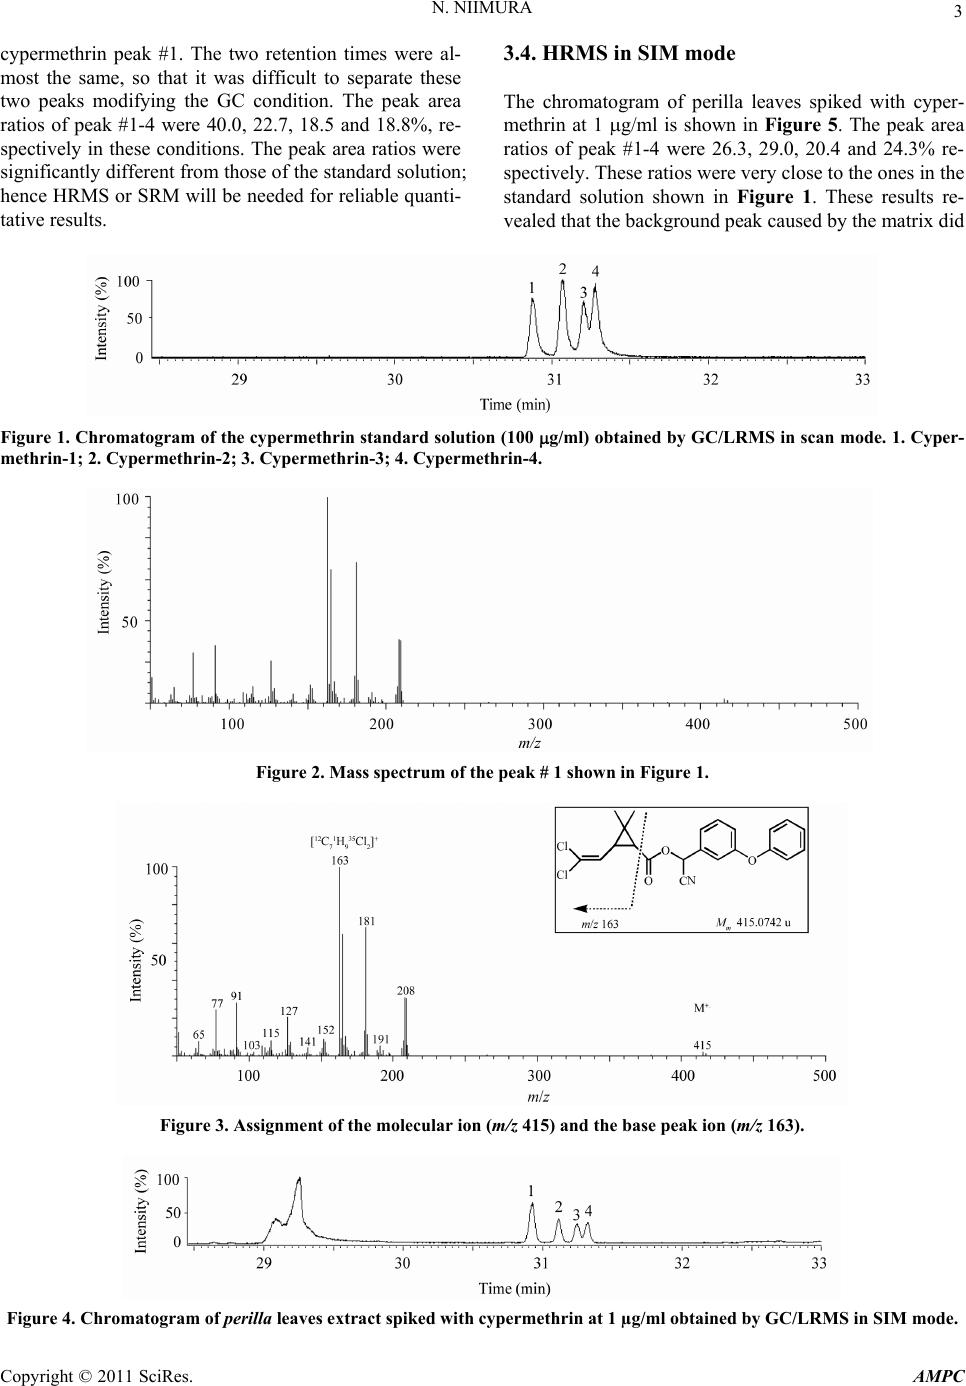 N. NIIMURA Copyright © 2011 SciRes. AMPC 3 3.4. HRMS in SIM mode cypermethrin peak #1. The two retention times were al- most the same, so that it was difficult to separate these two peaks modifying the GC condition. The peak area ratios of peak #1-4 were 40.0, 22.7, 18.5 and 18.8%, re- spectively in these conditions. The peak area ratios were significantly different from those of the standard solution; hence HRMS or SRM will be needed for reliable quanti- tative results. The chromatogram of perilla leaves spiked with cyper- methrin at 1 g/ml is shown in Figure 5. The peak area ratios of peak #1-4 were 26.3, 29.0, 20.4 and 24.3% re- spectively. These ratios were very close to the ones in the standard solution shown in Figure 1. These results re- vealed that the background peak caused by the matrix did Figure 1. Chromatogram of the cypermethrin standard solution (100 g/ml) obtained by GC/LRMS in scan mode. 1. Cyper- methrin-1; 2. Cypermethrin-2; 3. Cypermethrin-3; 4. Cypermethrin-4. Figure 2. Mass spectrum of the peak # 1 shown in Figure 1. Figure 3. Assignment of the molecular ion (m/z 415) and the base peak ion (m/z 163). Figure 4. Chromatogram of perilla leav es extract spiked wi th cypermethr in at 1 µg/ml obtained by GC/LRMS in SIM mode. 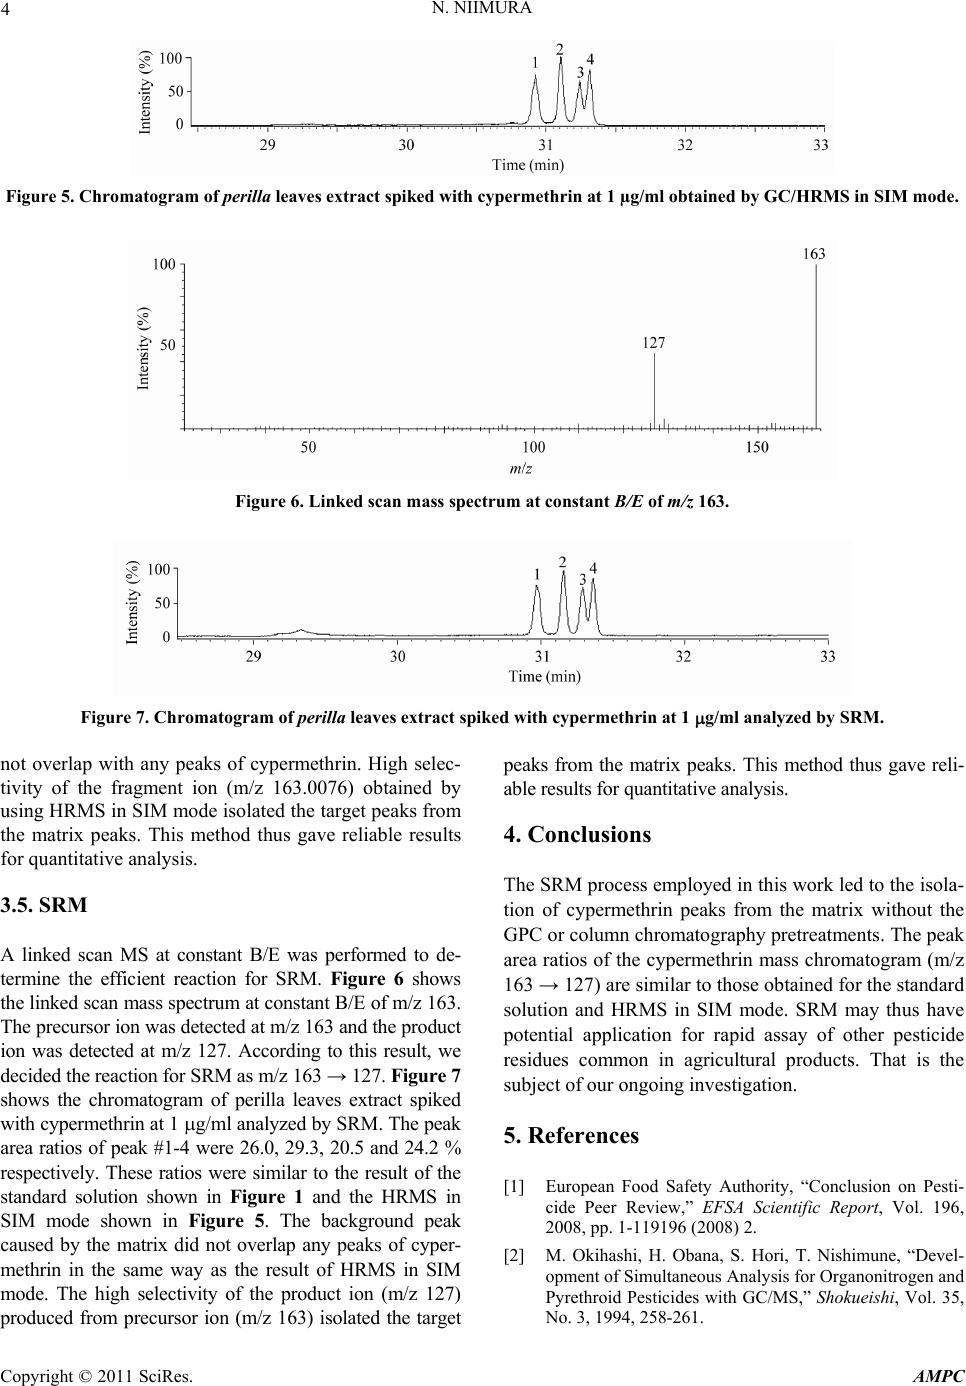 4 N. NIIMURA Figure 5. Chromatogram of perilla leav es extract spiked wi th cypermethr in at 1 µg/ml obtained by GC/HRMS in SIM mode. Figure 6. Linked scan mass spectrum at constant B/E of m/z 163. Figure 7. Chromatogram of perilla leaves extract spiked with cypermethrin at 1 g/ml analyzed by SRM. not overlap with any peaks of cypermethrin. High selec- tivity of the fragment ion (m/z 163.0076) obtained by using HRMS in SIM mode isolated the target peaks from the matrix peaks. This method thus gave reliable results for quantitative analysis. 3.5. SRM A linked scan MS at constant B/E was performed to de- termine the efficient reaction for SRM. Figure 6 shows the linked scan mass spectrum at constant B/E of m/z 163. The precursor ion was detected at m/z 163 and the product ion was detected at m/z 127. According to this result, we decided the reaction for SRM as m/z 163 → 127. Figure 7 shows the chromatogram of perilla leaves extract spiked with cypermethrin at 1 g/ml analyzed by SRM. The peak area ratios of peak #1-4 were 26.0, 29.3, 20.5 and 24.2 % respectively. These ratios were similar to the result of the standard solution shown in Figure 1 and the HRMS in SIM mode shown in Figure 5. The background peak caused by the matrix did not overlap any peaks of cyper- methrin in the same way as the result of HRMS in SIM mode. The high selectivity of the product ion (m/z 127) produced from precursor ion (m/z 163) isolated the target peaks from the matrix peaks. This method thus gave reli- able results for quantitative analysis. 4. Conclusions The SRM process employed in this work led to the isola- tion of cypermethrin peaks from the matrix without the GPC or column chromatography pretreatments. The peak area ratios of the cypermethrin mass chromatogram (m/z 163 → 127) are similar to those obtained for the standard solution and HRMS in SIM mode. SRM may thus have potential application for rapid assay of other pesticide residues common in agricultural products. That is the subject of our ongoing investigation. 5. References [1] European Food Safety Authority, “Conclusion on Pesti- cide Peer Review,” EFSA Scientific Report, Vol. 196, 2008, pp. 1-119196 (2008) 2. [2] M. Okihashi, H. Obana, S. Hori, T. Nishimune, “Devel- opment of Simultaneous Analysis for Organonitrogen and Pyrethroid Pesticides with GC/MS,” Shokueishi, Vol. 35, No. 3, 1994, 258-261. Copyright © 2011 SciRes. AMPC  N. NIIMURA 5 [3] Ch. Lentza-Rizos, E. J. Avramides and E. Visi, “Deter- mination of Residues of Endosulfan and Five Pyrethroid Insecticides in Virgin Olive Oil Using Gas Chromatog- raphy with Electron-capture Detection,” Journal of Chromatography A, Vol. 921, No. 2, 2001, pp. 297-304. doi:10.1016/S0021-9673(01)00874-3 [4] Y. Chatani and M. Komatsu, “Studies on Simultaneous Determination of Pesticide Residues in Tabacco Leaf by GC/MS,” Kyouto-Fu Hoken-Kan-kyou-Kenkyujo Nenpou, Vol.45, 2000, pp. 12-15. [5] J. Cai, B. Z. Liu, X. L. Zhu and Q. D. Su, “Determination of Pyrethroid Residues in Tobacco and Cigarette Smoke by Capillary Gas Chromatography,” Journal of Chroma- tography A, Vol. 964, No. 1-2, 2002, pp. 205-211. doi:10.1016/S0021-9673(02)00586-1 [6] C. Ferrer, M. J. Gomez, J. F. Garcia-Reyes, I. Ferrer, E. M. Thurman and A. R. Fernandes-Alba, “Determina- tion of Pesticide Residues in Olives and Olive Oil by Matrix Solid-Phase Dispersion Followed by Gas Chromatography/Mass Spectrometry and Liquid Chromatography/Tandem Mass Spectrometry,” Journal of Chromatography A, Vol. 1069, No. 2, 2005, pp. 183- 194. doi:10.1016/j.chroma.2005.02.015 [7] I. R. Pizzutti, R. J. J. Vreuls, A. de Kok, R. Roehrs, S. Martel, C. A. Friggi and R. Zanella, “Design of a Com- pressed Air Modulator to Be Used in Comprehensive Multidimensional Gas Chromatography and Its Applica- tion in the Determination of Pesticide Residues in Grapes,” Journal of Chromatography A, Vol. 1216, No. 15, 2009, pp. 3305-3311. doi:10.1016/j.chroma.2009.01.088 [8] A. Di Muccio, D. A. Barbini, T. Generali, P. Pelosi, A. Ausili, F. Vergori and I. Camoni, “Clean-up of Aqueous Acetone Vegetable Extracts by Solid-Matrix Partition for Pyrethroid Residue Determination by Gas Chromatogra- phy—Electron-capture Detection,” Journal of Chroma- tography A, Vol. 765, No. 1, 1997, pp. 39-49. [9] Y. Nakamura, Y. Tonogai, Y. Tsumura and Y. Ito, “De- termination of pyrethroid residues in vegetables, fruits, grains, beans and green tea leaves: applications to pyre- throid residue monitoring studies,” J. AOAC Interna- tional, Vol. 76, No. 6, 1993, pp. 1348-1361. [10] K. L. Busch, G. L. Glish and S. A. McLuckey, “Mass Spectrometry/Mass Spectrometry: Techniques and Ap- plications of Tandem Mass Spectrometry,” VCH, New York, 1988. [11] E. D. Hoffmann and V. Stroobant, “Mass Spectrometry: Principle and Applications,” 3rd Edition, John Wiley & Sons Ltd, Chichester, 2007. Copyright © 2011 SciRes. AMPC |