

Paper Menu >>
Journal Menu >>
 Optics and Photonics Journal, 2011, 1, 85-90 doi:10.4236/opj.2011.12014 Published Online June 2011 (http://www.SciRP.org/journal/opj/) Copyright © 2011 SciRes. OPJ An HC-PCF Fluorescence Spectrocopy for Detection of Microsphere Samples Based on Refractive Index Scaling Law Vengalathunadakal K. Shinoj1, Vadakke. M. Murukeshan1 1School of Mechanical and Aerospace Engineering, Nanyang Technological University, Singapore. E-mail: [email protected] Received April 13, 2011; revised May 15, 2011; accepted May 23, 2011 Abstract This paper illustrates an efficient fluorescence detection of micro particles using hollow-core photonic crys- tal fibers (HC-PCFs) by applying the refractive index (RI) scaling law. The variations in the central wave- length for different filling material indices are illustrated for most commonly available HC-PCFs that have cladding made of pure fused silica with array of air holes running along the entire length of the fiber. The proposed concept is verified by immobilizing fluorescent microsphere samples inside two HC-PCFs of dif- ferent central wavelengths and the quantification of fluorescence inside the fibers is performed through spec- troscopic analysis. The sensitivity has been compared for similar fiber with different dispersed media and different fibers with same dispersed medium. Keywords: Optical Fiber, Hollow-Core Photonic Crystal Fiber, Refractive Index Scaling, Fluorescence Spec- troscopy 1. Introduction It is reported that the detection sensitivity of small amount of biological threats can be enhanced with simple inex- pensive methods which can give brightest possible fluo- rescence for detection using high throughput suspension arrays [1,2]. Moreover, many biomolecules are not avail- able in large quantities which limit the usage of reagents in such a small environment. It is therefore important to de- velop optical elements or systems which can be made effi- cient and potent in small quantities and can be used re- peatedly. The use of optical fibers for various sensing purposes has been reported [3,4]. The emergence of mi- crostructured optical fibers (MOFs) opens up new oppor- tunities for novel fluorescent detection and relevant bio- sensor design, which can solve the problems encountered in conventional biosensors [5-7]. MOFs are characterized as having a plurality of air holes running along the entire length of the fiber [8]. The optical properties of this class of fibers are determined by their geometry, size, and rela- tive position of the air holes. Photonic crystal fibers (PCFs) are one of the most prominent MOFs that have emerged in recent years that could be engineered to have vastly dif- ferent properties compared to conventional fibers [9,10]. Its guiding mechanism is based on the photonic bandgap formed due to its high index contrast (commonly silica and air in optical region) and from the wavelength-scale microstructure. The mode propagation properties strongly depend on wavelength, which in turn depends on the de- sign, configuration and geometry of air holes [11]. Unlike conventional fibers, photonic crystal fibers are made of pure silica glass (SiO2) without any doping. Hence it is biocompatible and chemically inert [12]. Further, the cap- illary tubes present in the PCFs have a good surface- to-volume ratio. The PCF-based sensor hence utilizes the available sample volume much more efficiently. The hollow-core PCFs (HC-PCFs) are comprised of an air core with a cladding that consists of a two-dimensional (2-D) periodic array of air inclusions in silica [13]. As indicated by their name, HC-PCFs guide light in the air core within certain bandgaps, which manifest as transmis- sion windows in the transmission spectrum. The photonic bandgap (PBG) property of the fiber is a function of both its geometry and the refractive-index (RI) contrast [10,13]. The transmission bands, or transmission windows, of the HC-PCF is decided by the spacing between the holes of the capillaries (pitch), the hole diameters of the capillaries, and/or the air-filling content within the inner cladding. When the holey regions of HC-PCFs are filled with aque- ous solution, the transmission window shows a blue shift [14-18]. This approach is in analogous with the well- known scaling laws that describe the shift in the PBG edge 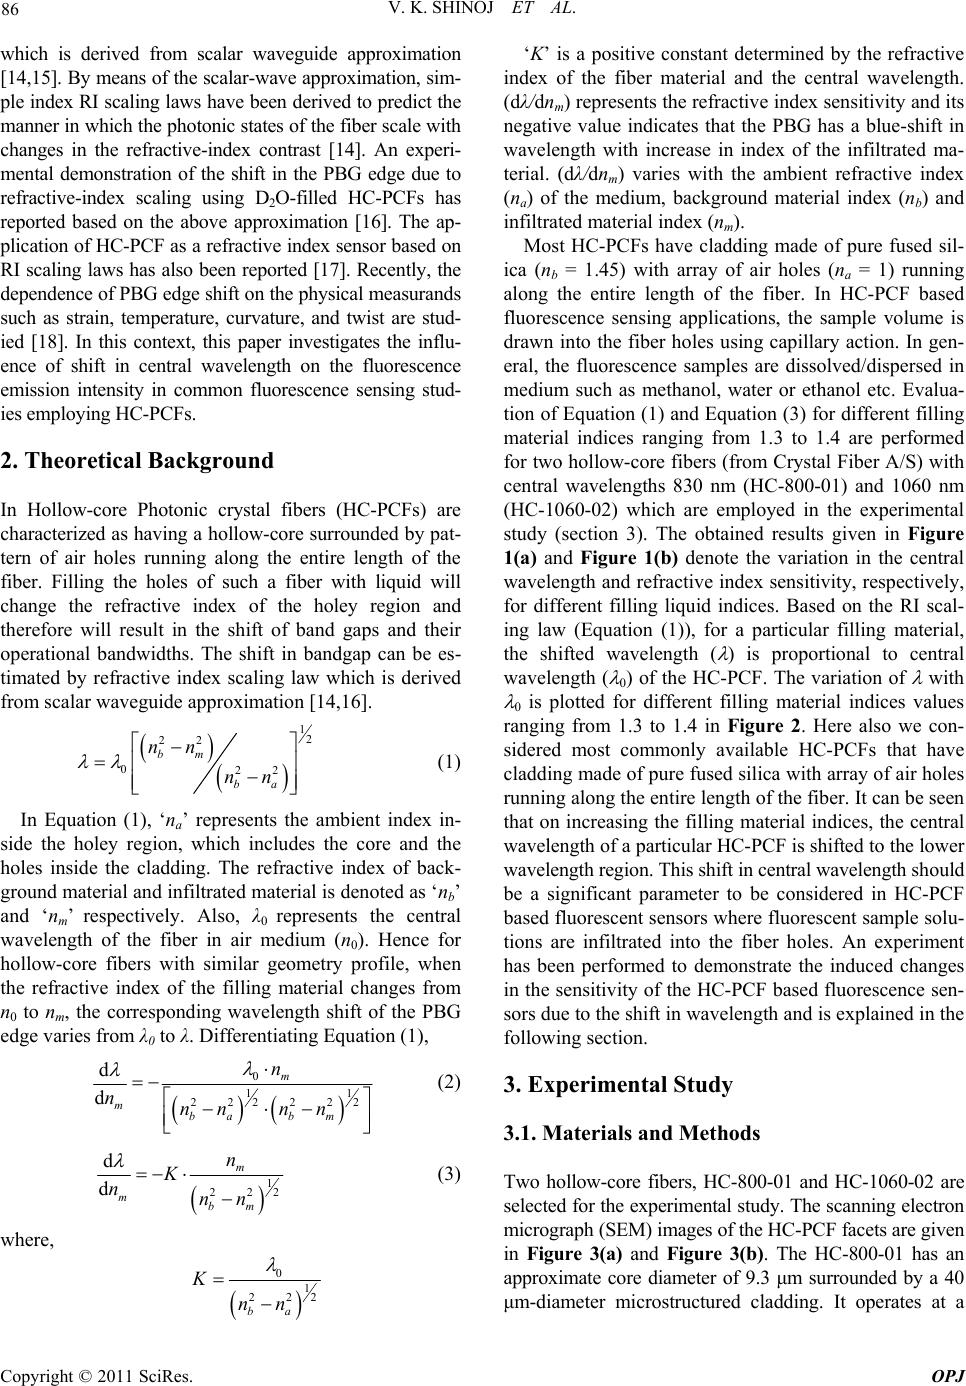 86 V. K. SHINOJ ET AL. which is derived from scalar waveguide approximation [14,15]. By means of the scalar-wave approximation, sim- ple index RI scaling laws have been derived to predict the manner in which the photonic states of the fiber scale with changes in the refractive-index contrast [14]. An experi- mental demonstration of the shift in the PBG edge due to refractive-index scaling using D2O-filled HC-PCFs has reported based on the above approximation [16]. The ap- plication of HC-PCF as a refractive index sensor based on RI scaling laws has also been reported [17]. Recently, the dependence of PBG edge shift on the physical measurands such as strain, temperature, curvature, and twist are stud- ied [18]. In this context, this paper investigates the influ- ence of shift in central wavelength on the fluorescence emission intensity in common fluorescence sensing stud- ies employing HC-PCFs. 2. Theoretical Background In Hollow-core Photonic crystal fibers (HC-PCFs) are characterized as having a hollow-core surrounded by pat- tern of air holes running along the entire length of the fiber. Filling the holes of such a fiber with liquid will change the refractive index of the holey region and therefore will result in the shift of band gaps and their operational bandwidths. The shift in bandgap can be es- timated by refractive index scaling law which is derived from scalar waveguide approximation [14,16]. 12 22 022 bm ba nn nn (1) In Equation (1), ‘na’ represents the ambient index in- side the holey region, which includes the core and the holes inside the cladding. The refractive index of back- ground material and infiltrated material is denoted as ‘nb’ and ‘nm’ respectively. Also, λ0 represents the central wavelength of the fiber in air medium (n0). Hence for hollow-core fibers with similar geometry profile, when the refractive index of the filling material changes from n0 to nm, the corresponding wavelength shift of the PBG edge varies from λ0 to λ. Differentiating Equation (1), 0 1 22 22 22 d d m m ba bm n nnn nn 1 (2) 1 22 2 d d m mbm n K nnn (3) where, 0 1 22 2 ba K nn ‘K’ is a positive constant determined by the refractive index of the fiber material and the central wavelength. (dλ/dnm) represents the refractive index sensitivity and its negative value indicates that the PBG has a blue-shift in wavelength with increase in index of the infiltrated ma- terial. (dλ/dnm) varies with the ambient refractive index (na) of the medium, background material index (nb) and infiltrated material index (nm). Most HC-PCFs have cladding made of pure fused sil- ica (nb = 1.45) with array of air holes (na = 1) running along the entire length of the fiber. In HC-PCF based fluorescence sensing applications, the sample volume is drawn into the fiber holes using capillary action. In gen- eral, the fluorescence samples are dissolved/dispersed in medium such as methanol, water or ethanol etc. Evalua- tion of Equation (1) and Equation (3) for different filling material indices ranging from 1.3 to 1.4 are performed for two hollow-core fibers (from Crystal Fiber A/S) with central wavelengths 830 nm (HC-800-01) and 1060 nm (HC-1060-02) which are employed in the experimental study (section 3). The obtained results given in Figure 1(a) and Figure 1(b) denote the variation in the central wavelength and refractive index sensitivity, respectively, for different filling liquid indices. Based on the RI scal- ing law (Equation (1)), for a particular filling material, the shifted wavelength ( ) is proportional to central wavelength ( 0) of the HC-PCF. The variation of with 0 is plotted for different filling material indices values ranging from 1.3 to 1.4 in Figure 2. Here also we con- sidered most commonly available HC-PCFs that have cladding made of pure fused silica with array of air holes running along the entire length of the fiber. It can be seen that on increasing the filling material indices, the central wavelength of a particular HC-PCF is shifted to the lower wavelength region. This shift in central wavelength should be a significant parameter to be considered in HC-PCF based fluorescent sensors where fluorescent sample solu- tions are infiltrated into the fiber holes. An experiment has been performed to demonstrate the induced changes in the sensitivity of the HC-PCF based fluorescence sen- sors due to the shift in wavelength and is explained in the following section. 3. Experimental Study 3.1. Materials and Methods Two hollow-core fibers, HC-800-01 and HC-1060-02 are selected for the experimental study. The scanning electron micrograph (SEM) images of the HC-PCF facets are given in Figure 3(a) and Figure 3(b). The HC-800-01 has an approximate core diameter of 9.3 μm surrounded by a 40 μm-diameter microstructured cladding. It operates at a Copyright © 2011 SciRes. OPJ 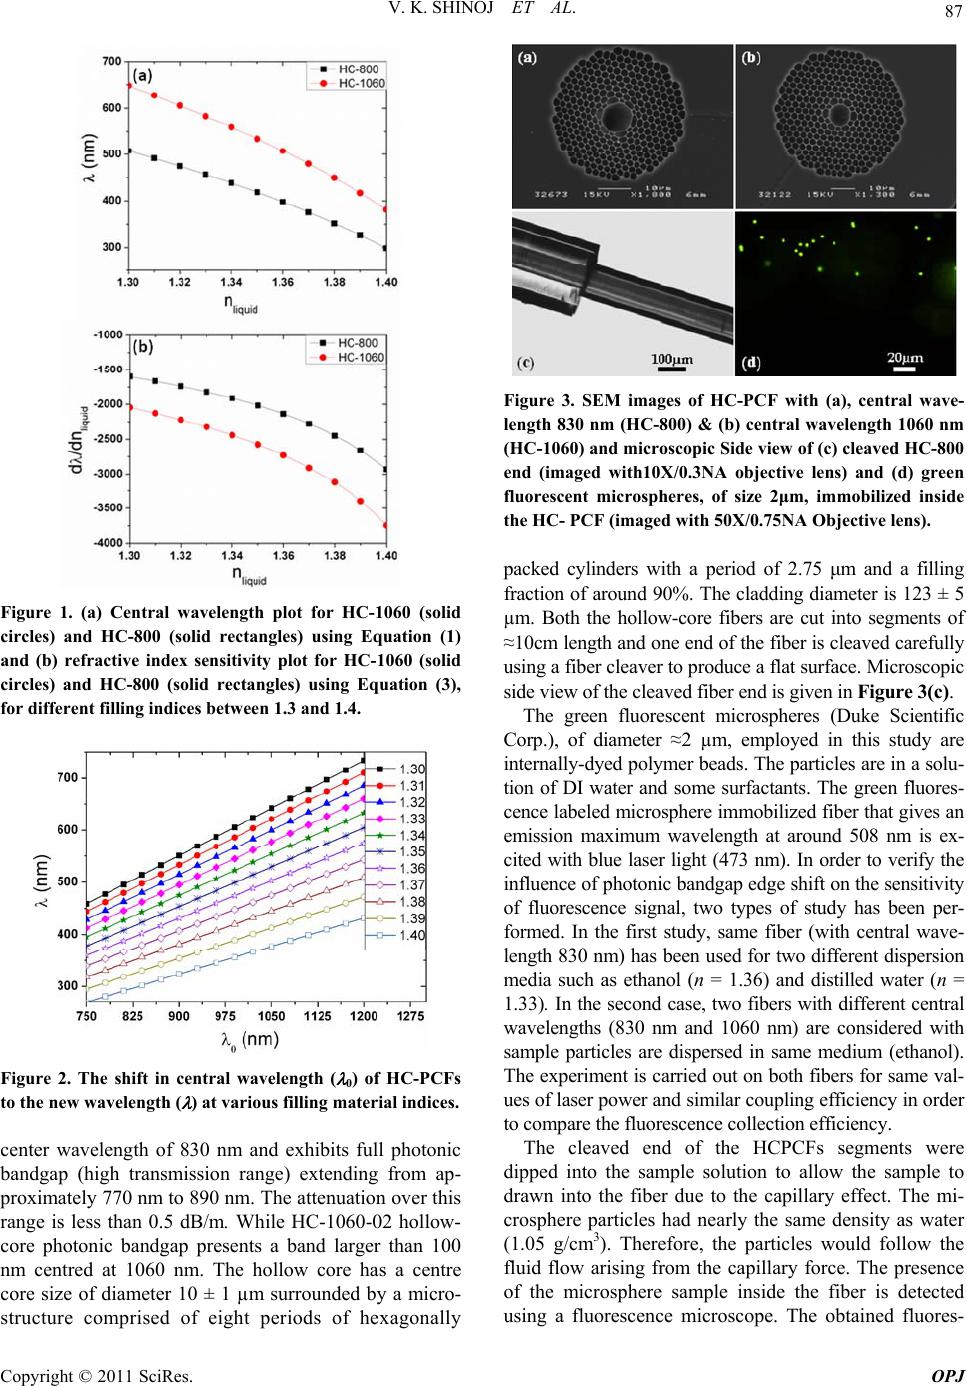 V. K. SHINOJ ET AL. 87 Figure 1. (a) Central wavelength plot for HC-1060 (solid circles) and HC-800 (solid rectangles) using Equation (1) and (b) refractive index sensitivity plot for HC-1060 (solid circles) and HC-800 (solid rectangles) using Equation (3), for different filling indices between 1.3 and 1.4. Figure 2. The shift in central wavelength ( 0) of HC-PCFs to the new wavelength ( ) at various filling material indices. center wavelength of 830 nm and exhibits full photonic bandgap (high transmission range) extending from ap- proximately 770 nm to 890 nm. The attenuation over this range is less than 0.5 dB/m. While HC-1060-02 hollow- core photonic bandgap presents a band larger than 100 nm centred at 1060 nm. The hollow core has a centre core size of diameter 10 ± 1 µm surrounded by a micro- structure comprised of eight periods of hexagonally Figure 3. SEM images of HC-PCF with (a), central wave- length 830 nm (HC-800) & (b) central wavelength 1060 nm (HC-1060) and microscopic Side view of (c) cleaved HC-800 end (imaged with10X/0.3NA objective lens) and (d) green fluorescent microspheres, of size 2μm, immobilized inside the HC- PCF (imaged with 50X/0.75NA Objective lens). packed cylinders with a period of 2.75 μm and a filling fraction of around 90%. The cladding diameter is 123 ± 5 µm. Both the hollow-core fibers are cut into segments of ≈10cm length and one end of the fiber is cleaved carefully using a fiber cleaver to produce a flat surface. Microscopic side view of the cleaved fiber end is given in Figure 3(c). The green fluorescent microspheres (Duke Scientific Corp.), of diameter ≈2 µm, employed in this study are internally-dyed polymer beads. The particles are in a solu- tion of DI water and some surfactants. The green fluores- cence labeled microsphere immobilized fiber that gives an emission maximum wavelength at around 508 nm is ex- cited with blue laser light (473 nm). In order to verify the influence of photonic bandgap edge shift on the sensitivity of fluorescence signal, two types of study has been per- formed. In the first study, same fiber (with central wave- length 830 nm) has been used for two different dispersion media such as ethanol (n = 1.36) and distilled water (n = 1.33). In the second case, two fibers with different central wavelengths (830 nm and 1060 nm) are considered with sample particles are dispersed in same medium (ethanol). The experiment is carried out on both fibers for same val- ues of laser power and similar coupling efficiency in order to compare the fluorescence collection efficiency. The cleaved end of the HCPCFs segments were dipped into the sample solution to allow the sample to drawn into the fiber due to the capillary effect. The mi- crosphere particles had nearly the same density as water (1.05 g/cm3). Therefore, the particles would follow the fluid flow arising from the capillary force. The presence of the microsphere sample inside the fiber is detected using a fluorescence microscope. The obtained fluores- Copyright © 2011 SciRes. OPJ 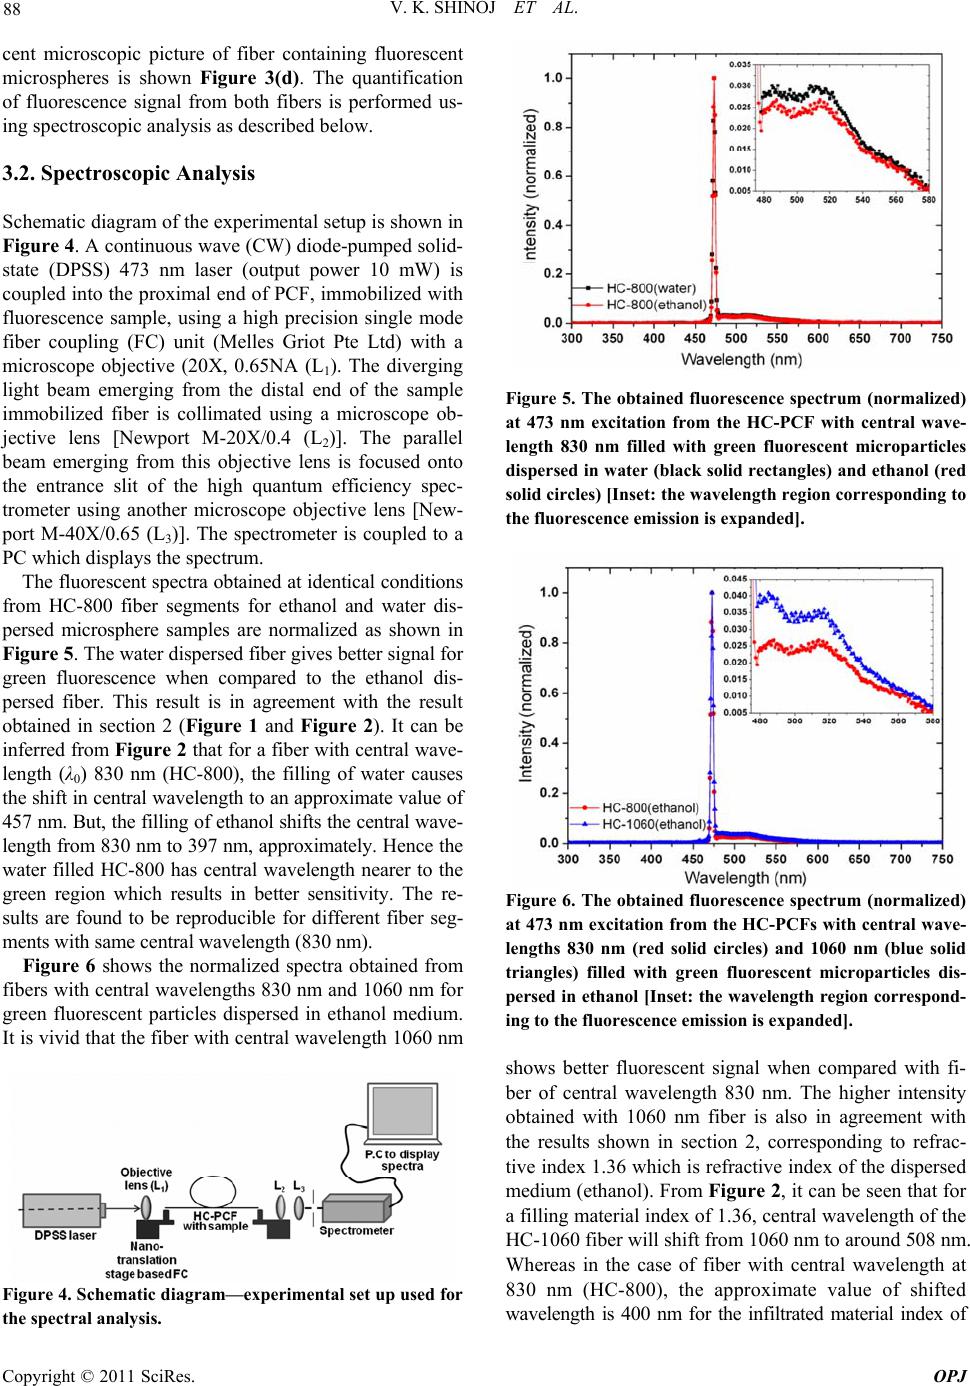 88 V. K. SHINOJ ET AL. cent microscopic picture of fiber containing fluorescent microspheres is shown Figure 3(d). The quantification of fluorescence signal from both fibers is performed us- ing spectroscopic analysis as described below. 3.2. Spectroscopic Analysis Schematic diagram of the experimental setup is shown in Figure 4. A continuous wave (CW) diode-pumped solid- state (DPSS) 473 nm laser (output power 10 mW) is coupled into the proximal end of PCF, immobilized with fluorescence sample, using a high precision single mode fiber coupling (FC) unit (Melles Griot Pte Ltd) with a microscope objective (20X, 0.65NA (L1). The diverging light beam emerging from the distal end of the sample immobilized fiber is collimated using a microscope ob- jective lens [Newport M-20X/0.4 (L2)]. The parallel beam emerging from this objective lens is focused onto the entrance slit of the high quantum efficiency spec- trometer using another microscope objective lens [New- port M-40X/0.65 (L3)]. The spectrometer is coupled to a PC which displays the spectrum. The fluorescent spectra obtained at identical conditions from HC-800 fiber segments for ethanol and water dis- persed microsphere samples are normalized as shown in Figure 5. The water dispersed fiber gives better signal for green fluorescence when compared to the ethanol dis- persed fiber. This result is in agreement with the result obtained in section 2 (Figure 1 and Figure 2). It can be inferred from Figure 2 that for a fiber with central wave- length (λ0) 830 nm (HC-800), the filling of water causes the shift in central wavelength to an approximate value of 457 nm. But, the filling of ethanol shifts the central wave- length from 830 nm to 397 nm, approximately. Hence the water filled HC-800 has central wavelength nearer to the green region which results in better sensitivity. The re- sults are found to be reproducible for different fiber seg- ments with same central wavelength (830 nm). Figure 6 shows the normalized spectra obtained from fibers with central wavelengths 830 nm and 1060 nm for green fluorescent particles dispersed in ethanol medium. It is vivid that the fiber with central wavelength 1060 nm Figure 4. Schematic diagram—experimental set up used for the spectral analysis. Figure 5. The obtained fluorescence spectrum (normalized) at 473 nm excitation from the HC-PCF with central wave- length 830 nm filled with green fluorescent microparticles dispersed in water (black solid rectangles) and ethanol (red solid circles) [Inset: the wavelength region corresponding to the fluorescence emission is expanded]. Figure 6. The obtained fluorescence spectrum (normalized) at 473 nm excitation from the HC-PCFs with central wave- lengths 830 nm (red solid circles) and 1060 nm (blue solid triangles) filled with green fluorescent microparticles dis- persed in ethanol [Inset: the wavelength region correspond- ing to the fluorescence emission is expanded]. shows better fluorescent signal when compared with fi- ber of central wavelength 830 nm. The higher intensity obtained with 1060 nm fiber is also in agreement with the results shown in section 2, corresponding to refrac- tive index 1.36 which is refractive index of the dispersed medium (ethanol). From Figure 2, it can be seen that for a filling material index of 1.36, central wavelength of the HC-1060 fiber will shift from 1060 nm to around 508 nm. Whereas in the case of fiber with central wavelength at 830 nm (HC-800), the approximate value of shifted wavelength is 400 nm for the infiltrated material index of Copyright © 2011 SciRes. OPJ 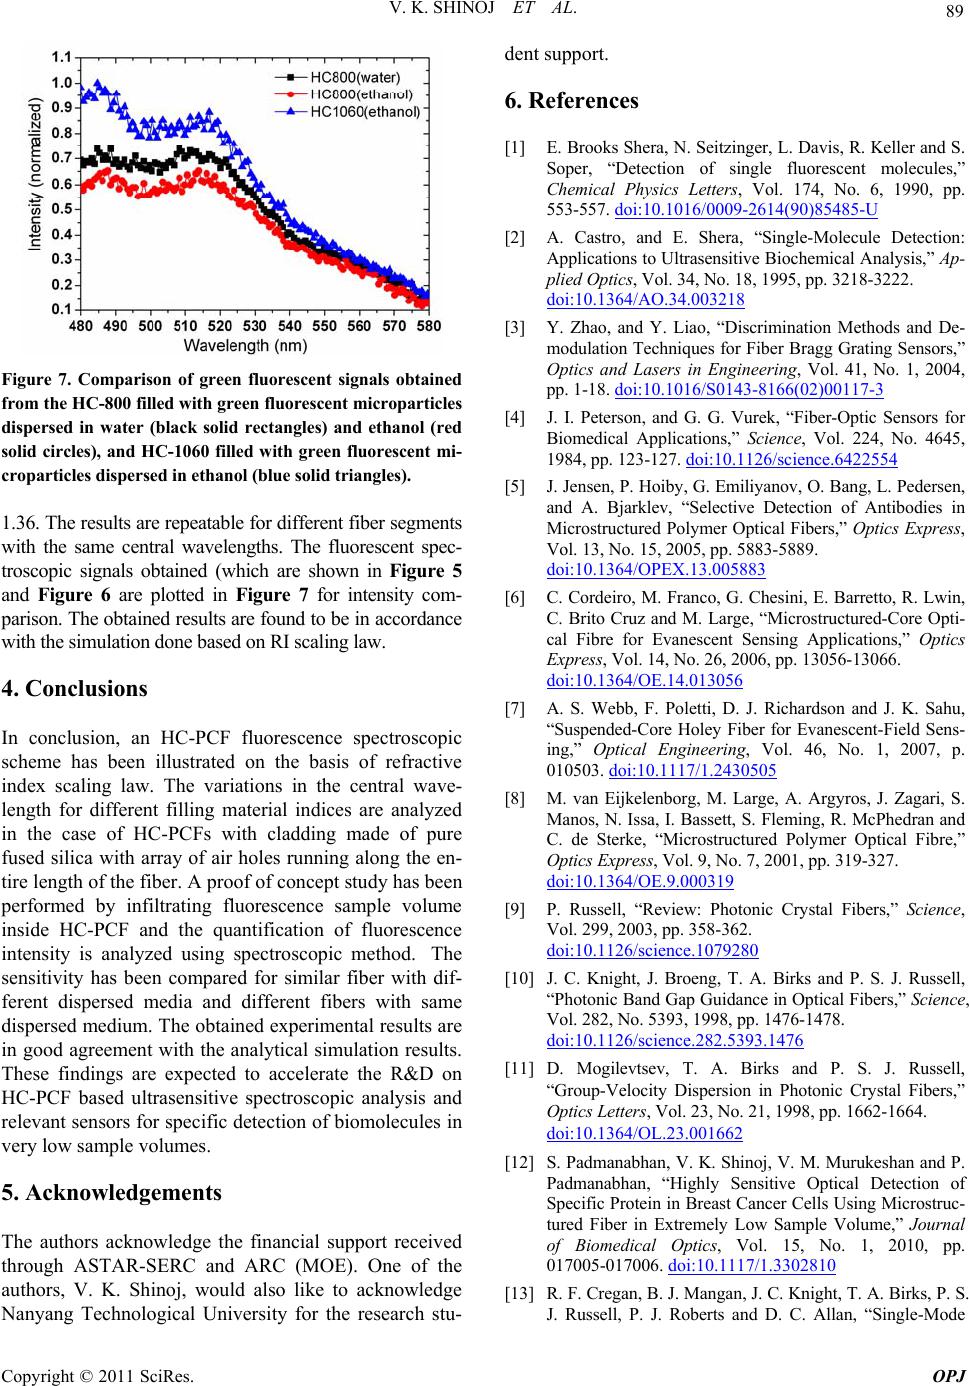 V. K. SHINOJ ET AL. 89 Figure 7. Comparison of green fluorescent signals obtained from the HC-800 filled with green fluorescent microparticles dispersed in water (black solid rectangles) and ethanol (red solid circles), and HC-1060 filled with green fluorescent mi- croparticles dispersed in ethanol (blue solid triangles). 1.36. The results are repeatable for different fiber segments with the same central wavelengths. The fluorescent spec- troscopic signals obtained (which are shown in Figure 5 and Figure 6 are plotted in Figure 7 for intensity com- parison. The obtained results are found to be in accordance with the simulation done based on RI scaling law. 4. Conclusions In conclusion, an HC-PCF fluorescence spectroscopic scheme has been illustrated on the basis of refractive index scaling law. The variations in the central wave- length for different filling material indices are analyzed in the case of HC-PCFs with cladding made of pure fused silica with array of air holes running along the en- tire length of the fiber. A proof of concept study has been performed by infiltrating fluorescence sample volume inside HC-PCF and the quantification of fluorescence intensity is analyzed using spectroscopic method. The sensitivity has been compared for similar fiber with dif- ferent dispersed media and different fibers with same dispersed medium. The obtained experimental results are in good agreement with the analytical simulation results. These findings are expected to accelerate the R&D on HC-PCF based ultrasensitive spectroscopic analysis and relevant sensors for specific detection of biomolecules in very low sample volumes. 5. Acknowledgements The authors acknowledge the financial support received through ASTAR-SERC and ARC (MOE). One of the authors, V. K. Shinoj, would also like to acknowledge Nanyang Technological University for the research stu- dent support. 6. References [1] E. Brooks Shera, N. Seitzinger, L. Davis, R. Keller and S. Soper, “Detection of single fluorescent molecules,” Chemical Physics Letters, Vol. 174, No. 6, 1990, pp. 553-557. doi:10.1016/0009-2614(90)85485-U [2] A. Castro, and E. Shera, “Single-Molecule Detection: Applications to Ultrasensitive Biochemical Analysis,” Ap- plied Optics, Vol. 34, No. 18, 1995, pp. 3218-3222. doi:10.1364/AO.34.003218 [3] Y. Zhao, and Y. Liao, “Discrimination Methods and De- modulation Techniques for Fiber Bragg Grating Sensors,” Optics and Lasers in Engineering, Vol. 41, No. 1, 2004, pp. 1-18. doi:10.1016/S0143-8166(02)00117-3 [4] J. I. Peterson, and G. G. Vurek, “Fiber-Optic Sensors for Biomedical Applications,” Science, Vol. 224, No. 4645, 1984, pp. 123-127. doi:10.1126/science.6422554 [5] J. Jensen, P. Hoiby, G. Emiliyanov, O. Bang, L. Pedersen, and A. Bjarklev, “Selective Detection of Antibodies in Microstructured Polymer Optical Fibers,” Optics Express, Vol. 13, No. 15, 2005, pp. 5883-5889. doi:10.1364/OPEX.13.005883 [6] C. Cordeiro, M. Franco, G. Chesini, E. Barretto, R. Lwin, C. Brito Cruz and M. Large, “Microstructured-Core Opti- cal Fibre for Evanescent Sensing Applications,” Optics Express, Vol. 14, No. 26, 2006, pp. 13056-13066. doi:10.1364/OE.14.013056 [7] A. S. Webb, F. Poletti, D. J. Richardson and J. K. Sahu, “Suspended-Core Holey Fiber for Evanescent-Field Sens- ing,” Optical Engineering, Vol. 46, No. 1, 2007, p. 010503. doi:10.1117/1.2430505 [8] M. van Eijkelenborg, M. Large, A. Argyros, J. Zagari, S. Manos, N. Issa, I. Bassett, S. Fleming, R. McPhedran and C. de Sterke, “Microstructured Polymer Optical Fibre,” Optics Express, Vol. 9, No. 7, 2001, pp. 319-327. doi:10.1364/OE.9.000319 [9] P. Russell, “Review: Photonic Crystal Fibers,” Science, Vol. 299, 2003, pp. 358-362. doi:10.1126/science.1079280 [10] J. C. Knight, J. Broeng, T. A. Birks and P. S. J. Russell, “Photonic Band Gap Guidance in Optical Fibers,” Science, Vol. 282, No. 5393, 1998, pp. 1476-1478. doi:10.1126/science.282.5393.1476 [11] D. Mogilevtsev, T. A. Birks and P. S. J. Russell, “Group-Velocity Dispersion in Photonic Crystal Fibers,” Optics Letters, Vol. 23, No. 21, 1998, pp. 1662-1664. doi:10.1364/OL.23.001662 [12] S. Padmanabhan, V. K. Shinoj, V. M. Murukeshan and P. Padmanabhan, “Highly Sensitive Optical Detection of Specific Protein in Breast Cancer Cells Using Microstruc- tured Fiber in Extremely Low Sample Volume,” Journal of Biomedical Optics, Vol. 15, No. 1, 2010, pp. 017005-017006. doi:10.1117/1.3302810 [13] R. F. Cregan, B. J. Mangan, J. C. Knight, T. A. Birks, P. S. J. Russell, P. J. Roberts and D. C. Allan, “Single-Mode Copyright © 2011 SciRes. OPJ 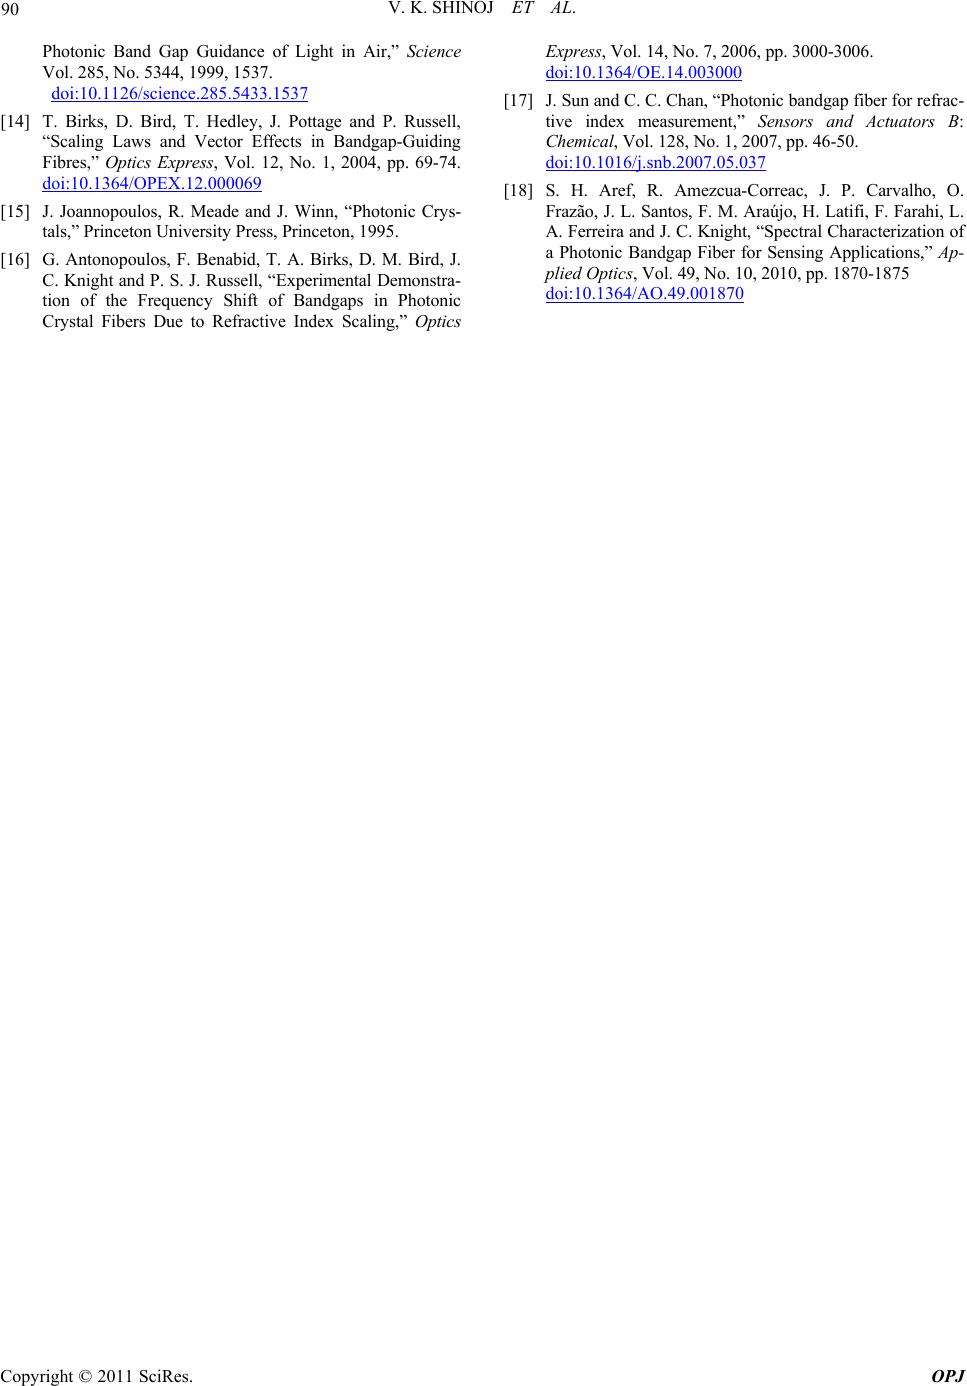 V. K. SHINOJ ET AL. Copyright © 2011 SciRes. OPJ 90 Photonic Band Gap Guidance of Light in Air,” Science Vol. 285, No. 5344, 1999, 1537. doi:10.1126/science.285.5433.1537 [14] T. Birks, D. Bird, T. Hedley, J. Pottage and P. Russell, “Scaling Laws and Vector Effects in Bandgap-Guiding Fibres,” Optics Express, Vol. 12, No. 1, 2004, pp. 69-74. doi:10.1364/OPEX.12.000069 [15] J. Joannopoulos, R. Meade and J. Winn, “Photonic Crys- tals,” Princeton University Press, Princeton, 1995. [16] G. Antonopoulos, F. Benabid, T. A. Birks, D. M. Bird, J. C. Knight and P. S. J. Russell, “Experimental Demonstra- tion of the Frequency Shift of Bandgaps in Photonic Crystal Fibers Due to Refractive Index Scaling,” Optics Express, Vol. 14, No. 7, 2006, pp. 3000-3006. doi:10.1364/OE.14.003000 [17] J. Sun and C. C. Chan, “Photonic bandgap fiber for refrac- tive index measurement,” Sensors and Actuators B: Chemical, Vol. 128, No. 1, 2007, pp. 46-50. doi:10.1016/j.snb.2007.05.037 [18] S. H. Aref, R. Amezcua-Correac, J. P. Carvalho, O. Frazão, J. L. Santos, F. M. Araújo, H. Latifi, F. Farahi, L. A. Ferreira and J. C. Knight, “Spectral Characterization of a Photonic Bandgap Fiber for Sensing Applications,” Ap- plied Optics, Vol. 49, No. 10, 2010, pp. 1870-1875 doi:10.1364/AO.49.001870 |