

Paper Menu >>
Journal Menu >>
 Creative Education 2011. Vol.2, No.2, 142-147 Copyright © 2011 SciRes. DOI:10.4236/ce.2011.22020 Construction and Validation of Self-Management Scale for Undergraduate Students* Gang Xue1, Xiaomin Sun2# 1Department of Public Administration, Chinese Academy of Governance, Beijing, China; 2School of Psychology, Beijing Key Lab of Applied Experimental Psychology, Beijing Normal University, Beijing, China. Email: [email protected] Received May 22nd, 2011; revised June 10th, 2011; accepted June 16th, 2011. This study developed a scale to assess undergraduate students’ self-management ability in daily life. Forty items about self-management on time, goal, emotions and personal relationships were generated for the draft scale. Content review panel deleted seven items. In Study 1522 Chinese undergraduate students took the test. Explora- tory factor analysis and item analysis on the first half 261 cases deleted 6 items. Confirmatory factor analysis further revised the model and resulted in a two-factor Self-Management Scale, consisting of 21 items. Cross-validation on the second half 261 cases also verified the scale’s structural validity. In Study 2, responses from 374 undergraduate students were used to examine the reliability and criterion-related validity of the scale. The internal consistency reliability of the scale was 0.86. Relationship management showed good crite- rion-related validity, while the validity of performance management needs further examination. Keywords: Self-Management, Social Cognitive Theory Introduction How well people manage themselves largely determines the quality of their daily life and personal achievement. For under- graduate students, good self-management has important impli- cation for both their study and future development. However, there are substantial individual differences in the ability to ap- ply self-management strategies. Therefore, to improve under- graduate students’ self-management ability, the first step is to develop a reliable and valid tool to assess this variability in self-management. This study was an attempt to develop a tool to measure how undergraduate students manage themselves in daily life. There are several terms related to the notion of self-mana- gement in the literature. These include self-control, self-regu- lation, self-management and self-direction. Each implies that the individual uses a set of skills and methods to balance among aspects of life and to achieve personal goals. However, there are differences among these definitions. Specifically, self-con- trol puts more emphasis on inhibiting undesirable impulse, behaviors, and emotions (Rude, 1989). The definitions of self- regulation, self-management, and self-direction are not exactly the same, but they all represent the process by which individu- als actively apply a set of cognitive and behavioral strategies to guide their goal-directed activities over time and across chang- ing environments (Frayne & Geringer, 2000; Kahn, 1976; Ka- roly, 1993; Manz, 1986; Watson & Roland, 1993). To avoid the confusion resulting from the interchangeable uses of these terms, Mahoney suggested using “self-management” as a um- brella term for all kinds of self-regulated behaviors (Mahoney, 1972). For the sake of clarity, the current study used self-mana- gement as the only term to describe the process of actively utilizing cognitive and behavioral principles to maintain bal- ance in life and to pursue performance goals. As Rosenbaum (1980) points out, there are significant indi- vidual differences in how well people can manage themselves. Researchers have been endeavoring to develop measures to assess self-management on various aspects. In the clinical area, Rosenbaum’s Self-Control Schedule (SCS) (Rosenbaum, 1980) has received the most attention. It measures how individuals control their behavioral problems. Redden (1983) examined its structural validity and gave a six-factor model, with slight difference between females and males. The five common factors for both subject groups are planful behavior, mood control, control of unwanted thoughts, pain control, and delay of immediate gratification. The sixth factor is impulse control for males and personal efficacy for females. Among these six factors, planful behavior accounts for almost half of the variance. Furthermore, SCS has been chiefly used in studies on depression (Rude, 1989). Its subscales’ in- ternal consistency coefficients were between 0.78 - 0.80 (Red- den, et al., 1983; Richards, 1985). In addition to Rosenbaum’s SCS, there are several other self-management scales published in the clinical literature. These include Rehm’s Self-Control Questionnaire (SCQ) (Rehm, Fuchs, Roth, Kornblith, & Ro- mano, 1979), the Cognitive Self-Management (CSM) (Rude, 1986) and Brandon’s Self-Control Questionnaire (SCQ) (Brandon, Oescher, & Loftin, 1990). Rehm’s SCQ and Rude’s CSM chiefly measure the cognitive aspect of self-management, e.g., individual’s attitudes, beliefs, and self-talk. Brandon’s SCQ puts too much emphasis on health behaviors like eating and exercise. Furthermore, the above three scales have been used on people with chronic diseases and behavior problems. *The authors would like to acknowledge the support of the Humanities and Social Sciences Foundation for Youth Scholars of Ministry of Education o f China for the contract number of 08JCXLX001. 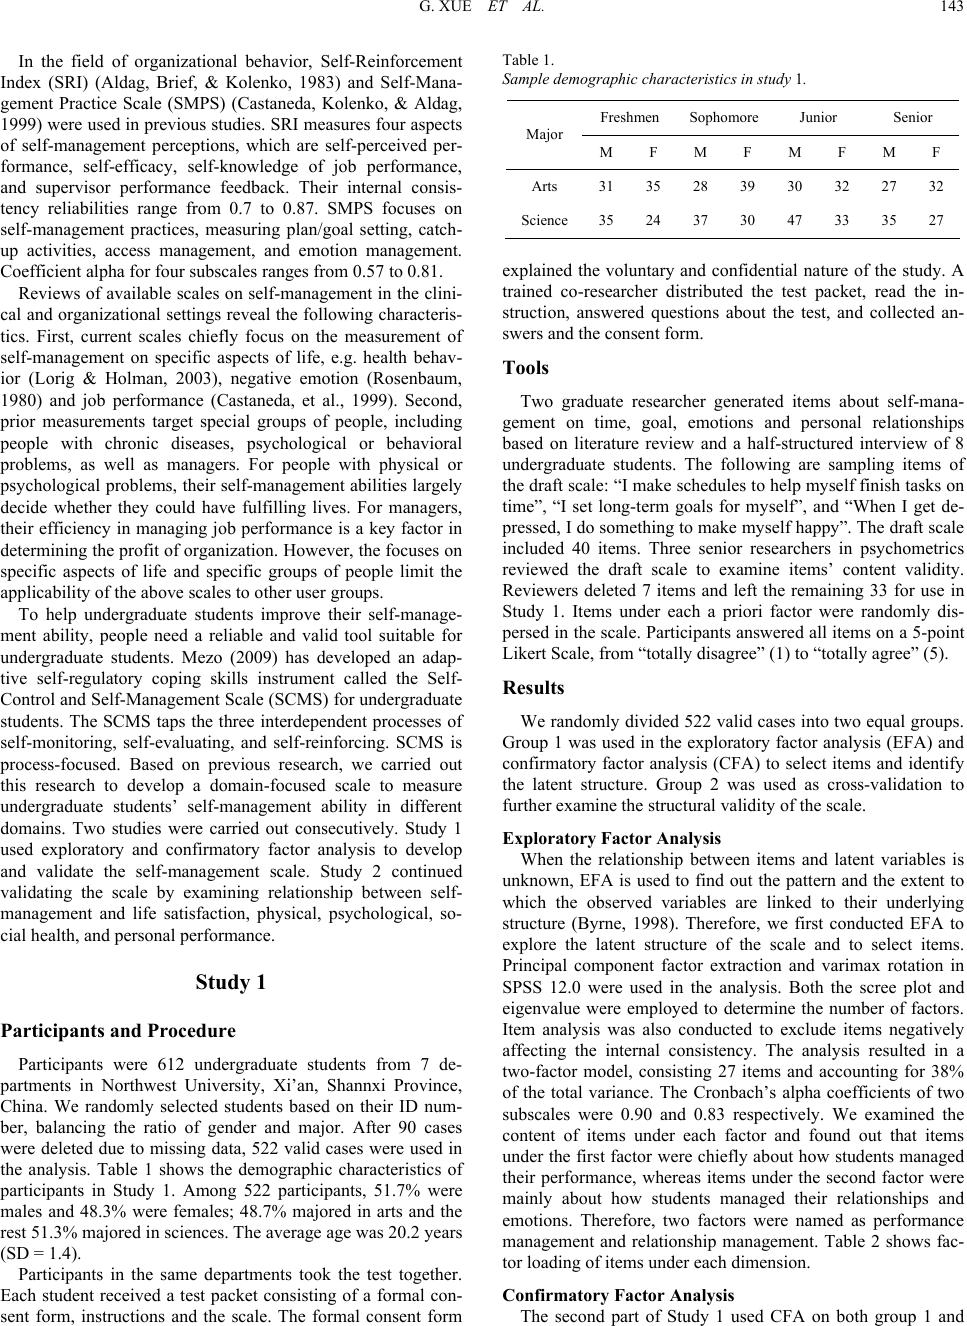 G. XUE ET AL. 143 In the field of organizational behavior, Self-Reinforcement Index (SRI) (Aldag, Brief, & Kolenko, 1983) and Self-Mana- gement Practice Scale (SMPS) (Castaneda, Kolenko, & Aldag, 1999) were used in previous studies. SRI measures four aspects of self-management perceptions, which are self-perceived per- formance, self-efficacy, self-knowledge of job performance, and supervisor performance feedback. Their internal consis- tency reliabilities range from 0.7 to 0.87. SMPS focuses on self-management practices, measuring plan/goal setting, catch- up activities, access management, and emotion management. Coefficient alpha for four subscales ranges from 0.57 to 0.81. Reviews of available scales on self-management in the clini- cal and organizational settings reveal the following characteris- tics. First, current scales chiefly focus on the measurement of self-management on specific aspects of life, e.g. health behav- ior (Lorig & Holman, 2003), negative emotion (Rosenbaum, 1980) and job performance (Castaneda, et al., 1999). Second, prior measurements target special groups of people, including people with chronic diseases, psychological or behavioral problems, as well as managers. For people with physical or psychological problems, their self-management abilities largely decide whether they could have fulfilling lives. For managers, their efficiency in managing job performance is a key factor in determining the profit of organization. However, the focuses on specific aspects of life and specific groups of people limit the applicability of the above scales to other user groups. To help undergraduate students improve their self-manage- ment ability, people need a reliable and valid tool suitable for undergraduate students. Mezo (2009) has developed an adap- tive self-regulatory coping skills instrument called the Self- Control and Self-Management Scale (SCMS) for undergraduate students. The SCMS taps the three interdependent processes of self-monitoring, self-evaluating, and self-reinforcing. SCMS is process-focused. Based on previous research, we carried out this research to develop a domain-focused scale to measure undergraduate students’ self-management ability in different domains. Two studies were carried out consecutively. Study 1 used exploratory and confirmatory factor analysis to develop and validate the self-management scale. Study 2 continued validating the scale by examining relationship between self- management and life satisfaction, physical, psychological, so- cial health, and personal performance. Study 1 Participants and Procedure Participants were 612 undergraduate students from 7 de- partments in Northwest University, Xi’an, Shannxi Province, China. We randomly selected students based on their ID num- ber, balancing the ratio of gender and major. After 90 cases were deleted due to missing data, 522 valid cases were used in the analysis. Table 1 shows the demographic characteristics of participants in Study 1. Among 522 participants, 51.7% were males and 48.3% were females; 48.7% majored in arts and the rest 51.3% majored in sciences. The average age was 20.2 years (SD = 1.4). Participants in the same departments took the test together. Each student received a test packet consisting of a formal con- sent form, instructions and the scale. The formal consent form Table 1. Sample demographic characteristics in study 1. Freshmen Sophomore Junior Senior Major M F M F M F M F Arts 31 35 28 39 30 32 27 32 Science35 24 37 30 47 33 35 27 explained the voluntary and confidential nature of the study. A trained co-researcher distributed the test packet, read the in- struction, answered questions about the test, and collected an- swers and the consent form. Tools Two graduate researcher generated items about self-mana- gement on time, goal, emotions and personal relationships based on literature review and a half-structured interview of 8 undergraduate students. The following are sampling items of the draft scale: “I make schedules to help myself finish tasks on time”, “I set long-term goals for myself”, and “When I get de- pressed, I do something to make myself happy”. The draft scale included 40 items. Three senior researchers in psychometrics reviewed the draft scale to examine items’ content validity. Reviewers deleted 7 items and left the remaining 33 for use in Study 1. Items under each a priori factor were randomly dis- persed in the scale. Participants answered all items on a 5-point Likert Scale, from “totally disagree” (1) to “totally agree” (5). Results We randomly divided 522 valid cases into two equal groups. Group 1 was used in the exploratory factor analysis (EFA) and confirmatory factor analysis (CFA) to select items and identify the latent structure. Group 2 was used as cross-validation to further examine the structural validity of the scale. Exploratory Factor Analysis When the relationship between items and latent variables is unknown, EFA is used to find out the pattern and the extent to which the observed variables are linked to their underlying structure (Byrne, 1998). Therefore, we first conducted EFA to explore the latent structure of the scale and to select items. Principal component factor extraction and varimax rotation in SPSS 12.0 were used in the analysis. Both the scree plot and eigenvalue were employed to determine the number of factors. Item analysis was also conducted to exclude items negatively affecting the internal consistency. The analysis resulted in a two-factor model, consisting 27 items and accounting for 38% of the total variance. The Cronbach’s alpha coefficients of two subscales were 0.90 and 0.83 respectively. We examined the content of items under each factor and found out that items under the first factor were chiefly about how students managed their performance, whereas items under the second factor were mainly about how students managed their relationships and emotions. Therefore, two factors were named as performance management and relationship management. Table 2 shows fac- tor loading of items under each dimension. Confirmatory Factor Analysis The second part of Study 1 used CFA on both group 1 and 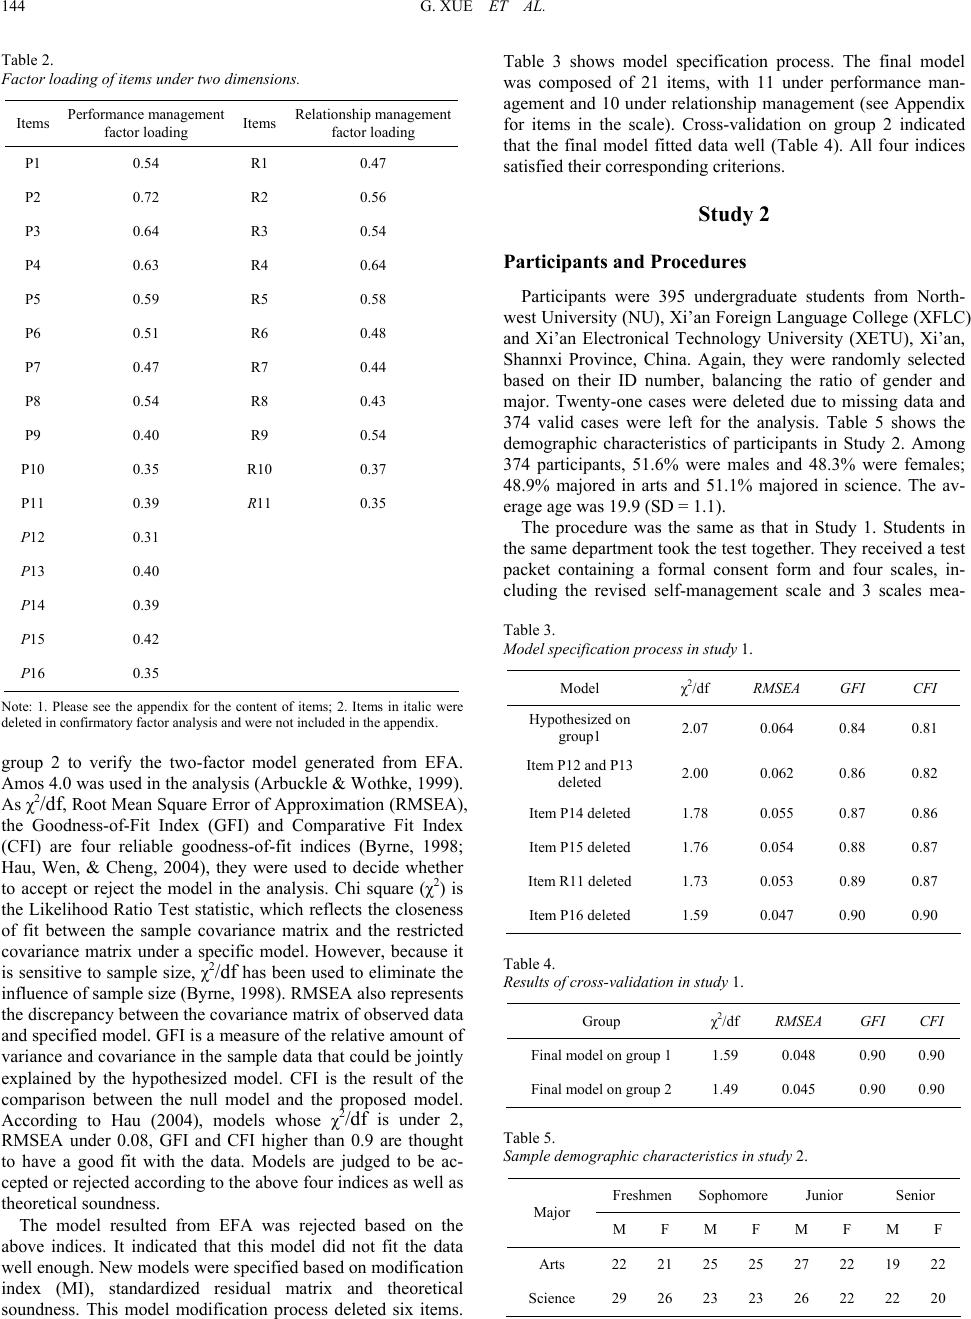 G. XUE ET AL. 144 Table 2. Factor loading of ite m s u n de r t w o d i me n s i o n s . Items Performance management factor loading Items Relationship management factor loading P1 0.54 R1 0.47 P2 0.72 R2 0.56 P3 0.64 R3 0.54 P4 0.63 R4 0.64 P5 0.59 R5 0.58 P6 0.51 R6 0.48 P7 0.47 R7 0.44 P8 0.54 R8 0.43 P9 0.40 R9 0.54 P10 0.35 R10 0.37 P11 0.39 R11 0.35 P12 0.31 P13 0.40 P14 0.39 P15 0.42 P16 0.35 Note: 1. Please see the appendix for the content of items; 2. Items in italic were deleted in confirmatory factor analysis and were not included in the appendix. group 2 to verify the two-factor model generated from EFA. Amos 4.0 was used in the analysis (Arbuckle & Wothke, 1999). As χ2/df, Root Mean Square Error of Approximation (RMSEA), the Goodness-of-Fit Index (GFI) and Comparative Fit Index (CFI) are four reliable goodness-of-fit indices (Byrne, 1998; Hau, Wen, & Cheng, 2004), they were used to decide whether to accept or reject the model in the analysis. Chi square (χ2) is the Likelihood Ratio Test statistic, which reflects the closeness of fit between the sample covariance matrix and the restricted covariance matrix under a specific model. However, because it is sensitive to sample size, χ2/df has been used to eliminate the influence of sample size (Byrne, 1998). RMSEA also represents the discrepancy between the covariance matrix of observed data and specified model. GFI is a measure of the relative amount of variance and covariance in the sample data that could be jointly explained by the hypothesized model. CFI is the result of the comparison between the null model and the proposed model. According to Hau (2004), models whose χ2/df is under 2, RMSEA under 0.08, GFI and CFI higher than 0.9 are thought to have a good fit with the data. Models are judged to be ac- cepted or rejected according to the above four indices as well as theoretical soundness. The model resulted from EFA was rejected based on the above indices. It indicated that this model did not fit the data well enough. New models were specified based on modification index (MI), standardized residual matrix and theoretical soundness. This model modification process deleted six items. Table 3 shows model specification process. The final model was composed of 21 items, with 11 under performance man- agement and 10 under relationship management (see Appendix for items in the scale). Cross-validation on group 2 indicated that the final model fitted data well (Table 4). All four indices satisfied their corresponding criterions. Study 2 Participants and Procedures Participants were 395 undergraduate students from North- west University (NU), Xi’an Foreign Language College (XFLC) and Xi’an Electronical Technology University (XETU), Xi’an, Shannxi Province, China. Again, they were randomly selected based on their ID number, balancing the ratio of gender and major. Twenty-one cases were deleted due to missing data and 374 valid cases were left for the analysis. Table 5 shows the demographic characteristics of participants in Study 2. Among 374 participants, 51.6% were males and 48.3% were females; 48.9% majored in arts and 51.1% majored in science. The av- erage age was 19.9 (SD = 1.1). The procedure was the same as that in Study 1. Students in the same department took the test together. They received a test packet containing a formal consent form and four scales, in- cluding the revised self-management scale and 3 scales mea- Table 3. Model specification process in study 1. Model χ2/df RMSEA GFI CFI Hypothesized on group1 2.07 0.064 0.84 0.81 Item P12 and P13 deleted 2.00 0.062 0.86 0.82 Item P14 deleted 1.78 0.055 0.87 0.86 Item P15 deleted 1.76 0.054 0.88 0.87 Item R11 deleted 1.73 0.053 0.89 0.87 Item P16 deleted 1.59 0.047 0.90 0.90 Table 4. Results of cross-validation in study 1. Group χ2/df RMSEA GFI CFI Final model on group 1 1.59 0.048 0.90 0.90 Final model on group 2 1.49 0.045 0.90 0.90 Table 5. Sample demographic characteristics in study 2. Freshmen Sophomore Junior Senior Major M F M F M F M F Arts 22 21 25 25 27 22 19 22 Science 29 26 23 23 26 22 22 20 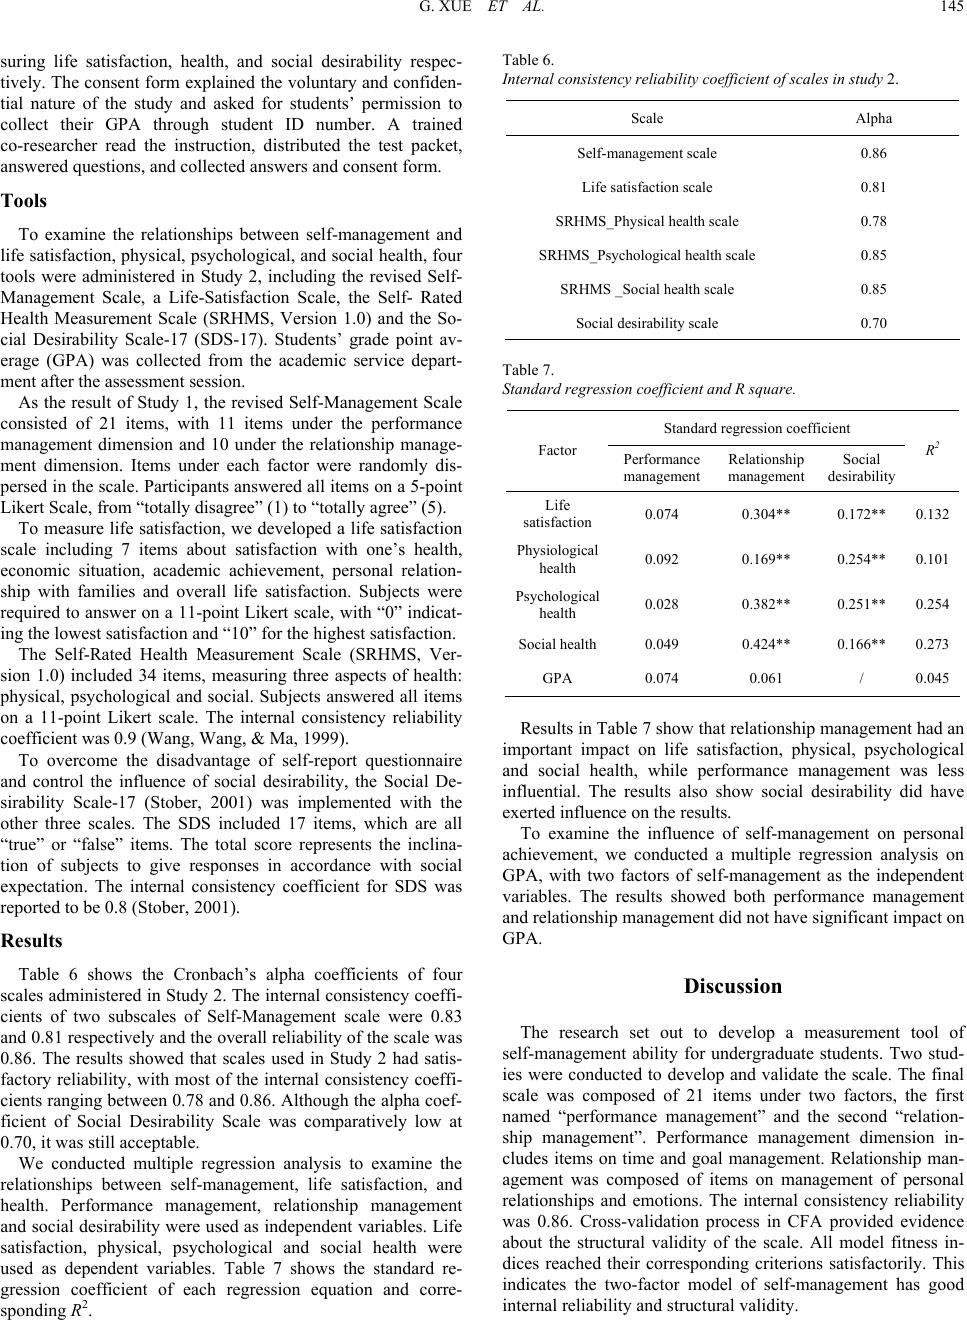 G. XUE ET AL. 145 suring life satisfaction, health, and social desirability respec- tively. The consent form explained the voluntary and confiden- tial nature of the study and asked for students’ permission to collect their GPA through student ID number. A trained co-researcher read the instruction, distributed the test packet, answered questions, and collected answers and consent form. Tools To examine the relationships between self-management and life satisfaction, physical, psychological, and social health, four tools were administered in Study 2, including the revised Self- Management Scale, a Life-Satisfaction Scale, the Self- Rated Health Measurement Scale (SRHMS, Version 1.0) and the So- cial Desirability Scale-17 (SDS-17). Students’ grade point av- erage (GPA) was collected from the academic service depart- ment after the assessment session. As the result of Study 1, the revised Self-Management Scale consisted of 21 items, with 11 items under the performance management dimension and 10 under the relationship manage- ment dimension. Items under each factor were randomly dis- persed in the scale. Participants answered all items on a 5-point Likert Scale, from “totally disagree” (1) to “totally agree” (5). To measure life satisfaction, we developed a life satisfaction scale including 7 items about satisfaction with one’s health, economic situation, academic achievement, personal relation- ship with families and overall life satisfaction. Subjects were required to answer on a 11-point Likert scale, with “0” indicat- ing the lowest satisfaction and “10” for the highest satisfaction. The Self-Rated Health Measurement Scale (SRHMS, Ver- sion 1.0) included 34 items, measuring three aspects of health: physical, psychological and social. Subjects answered all items on a 11-point Likert scale. The internal consistency reliability coefficient was 0.9 (Wang, Wang, & Ma, 1999). To overcome the disadvantage of self-report questionnaire and control the influence of social desirability, the Social De- sirability Scale-17 (Stober, 2001) was implemented with the other three scales. The SDS included 17 items, which are all “true” or “false” items. The total score represents the inclina- tion of subjects to give responses in accordance with social expectation. The internal consistency coefficient for SDS was reported to be 0.8 (Stober, 2001). Results Table 6 shows the Cronbach’s alpha coefficients of four scales administered in Study 2. The internal consistency coeffi- cients of two subscales of Self-Management scale were 0.83 and 0.81 respectively and the overall reliability of the scale was 0.86. The results showed that scales used in Study 2 had satis- factory reliability, with most of the internal consistency coeffi- cients ranging between 0.78 and 0.86. Although the alpha coef- ficient of Social Desirability Scale was comparatively low at 0.70, it was still acceptable. We conducted multiple regression analysis to examine the relationships between self-management, life satisfaction, and health. Performance management, relationship management and social desirability were used as independent variables. Life satisfaction, physical, psychological and social health were used as dependent variables. Table 7 shows the standard re- gression coefficient of each regression equation and corre- sponding R2. Table 6. Internal consistency reliability coefficient of scales in study 2. Scale Alpha Self-management scale 0.86 Life satisfaction scale 0.81 SRHMS_Physical health scale 0.78 SRHMS_Psychological health scale 0.85 SRHMS _Social health scale 0.85 Social desirability scale 0.70 Table 7. Standard regression coefficient and R sq uare. Standard regression coefficient Factor Performance management Relationship management Social desirability R2 Life satisfaction 0.074 0.304** 0.172** 0.132 Physiological health 0.092 0.169** 0.254** 0.101 Psychological health 0.028 0.382** 0.251** 0.254 Social health0.049 0.424** 0.166** 0.273 GPA 0.074 0.061 / 0.045 Results in Table 7 show that relationship management had an important impact on life satisfaction, physical, psychological and social health, while performance management was less influential. The results also show social desirability did have exerted influence on the results. To examine the influence of self-management on personal achievement, we conducted a multiple regression analysis on GPA, with two factors of self-management as the independent variables. The results showed both performance management and relationship management did not have significant impact on GPA. Discussion The research set out to develop a measurement tool of self-management ability for undergraduate students. Two stud- ies were conducted to develop and validate the scale. The final scale was composed of 21 items under two factors, the first named “performance management” and the second “relation- ship management”. Performance management dimension in- cludes items on time and goal management. Relationship man- agement was composed of items on management of personal relationships and emotions. The internal consistency reliability was 0.86. Cross-validation process in CFA provided evidence about the structural validity of the scale. All model fitness in- dices reached their corresponding criterions satisfactorily. This indicates the two-factor model of self-management has good internal reliability and structural validity.  G. XUE ET AL. 146 Further examination of the criterion-related validity showed that relationship management had a significant impact on life satisfaction, physical, psychological and social health, while the influence of performance management appeared to be marginal. What is more, both performance management and relationship management did not have significant impact on GPA. These findings show that management on performance and relationship constitute undergraduate students’ self-manage- ment in daily life. This conclusion differs from previous studies on self-management of people with physical or psychological problems, but appears to in accordance with findings about self-management of managers. Studies have revealed that manager’s self-management could be categorized into two di- mensions: task and relationship (Conway, 1999). The result of this study shows that self-management of undergraduate stu- dents can also be divided into two similar aspects. As to the validity of the scale, confirmatory factor analysis showed that the scale had good structural validity. Multiple regression analysis in Study 2 indicated that relationship man- agement was a key contributor to life satisfaction, physical, psychological and social health. People who manage their emo- tions and personal relationships well have higher life satisfac- tion and enjoy better health. It is an indication of good crite- rion-related validity for the dimension of relationship manage- ment. Performance management did not show a strong influ- ence on life satisfaction and three types of health. However, there is not sufficient evidence to draw the conclusion that per- formance management does not contribute to life satisfaction and better health; the criterion-related validity of the scale needs further examination. In addition, examination on the relationship between GPA and two self-management factors also did not provide explicit evidence about the influence of self-management on academic achievement. This result is sim- ilar to previous studies (Long, Gaynor, Erwin, & Williams, 1994). It is possible that many factors besides performance management affect GPA. Therefore, further studies need to select other indices of performance management to examine its criterion-related validity. Although studies about self-management have a long history and broad application in clinical and organizational behavior areas, undergraduate students’ self-management in daily life has not been given enough attention. The present research is important in two main aspects. First, it calls for attention to the self-management of undergraduate students. Good self-mana- gement benefits not only students’ life quality in university, but also their future development. Studies in this strand will pro- vide helpful information as to how to guide students better manage themselves. This effort to improve students’ life quality in university is also in accordance with the development of positive psychology. Second, this study provides a useful tool to measure undergraduate students’ self-management ability. Because previous scales chiefly focused on specific aspect of self-management and targeted specific groups of people, they are not applicable to undergraduate students. The present study developed a two-factor model of self-management scale based on random samples of undergraduates. Although the criterion of performance management needs further examination, the scale’s internal consistency reliability and structural validity were verified to be satisfactory. Two points about this study need special attention. One is the generalizability of the findings to other users groups. Because this scale was developed based on samples of Chinese under- graduate students, its quality needs further verification when used on other user groups. Second is the validity of the scale needs further examination, especially the dimension of per- formance management. Results in Study 2 showed that per- formance management did not have a significant impact on life satisfaction and three aspects of health. GPA was not signifi- cantly related to performance management too. Therefore, in- formation about the effect of good performance management should be collected in various ways to examine the crite- rion-related validity of performance management. References Aldag, R. J., Brief, A. P., & Kolenko, T. A. (1983). An examination of self-reinforcement systems. Paper presented at the 43rd annual meet- ing of the academy of management. Arbuckle, J. L., & Wothke, W. (1999). Amos 4.0 user’s guide. Chicago, IL: SmallWaters Corporation. Brandon, J. E., Oescher, J., & Loftin, J. M. (1990). The self-control questionnaire: An assessment. Healt h Values, 14, 3-9. Byrne, B. M. (1998). Structural equation modeling with LISREL, PRE- LIS, and SIMPLIS: Basic conceptes, applications, and programming. Mahwah, NJ: Lawrence Erlbaum Associates. Castaneda, M., Kolenko, T. A., & Aldag, R. J. (1999). Self-manage- ment perceptions and practices: A structural equations analysis. Jour- nal of Organizational Behavior, 20, 101-120. doi:10.1002/(SICI)1099-1379(199901)20:1<101::AID-JOB883>3.0. CO;2-Z Conway, J. M. (1999). Distinguishing contextual performance from task performance for managerial jobs. Journal of Applied Psychology, 84, 3-13. doi:10.1037/0021-9010.84.1.3 Frayne, C. A., & Geringer, J. M. (2000). Self-management training for improving job performance: A field experiment involving salespeo- ple. Journal of Applied Psychology, 85, 361-372. doi:10.1037/0021-9010.85.3.361 Hau, K. T., Wen, Z. L., & Cheng, Z. J. (2004). Structural equation model and its applications. Beijing: Educational Science Publishing House. Kahn, W. J. (1976). Self-management: Learning to be our own coun- selor. Personnel and Guidance Journal, 55, 176-180. Karoly, P. (1993). Mechanism of self-regulation: A systems view. Annual Reviews of Psyc h o l o gy , 44, 23-52. doi:10.1146/annurev.ps.44.020193.000323 Long, J. D., Gaynor, P., Erwin, A., & Williams, R. L. (1994). The rela- tionship of self-management to academic motivation, study effi- ciency, academic satisfaction, and grade point average among pro- spective education majors. Psychology: A Journal of Human Behav- ior, 31, 22-30. Lorig, K., & Holman, H. R. (2003). Self-management education: His- tory, definition, outcomes, and mechanisms. Annals of Behavioral Medicine, 26, 1-7. doi:10.1207/S15324796ABM2601_01 Mahoney, M. J. (1972). Research issues in self-management. Behavior Therapy, 3, 45-63. doi:10.1016/S0005-7894(72)80051-0 Manz, C. C. (1986). Self-leadership: Toward an expanded theory of self-influence processes in organizations. Academy of Management Review, 11, 585-600. Mezo, P. (2009). The self-control and self-management scale (SCMS): Development of an adaptive self-regulatory coping skills instrument. Journal of psychopatho l ogy and behaviora l a s s e s s m e n t, 31, 83-93. doi:10.1007/s10862-008-9104-2 Redden, E. M., Tucker, R. K., & Young, L. (1983). Psychometric properties of the Rosenbaum schedule for assessing self-control. The Psychological Record, 33, 77-86. Rehm, L. P., Fuchs, C. Z., Roth, D. M., Kornblith, S. J., & Romano, J.  G. XUE ET AL. 147 M. (1979). A comparison of self-control and assertion skills treat- ments of depression. Behavior Therapy, 10, 429-442. doi:10.1016/S0005-7894(79)80048-9 Richards, P. S. (1985). Construct validation of the self-control schedule. Journal of Research in Personality, 19, 208-218. doi:10.1016/0092-6566(85)90029-7 Rosenbaum, M. (1980). A schedule for assessing self-control behaviors: Preliminary findings. Behavior Therapy, 11, 109-121. doi:10.1016/S0005-7894(80)80040-2 Rude, S. S. (1986). Relative benefits of assertion or cognitive self- control treatment for depression as a function of proficiency in each domain. Journal of Consulting and Clinical Psychology, 54, 390- 394. doi:10.1037/0022-006X.54.3.390 Rude, S. S. (1989). Dimensions of self-control in a sample of depressed women. Cognitive Therapy and Research, 1 3, 363-375. doi:10.1007/BF01173479 Stober, J. (2001). The social desirability scale-17: Convergent validity, discriminant validity, and relationship with age. European Journal of Psychological Asse ssment, 17, 222-232. Wang, X. D., Wang, X. L., & Ma, H. (Eds.) (1999). Handbook of psy- chological health rating scale. Beijing: China Psychological Health Magazine Press. Watson, D. L., & Roland, G. T. (1993). Self-directed behavior: Self- modification for personal adjustment. Belmont, CA: Brooks/Cole Publishing Compan Appendix Self-Management Scale Performance Management 1) I make a to-do list everyday. 2) I try to finish tasks on time. 3) I make schedules to help myself finish tasks on time. 4) I always finish my tasks on time. 5) I get all the help I can to help me reach my goals. 6) I often think about how to better manage my time. 7) I pay particular attention to developing skills that will be important to my future career. 8) I set long-term goals for myself. 9) I am almost always on time. 10) I reward myself immediately after I reach my goal. 11) I do not like disorderly working environment. Relationship Management 1) I get well along with most people. 2) When I communicate with other people, I can understand them very well. 3) Friends always seek my help when they are in trouble. 4) I control my mood very well. 5) I am good at finding other peoples’ strengths. 6) I often give my friends constructive suggestions to help them improve their lives. 7) I control my emotions very well, even when I am angry with someone. 8) I take a positive view of my situation even when I am in trouble. 9) When I get depressed, I do something to make myself happy. 10) I am good at handling problems that come up in my rela- tionships with other people. |