

Paper Menu >>
Journal Menu >>
 Journal of Environmental Protection, 2011, 2, 482-488 doi: 10.4236/jep.2011.24056 Published Online June 2011 (http://www.SciRP.org/journal/jep) Copyright © 2011 SciRes. JEP Distribution Behaviour of Dimethoate in Tea Leaf Shivani Jaggi1*, Bikram Singh2, Adarsh Shanker2 1Maya Institute of Technology & Management Selaqui, Dehradun, Uttarakhand, India, 2Institute of Himalayan Bioresource Tech- nology (IHBT), Council of Scientific & Industrial Research, Palampur (Himachal Pradesh), India Email: [email protected] Received February 9th, 2011; revised March 17th, 2011; accepted May 2nd, 2011. ABSTRACT A study was undertaken to assess the distribution behaviour of Dimethoate in tea leaf. Tea bushes were subjected to Dimethoate spray at recommended dose and double the recommended doses. The extraction of pesticide was done using chloroform and the analysis wa s done using a Hewlett-Packa rd 5890 series II gas chromatog raph with Nitrogen Phos- phorus Detector (NPD). The penetration behaviour of Dimethoate was studied in dry and wet seasons. Variations in penetration were observed in dry and wet seasons which was attributed to climatic factors like temperature, humidity, rainfall, sunlight and physicoch emical properties of the residue like water solubility, partition coeffici ent and formula- tion type. Residues observed in the cell wall and tissues confirm its good penetrating ability inspite of its hydrophilic nature. Higher penetration in wet season as indicated can be attributed to the route through the stomatal pores. Keywords: Tea, Cuticle, Dimethoate, Dissipation 1. Introduction Tea, Camellia sinensis (L) O. Kurtze, is the most impor- tant plantation crop in India occupying 420,000 ha of land. All over the world it is a popular invigorating and refreshing drink having excellent medicinal properties. Considering that an estimated amount of 18 - 20 billion cups are consumed daily in the world its economic and social interest is clear [1]. Like any other crop tea planta- tions are also subjected to ravages of insects, mites, plant pathogens, nematodes etc. The perennial nature of the crop and the more equitable weather pattern prevailing in tea areas are favorable for insect pests resulting in 250-500 million kg of annual loss of crop. In terms of monetary loss it could be approximately 500 million-1 billion US $ [2]. The insects target almost all plant parts such as roots, stem, leaves and buds. Thus every part of the tea plant is a potential target for a wide spectrum of pests and disease causing organisms. Tea is an unusual crop where leaves are sprayed di- rectly with pesticides, harvested and processed even without washing. The shoots of the tea plant are thin and tender (233 - 291 m) with cuticle thickness 4 - 10 m and surface area per unit weight of leaf (tender leaf 41.7 cm2/gm and mature leaf 15.9 cm2/gm respectively).Tea leaf, with thin cuticle, relatively larger surface area and short interval between pesticide application and harvest, is expected to be permeable to various groups of chemi- cals. Pesticide thus could have negative impact both on ecology and quality of tea when applied [3]. Conse- quently tea represents a significant potential of human exposure to pesticide residues by virtue of high applica- tion of pesticides to tea crop coupled with the average intake of 6 gms of dried (made) tea per day per individ- ual [4,5]. Some basic studies on plant cuticles as barriers against the diffusion of chemicals have been reported [6,7]. Pesticide penetration into the leaf surface plays important practical implications as it allows the residues to stick/persist thus maintaining its efficacy even if it rains after the treatment [8]. Moreover once the pesticide has penetrated the epicuticular wax solar radiations act- ing on the pesticide molecule have to cross the cuticle thus reducing the photodegradative activity [9]. Further- more, cuticular wax can hold on the pesticide residues resulting in low volatility from the leaf surface. The in- formation available on the fate of pesticides on tea leaf and role leaf cuticle, plays in the dissipation under dif- ferent environmental conditions is scanty in literature. Hence a study was initiated to understand the penetrating and dissipation behavior of dimethoate on tea leaf sur- face. Fate of dimethoate in tea and its brew have been reported but still its exact behaviour on the tea leaf sur- face is not known thoroughly [10,11]. 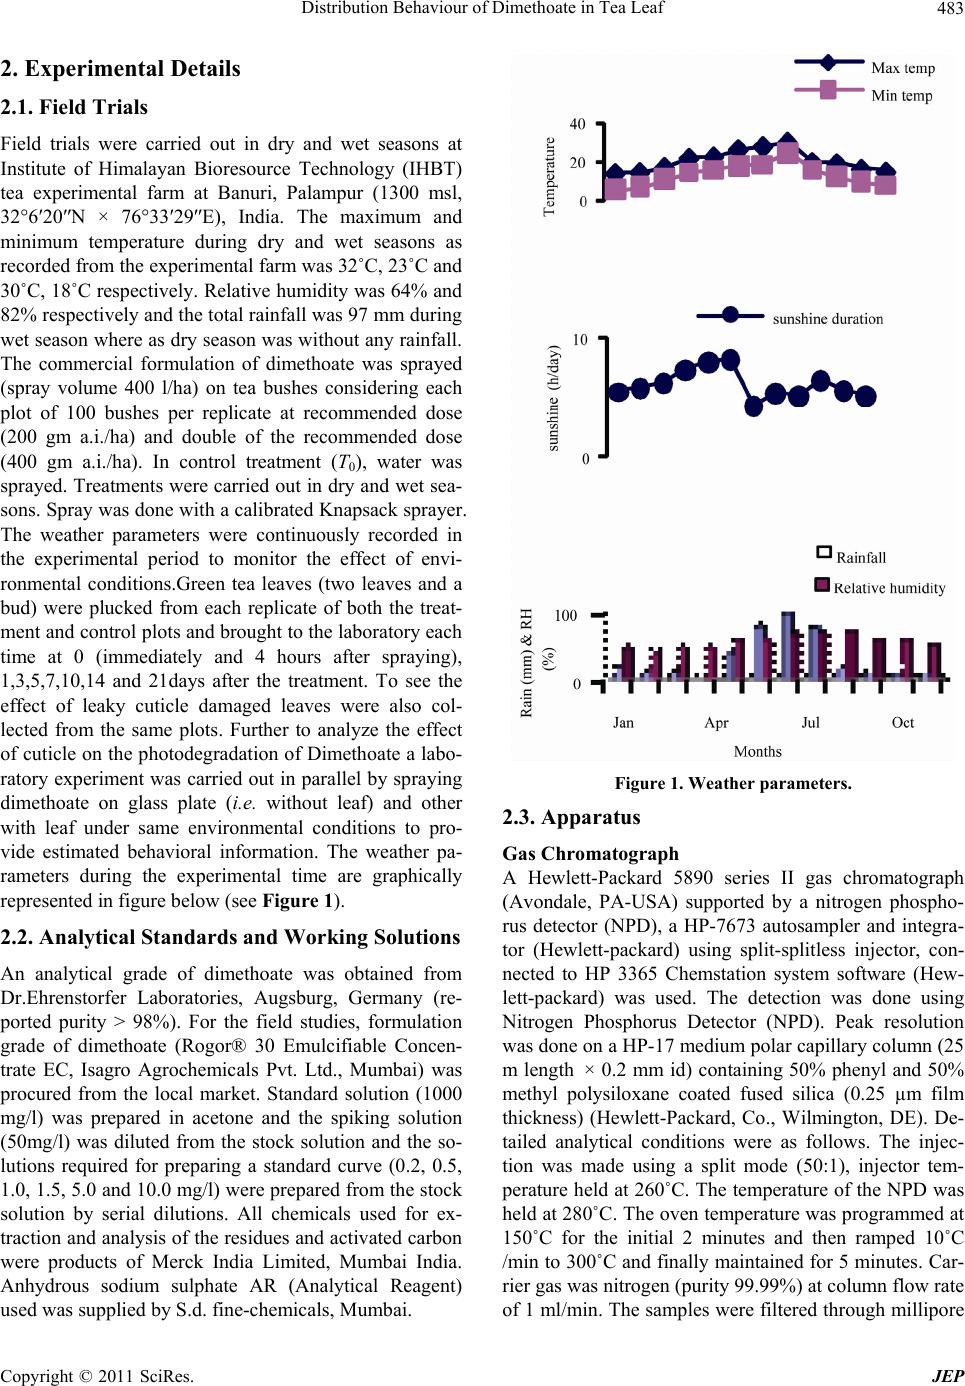 Distribution Behaviour of Dimethoate in Tea Leaf483 2. Experimental Details 2.1. Field Trials Field trials were carried out in dry and wet seasons at Institute of Himalayan Bioresource Technology (IHBT) tea experimental farm at Banuri, Palampur (1300 msl, 326′20″N × 7633′29″E), India. The maximum and minimum temperature during dry and wet seasons as recorded from the experimental farm was 32˚C, 23˚C and 30˚C, 18˚C respectively. Relative humidity was 64% and 82% respectively and the total rainfall was 97 mm during wet season where as dry season was without any rainfall. The commercial formulation of dimethoate was sprayed (spray volume 400 l/ha) on tea bushes considering each plot of 100 bushes per replicate at recommended dose (200 gm a.i./ha) and double of the recommended dose (400 gm a.i./ha). In control treatment (T0), water was sprayed. Treatments were carried out in dry and wet sea- sons. Spray was done with a calibrated Knapsack sprayer. The weather parameters were continuously recorded in the experimental period to monitor the effect of envi- ronmental conditions.Green tea leaves (two leaves and a bud) were plucked from each replicate of both the treat- ment and control plots and brought to the laboratory each time at 0 (immediately and 4 hours after spraying), 1,3,5,7,10,14 and 21days after the treatment. To see the effect of leaky cuticle damaged leaves were also col- lected from the same plots. Further to analyze the effect of cuticle on the photodegradation of Dimethoate a labo- ratory experiment was carried out in parallel by spraying dimethoate on glass plate (i.e. without leaf) and other with leaf under same environmental conditions to pro- vide estimated behavioral information. The weather pa- rameters during the experimental time are graphically represented in figure below (see Figure 1). 2.2. Analytical Standards and Working Solutions An analytical grade of dimethoate was obtained from Dr.Ehrenstorfer Laboratories, Augsburg, Germany (re- ported purity > 98%). For the field studies, formulation grade of dimethoate (Rogor® 30 Emulcifiable Concen- trate EC, Isagro Agrochemicals Pvt. Ltd., Mumbai) was procured from the local market. Standard solution (1000 mg/l) was prepared in acetone and the spiking solution (50mg/l) was diluted from the stock solution and the so- lutions required for preparing a standard curve (0.2, 0.5, 1.0, 1.5, 5.0 and 10.0 mg/l) were prepared from the stock solution by serial dilutions. All chemicals used for ex- traction and analysis of the residues and activated carbon were products of Merck India Limited, Mumbai India. Anhydrous sodium sulphate AR (Analytical Reagent) used was supplied by S.d. fine-chemicals, Mumbai. Figure 1. Weather parameters. 2.3. Apparatus Gas Chromatograph A Hewlett-Packard 5890 series II gas chromatograph (Avondale, PA-USA) supported by a nitrogen phospho- rus detector (NPD), a HP-7673 autosampler and integra- tor (Hewlett-packard) using split-splitless injector, con- nected to HP 3365 Chemstation system software (Hew- lett-packard) was used. The detection was done using Nitrogen Phosphorus Detector (NPD). Peak resolution was done on a HP-17 medium polar capillary column (25 m length × 0.2 mm id) containing 50% phenyl and 50% methyl polysiloxane coated fused silica (0.25 µm film thickness) (Hewlett-Packard, Co., Wilmington, DE). De- tailed analytical conditions were as follows. The injec- tion was made using a split mode (50:1), injector tem- perature held at 260˚C. The temperature of the NPD was held at 280˚C. The oven temperature was programmed at 150˚C for the initial 2 minutes and then ramped 10˚C /min to 300˚C and finally maintained for 5 minutes. Car- rier gas was nitrogen (purity 99.99%) at column flow rate of 1 ml/min. The samples were filtered through millipore Copyright © 2011 SciRes. JEP  Distribution Behaviour of Dimethoate in Tea Leaf 484 membrane teflon filters (0.45 µm particle size) before injection into the chromatographic column. 3. Standard Calibration Curve Standard curve was prepared by diluting the stock solu- tion to five different concentrations in acetone. The col- umn was conditioned by repeated injections (3 times) of the standard under constant operating conditions until the peaks obtained were reproducible. Dimethoate was injected at 0.2, 0.5, 1.0, 5.0 and 10.0 mg/l to validate the method. Recovery Assay Before laying the experiments in the field, recovery studies were performed at 50.0 mg/l fortification level of active ingredient (three replicates) of each matrix (green leaves, dried leaves and soil). These samples were pre- pared by adding known amount of standard in matrix before extraction. The extraction was carried out as de- scribed below in section The duplicate injections of each extract were made in Gas Chromatograph (GC-NPD). 4. Extraction of Pesticide from Leaf Surface Extraction of dimethoate was done with Chloroform (re- covery > 90%) The extract was agitated mechanically with acetonitrile for 3 hours on a horizontal shaker. The mixture was filtered through Whatman no.1 filter paper and the cake was washed twice with 20 ml solvent each time. The combined water extract was partitioned with 150ml of acetonitrile twice in a 500 ml separating funnel. Discarding the aqueous layer, the organic layer was con- centrated to near dryness on a water bath and reconsti- tuted with 1 ml of acetone for final analysis. The effect of washing was thus confirmed by laboratory washing and in case of samples collected from the treated fields in dry and wet seasons, the residue was extracted in dichloro- methane. The final eluate was evaporated to near dryness and the residue was reconstituted with 1ml acetone for quantification. 4.1. Extraction of Pesticide from Epicuticular Wax Epicuticular wax extraction was done using the method described by Mc. Donald et al. [12]. After thorough washing to remove the surface pesticides, the tea leaves were soaked in 100 ml of chloroform and shaken on an automatic horizontal shaker for 1 minute. Extract was filtered through Whatman No.1 filter paper and concen- trated to 5 ml followed by passing through an adsorbent column containing florisil topped with 1 cm of anhy- drous sodium sulphate prewashed with chloroform. The extract was eluted with 200 ml of chloroform, concen- trated on a vacuum rotatory evaporator using a water bath at 35˚C - 40˚C. The residue was finally reconstituted with 1ml of acetone and quantified by GC (NPD). 4.2. Extraction of Pesticide from Cell Wall Extraction of dimethoate was done by soaking the tea leaves in 100 ml of chloroform and shaken on an auto- matic horizontal shaker for 1 minute. Extract was filtered through Whatman No.1 filter paper and concentrated to 5 ml followed by passing through an adsorbent column containing florisil topped with 1 cm of anhydrous sodium sulphate prewashed with chloroform. The extract was eluted with 200 ml of chloroform, concentrated on a vacuum rotatory evaporator using a water bath at 35˚C - 40˚C. The extract was finally eluted with dichloro- methane (200 ml) from the florisil column. The eluate was evaporated to dryness and reconstituted to 1 ml in acetone and 2 µl of it was analysed by GC (NPD). 5. Detection and Quantification Detection limit test To determine the limit of detection made tea samples were spiked with different concentration levels of di- methoate standard and analysed by GC (NPD). The de- tection limit was evaluated by the peak signal/noise (S/N) ratio. An S/N ratio greater than 3 was considered as a detectable peak. 6. Results and Discussion 6.1. Quantification The GC analytical conditions were optimized in terms of temperature program that allowed an improvement of the time and the chromatographic run resolution. Moreover to avoid the cross contamination between high and low spiked samples, the sequence of injections was in the following order: solvent, blank sample, sprayed samples and finally standard solution. No interfering peaks were present during the analysis of any samples as before each run the solvent was injected. Moreover, the adopted oven programming allowed a good chromatographic separation of dimethoate. The total run time was 14 minutes and the retention time of the dimethoate in the given chromatographic conditions was 8.68 minutes and constant for each series of samples. Chromatographic separation by HP-17 column provided good results for the quantification of the samples. 6.2. Linearity The calibration curve of the analysed dimethoate gave a good regression line (R2 = 0.8827) in the range of ex- plored concentrations, 0.1 - 10.0 mg/l. The detection limit of dimethoate was taken to be 0.01 mg/kg, which were much lower than the maximum residue limits fixed by European Commision for dimethoate in tea (0.2 mg/kg). Residues below 0.01 mg/kg were detected but not quantified. This low detection limit was achieved Copyright © 2011 SciRes. JEP 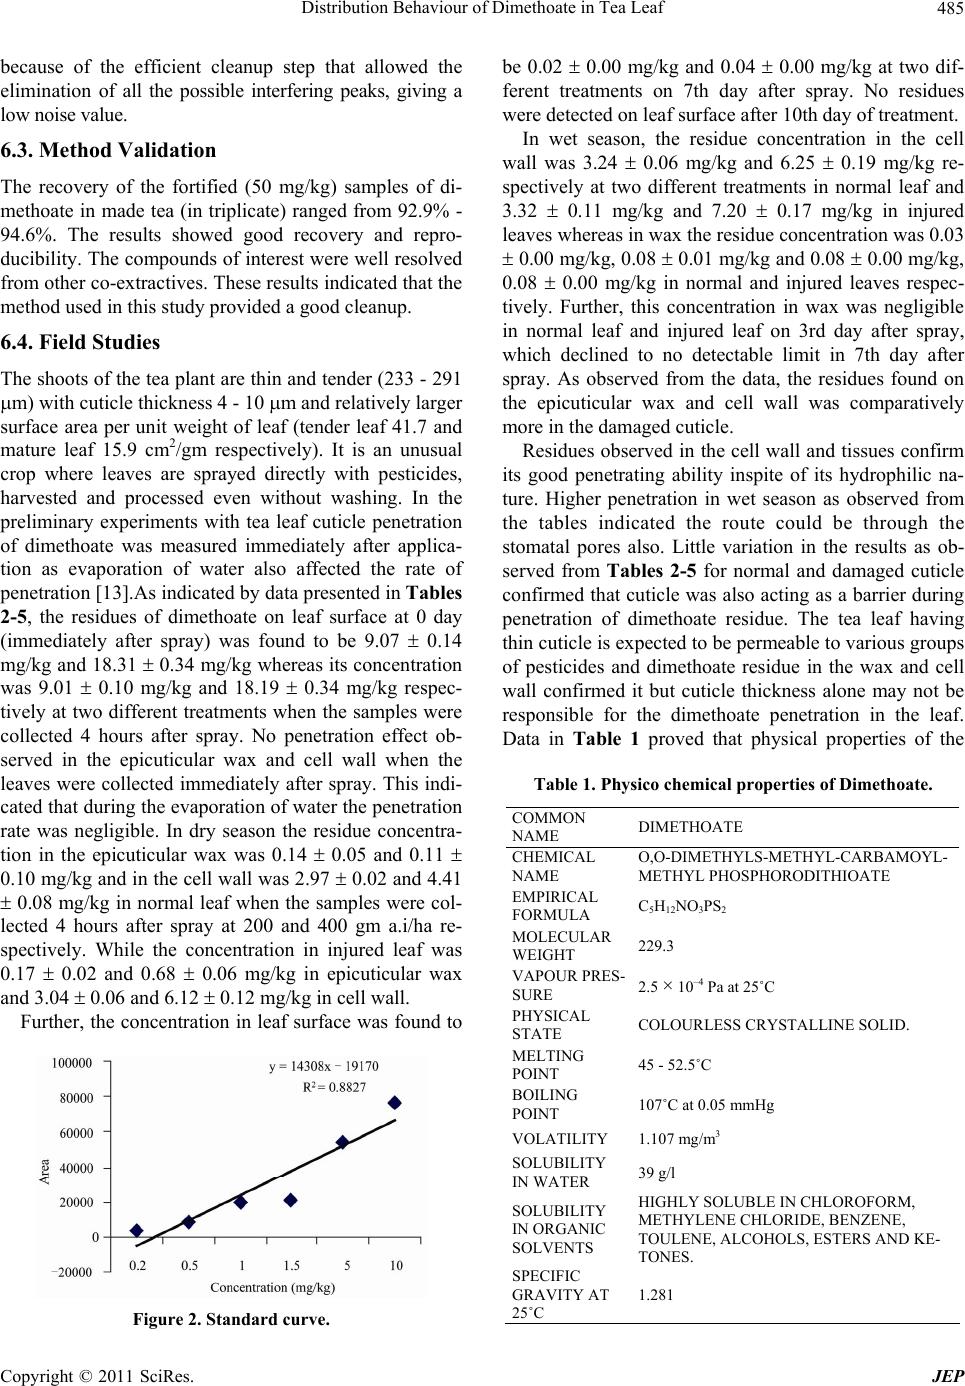 Distribution Behaviour of Dimethoate in Tea Leaf485 because of the efficient cleanup step that allowed the elimination of all the possible interfering peaks, giving a low noise value. 6.3. Method Validation The recovery of the fortified (50 mg/kg) samples of di- methoate in made tea (in triplicate) ranged from 92.9% - 94.6%. The results showed good recovery and repro- ducibility. The compounds of interest were well resolved from other co-extractives. These results indicated that the method used in this study provided a good cleanup. 6.4. Field Studies The shoots of the tea plant are thin and tender (233 - 291 m) with cuticle thickness 4 - 10 m and relatively larger surface area per unit weight of leaf (tender leaf 41.7 and mature leaf 15.9 cm2/gm respectively). It is an unusual crop where leaves are sprayed directly with pesticides, harvested and processed even without washing. In the preliminary experiments with tea leaf cuticle penetration of dimethoate was measured immediately after applica- tion as evaporation of water also affected the rate of penetration [13].As indicated by data presented in Tables 2-5, the residues of dimethoate on leaf surface at 0 day (immediately after spray) was found to be 9.07 0.14 mg/kg and 18.31 0.34 mg/kg whereas its concentration was 9.01 0.10 mg/kg and 18.19 0.34 mg/kg respec- tively at two different treatments when the samples were collected 4 hours after spray. No penetration effect ob- served in the epicuticular wax and cell wall when the leaves were collected immediately after spray. This indi- cated that during the evaporation of water the penetration rate was negligible. In dry season the residue concentra- tion in the epicuticular wax was 0.14 0.05 and 0.11 0.10 mg/kg and in the cell wall was 2.97 0.02 and 4.41 0.08 mg/kg in normal leaf when the samples were col- lected 4 hours after spray at 200 and 400 gm a.i/ha re- spectively. While the concentration in injured leaf was 0.17 0.02 and 0.68 0.06 mg/kg in epicuticular wax and 3.04 0.06 and 6.12 0.12 mg/kg in cell wall. Further, the concentration in leaf surface was found to Figure 2. Standard curve. be 0.02 0.00 mg/kg and 0.04 0.00 mg/kg at two dif- ferent treatments on 7th day after spray. No residues were detected on leaf surface after 10th day of treatment. In wet season, the residue concentration in the cell wall was 3.24 0.06 mg/kg and 6.25 0.19 mg/kg re- spectively at two different treatments in normal leaf and 3.32 0.11 mg/kg and 7.20 0.17 mg/kg in injured leaves whereas in wax the residue concentration was 0.03 0.00 mg/kg, 0.08 0.01 mg/kg and 0.08 0.00 mg/kg, 0.08 0.00 mg/kg in normal and injured leaves respec- tively. Further, this concentration in wax was negligible in normal leaf and injured leaf on 3rd day after spray, which declined to no detectable limit in 7th day after spray. As observed from the data, the residues found on the epicuticular wax and cell wall was comparatively more in the damaged cuticle. Residues observed in the cell wall and tissues confirm its good penetrating ability inspite of its hydrophilic na- ture. Higher penetration in wet season as observed from the tables indicated the route could be through the stomatal pores also. Little variation in the results as ob- served from Tables 2-5 for normal and damaged cuticle confirmed that cuticle was also acting as a barrier during penetration of dimethoate residue. The tea leaf having thin cuticle is expected to be permeable to various groups of pesticides and dimethoate residue in the wax and cell wall confirmed it but cuticle thickness alone may not be responsible for the dimethoate penetration in the leaf. Data in Table 1 proved that physical properties of the Table 1. Physico chemical properties of Dimethoate. COMMON NAME DIMETHOATE CHEMICAL NAME O,O-DIMETHYLS-METHYL-CARBAMOYL- METHYL PHOSPHORODITHIOATE EMPIRICAL FORMULA C5H12NO3PS2 MOLECULAR WEIGHT 229.3 VAPOUR PRES- SURE 2.5 × 10⁻⁴ Pa at 25˚C PHYSICAL STATE COLOURLESS CRYSTALLINE SOLID. MELTING POINT 45 - 52.5˚C BOILING POINT 107˚C at 0.05 mmHg VOLATILITY 1.107 mg/m3 SOLUBILITY IN WATER 39 g/l SOLUBILITY IN ORGANIC SOLVENTS HIGHLY SOLUBLE IN CHLOROFORM, METHYLENE CHLORIDE, BENZENE, TOULENE, ALCOHOLS, ESTERS AND KE- TONES. SPECIFIC GRAVITY AT 25˚C 1.281 Copyright © 2011 SciRes. JEP 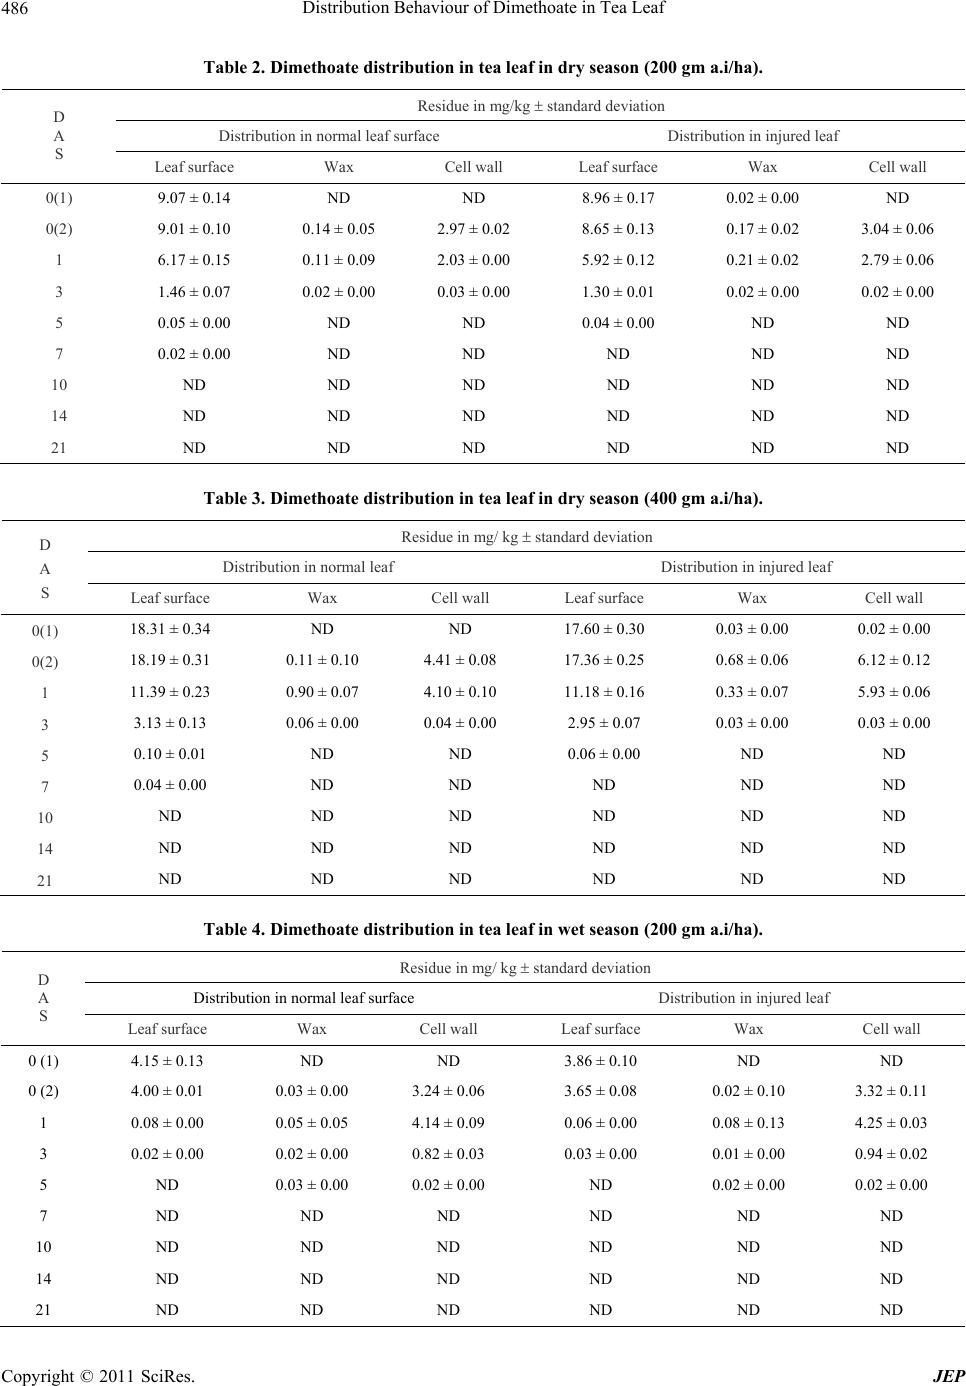 Distribution Behaviour of Dimethoate in Tea Leaf Copyright © 2011 SciRes. JEP 486 Table 2. Dimethoate distribution in tea leaf in dry season (200 gm a.i/ha). Residue in mg/kg standard deviation Distribution in normal leaf surface Distribution in injured leaf D A S Leaf surface Wax Cell wall Leaf surface Wax Cell wall 0(1) 9.07 ± 0.14 ND ND 8.96 ± 0.17 0.02 ± 0.00 ND 0(2) 9.01 ± 0.10 0.14 ± 0.05 2.97 ± 0.02 8.65 ± 0.13 0.17 ± 0.02 3.04 ± 0.06 1 6.17 ± 0.15 0.11 ± 0.09 2.03 ± 0.00 5.92 ± 0.12 0.21 ± 0.02 2.79 ± 0.06 3 1.46 ± 0.07 0.02 ± 0.00 0.03 ± 0.00 1.30 ± 0.01 0.02 ± 0.00 0.02 ± 0.00 5 0.05 ± 0.00 ND ND 0.04 ± 0.00 ND ND 7 0.02 ± 0.00 ND ND ND ND ND 10 ND ND ND ND ND ND 14 ND ND ND ND ND ND 21 ND ND ND ND ND ND Table 3. Dimethoate distribution in tea leaf in dry season (400 gm a.i/ha). Residue in mg/ kg standard deviation Distribution in normal leaf Distribution in injured leaf D A S Leaf surface Wax Cell wall Leaf surface Wax Cell wall 0(1) 18.31 ± 0.34 ND ND 17.60 ± 0.30 0.03 ± 0.00 0.02 ± 0.00 0(2) 18.19 ± 0.31 0.11 ± 0.10 4.41 ± 0.08 17.36 ± 0.25 0.68 ± 0.06 6.12 ± 0.12 1 11.39 ± 0.23 0.90 ± 0.07 4.10 ± 0.10 11.18 ± 0.16 0.33 ± 0.07 5.93 ± 0.06 3 3.13 ± 0.13 0.06 ± 0.00 0.04 ± 0.00 2.95 ± 0.07 0.03 ± 0.00 0.03 ± 0.00 5 0.10 ± 0.01 ND ND 0.06 ± 0.00 ND ND 7 0.04 ± 0.00 ND ND ND ND ND 10 ND ND ND ND ND ND 14 ND ND ND ND ND ND 21 ND ND ND ND ND ND Table 4. Dimethoate distribution in tea leaf in wet season (200 gm a.i/ha). Residue in mg/ kg standard deviation Distribution in normal leaf surface Distribution in injured leaf D A S Leaf surface Wax Cell wall Leaf surface Wax Cell wall 0 (1) 4.15 ± 0.13 ND ND 3.86 ± 0.10 ND ND 0 (2) 4.00 ± 0.01 0.03 ± 0.00 3.24 ± 0.06 3.65 ± 0.08 0.02 ± 0.10 3.32 ± 0.11 1 0.08 ± 0.00 0.05 ± 0.05 4.14 ± 0.09 0.06 ± 0.00 0.08 ± 0.13 4.25 ± 0.03 3 0.02 ± 0.00 0.02 ± 0.00 0.82 ± 0.03 0.03 ± 0.00 0.01 ± 0.00 0.94 ± 0.02 5 ND 0.03 ± 0.00 0.02 ± 0.00 ND 0.02 ± 0.00 0.02 ± 0.00 7 ND ND ND ND ND ND 10 ND ND ND ND ND ND 14 ND ND ND ND ND ND 21 ND ND ND ND ND ND 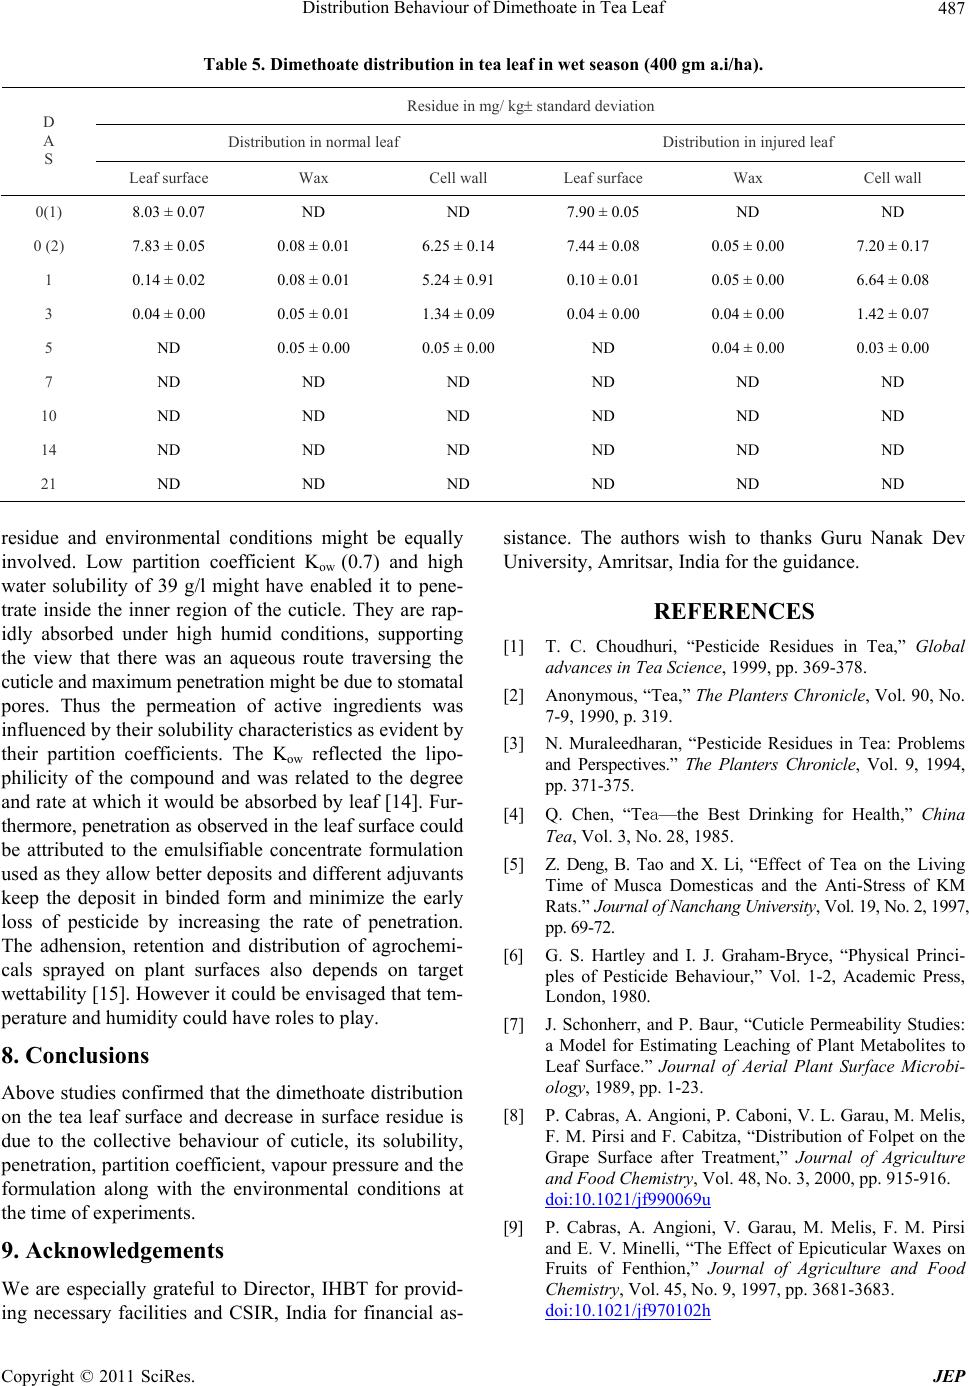 Distribution Behaviour of Dimethoate in Tea Leaf487 Table 5. Dimethoate distribution in tea leaf in wet season (400 gm a.i/ha). Residue in mg/ kg standard deviation Distribution in normal leaf Distribution in injured leaf D A S Leaf surface Wax Cell wall Leaf surface Wax Cell wall 0(1) 8.03 ± 0.07 ND ND 7.90 ± 0.05 ND ND 0 (2) 7.83 ± 0.05 0.08 ± 0.01 6.25 ± 0.14 7.44 ± 0.08 0.05 ± 0.00 7.20 ± 0.17 1 0.14 ± 0.02 0.08 ± 0.01 5.24 ± 0.91 0.10 ± 0.01 0.05 ± 0.00 6.64 ± 0.08 3 0.04 ± 0.00 0.05 ± 0.01 1.34 ± 0.09 0.04 ± 0.00 0.04 ± 0.00 1.42 ± 0.07 5 ND 0.05 ± 0.00 0.05 ± 0.00 ND 0.04 ± 0.00 0.03 ± 0.00 7 ND ND ND ND ND ND 10 ND ND ND ND ND ND 14 ND ND ND ND ND ND 21 ND ND ND ND ND ND residue and environmental conditions might be equally involved. Low partition coefficient Kow (0.7) and high water solubility of 39 g/l might have enabled it to pene- trate inside the inner region of the cuticle. They are rap- idly absorbed under high humid conditions, supporting the view that there was an aqueous route traversing the cuticle and maximum penetration might be due to stomatal pores. Thus the permeation of active ingredients was influenced by their solubility characteristics as evident by their partition coefficients. The Kow reflected the lipo- philicity of the compound and was related to the degree and rate at which it would be absorbed by leaf [14]. Fur- thermore, penetration as observed in the leaf surface could be attributed to the emulsifiable concentrate formulation used as they allow better deposits and different adjuvants keep the deposit in binded form and minimize the early loss of pesticide by increasing the rate of penetration. The adhension, retention and distribution of agrochemi- cals sprayed on plant surfaces also depends on target wettability [15]. However it could be envisaged that tem- perature and humidity could have roles to play. 8. Conclusions Above studies confirmed that the dimethoate distribution on the tea leaf surface and decrease in surface residue is due to the collective behaviour of cuticle, its solubility, penetration, partition coefficient, vapour pressure and the formulation along with the environmental conditions at the time of experiments. 9. Acknowledgements We are especially grateful to Director, IHBT for provid- ing necessary facilities and CSIR, India for financial as- sistance. The authors wish to thanks Guru Nanak Dev University, Amritsar, India for the guidance. REFERENCES [1] T. C. Choudhuri, “Pesticide Residues in Tea,” Global advances in Tea Science , 1999, pp. 369-378. [2] Anonymous, “Tea,” The Planters Chronicle, Vol. 90, No. 7-9, 1990, p. 319. [3] N. Muraleedharan, “Pesticide Residues in Tea: Problems and Perspectives.” The Planters Chronicle, Vol. 9, 1994, pp. 371-375. [4] Q. Chen, “Tea—the Best Drinking for Health,” China Tea, Vol. 3, No. 28, 1985. [5] Z. Deng, B. Tao and X. Li, “Effect of Tea on the Living Time of Musca Domesticas and the Anti-Stress of KM Rats.” Journal of Nanchang University, Vol. 19, No. 2, 1997, pp. 69-72. [6] G. S. Hartley and I. J. Graham-Bryce, “Physical Princi- ples of Pesticide Behaviour,” Vol. 1-2, Academic Press, London, 1980. [7] J. Schonherr, and P. Baur, “Cuticle Permeability Studies: a Model for Estimating Leaching of Plant Metabolites to Leaf Surface.” Journal of Aerial Plant Surface Microbi- ology, 1989, pp. 1-23. [8] P. Cabras, A. Angioni, P. Caboni, V. L. Garau, M. Melis, F. M. Pirsi and F. Cabitza, “Distribution of Folpet on the Grape Surface after Treatment,” Journal of Agriculture and Food Chemistry, Vol. 48, No. 3, 2000, pp. 915-916. doi:10.1021/jf990069u [9] P. Cabras, A. Angioni, V. Garau, M. Melis, F. M. Pirsi and E. V. Minelli, “The Effect of Epicuticular Waxes on Fruits of Fenthion,” Journal of Agriculture and Food Chemistry, Vol. 45, No. 9, 1997, pp. 3681-3683. doi:10.1021/jf970102h Copyright © 2011 SciRes. JEP  Distribution Behaviour of Dimethoate in Tea Leaf 488 [10] S. Jaggi, C. Sood, V. Kumar, S. D. Ravindranath and A. Shanker, “Leaching of Pesticide in Tea Brew,” Journal of Agricultural and Food Chemistry, 2001, Vol. 49, No. 11, pp. 5479-5483. doi:10.1021/jf010436d [11] C. Sood, S, Jaggi, V. Kumar, S. D. Ravindranath and A. Shanker, “Effect of Various Manufacturing Stages on Pesticide Residues in Tea.” Journal of the Science of Food and Agriculture. Vol. 84, No. 15, 2004, pp 2123- 2127. doi:10.1002/jsfa.1774 [12] R. E. McDonald, H. E. Nordby and T. G. Mccollum, “Epicuticular wax morphology and composition related to grape fruit injury,” Horticulture Science, Vol. 28, 1993, pp. 311-312. [13] P. Baur, “Effects on Cuticular Penetration of Neutral Polar Compounds: Dependence on Humidity and Tempera- ture,” Journal of Agriculture and Food Chemistry, Vol. 47, No. 2, 1999, pp. 753-761. doi:10.1021/jf980507h [14] G. G. Briggs, R. H. Bromilow and A. A. Evans, “Relationship between Lipophilicity and Root uptake and Translocation of Non-Ionised Chemicals in Barley.” Pesticide Science, Vol. 13, No. 5, 1982, pp. 294-504. doi:10.1002/ps.2780130506 [15] R. E. Gaskin, K. D. Steele and W. A. Forster, “Characterizing Plant Surfaces for Spray Adhesion and Retention.” New Zealand Plant Protection, Vol. 58, 2005, pp. 179-183. Copyright © 2011 SciRes. JEP |