

Paper Menu >>
Journal Menu >>
 Journal of Environmental Protection, 2011, 2, 465-472 doi:10.4236/jep.2011.24054 Published Online June 2011 (http://www.SciRP.org/journal/jep) Copyright © 2011 SciRes. JEP 465 Urban Heat Island Effect over National Capital Region of India: A Study using the Temperature Trends Manju Mohan1, Anurag Kandya1, Arunachalam Battiprolu2 1Centre for Atmospheric Sciences, Indian Institute of Technology Delhi, India; 2Wapcos (I) Ltd., Institutional Area, Sector-18, Gur- gaon, Haryana. Email: [email protected] Received October 11th, 2010; revised February 19th, 2011; accepted April 7th, 2011. ABSTRACT The local temperature is one of the major climatic elements to record the changes in the atmospheric environment brought about by industrialization, increasing population and massive urbanization. The present study deals with the annual and seasonal temperature trends and anomalies for maximum, minimum and mean temperatures of the four meteorological stations of the Natio nal Cap ital Region (NCR) of India namely Safdarjung, Palam, Gurgaon and Roht ak for the past few decades and their asso ciation with the developmen t through urbanization pro cesses. The annual mean maximum temperature did not show any specific trend; however a consistent increasing trend was seen in the annual mean minimum temperatures indicating an overall warming trend over the NCR especially after 1990. This warming trend is contrary to the cooling trend observed by earlier studies till 1980’s in various other cities of India including Delhi. However, the temperature trends in annual mean minimum temperatures reported in various countries (USA, Turkey, Italy, etc.) across the world showed warming trends to be associated to the urbanization process of the cities also. The current warming trends in temperature in the NCR Delhi based on the annual mean minimum temperatures have thus been supported by the trends in other parts of the world and could b e utilized to infer the development proc- ess in this region. The urbanization pattern within Delhi is reflected by the trends of differences in annual mean mini- mum temperature of the two stations within the city namely Safdarjung and Palam. The significance of the warming trends of the annual minimum temperature for the urban heat island effect is also discussed. Keywords: Urban Heat Island, Temperature Trends, Urbanization, National Capital Region Delhi 1. Introduction Urban Heat Island (UHI) is considered as one of the ma- jor problems in the 21st century posed to human beings as a result of industrialization and urbanization [1]. No doubt, industrialization and urbanization improves our material lives and comfort; however, many problems are induced by these processes such as urban heat islands, global warming, air pollution, etc. Significant research efforts have been undertaken to evaluate the impact of UHI on the urban environment in different parts of the world [2-5]. The deterioration of the living environment, increase in the cooling energy requirements [6], elevation in the ground level ozone [7] and even an increase in the mortality rates [8] are some of the few ill effects of urban heat islands. The mass scale deforestation, the reduction in the green cover, the increase in the built-up land, the use of materials like concrete, asphalt, tar, etc. have sig- nificantly altered the energy balance of the urban area often causing the temperature to reach relatively higher value than its surroundings. It is also believed that air pollutants, in particular aerosols, can absorb and re- radi- ate long wave radiation and inhibit the corresponding radiative surface cooling producing a pseudo-green house effect that may contribute towards the urban heat island effect [1]. Kadioglu [9] studied the surface air temperature trends in Turkey and concluded that night time temperatures have a comparatively significant in- crease while day time temperatures remain unchanged over the study area. Cayan and Douglas [10] studied the urban influences on surface temperatures in the South - Western United States for the period 1930-1980 and concluded that urban warming appears to be predomi- nantly a night time phenomenon, with minimum tem- 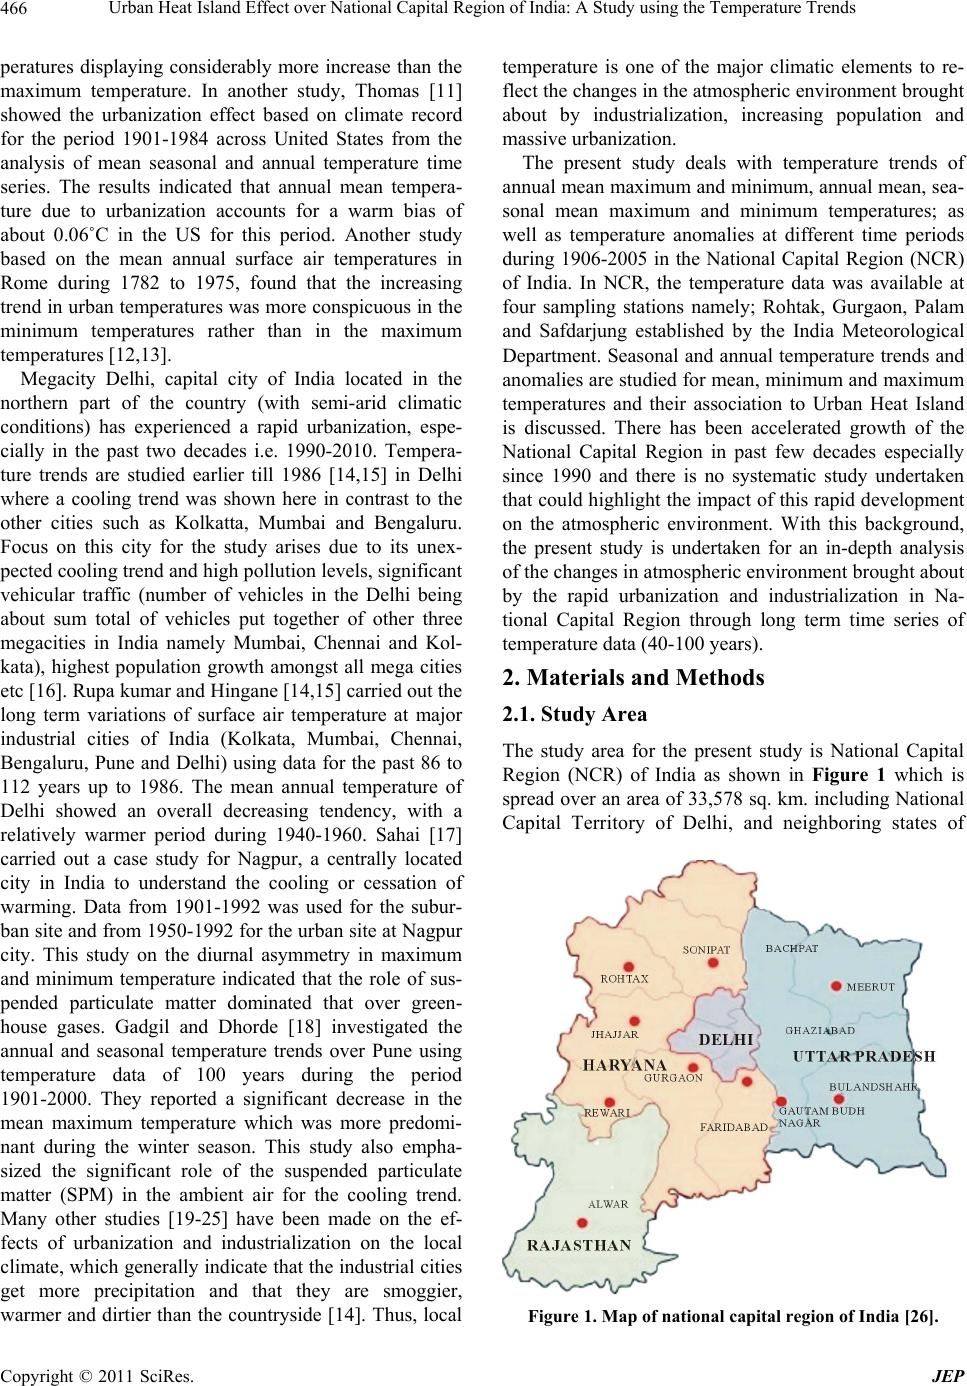 Urban Heat Island Effect over National Capital Region of India: A Study using the Temperature Trends 466 peratures displaying considerably more increase than the maximum temperature. In another study, Thomas [11] showed the urbanization effect based on climate record for the period 1901-1984 across United States from the analysis of mean seasonal and annual temperature time series. The results indicated that annual mean tempera- ture due to urbanization accounts for a warm bias of about 0.06˚C in the US for this period. Another study based on the mean annual surface air temperatures in Rome during 1782 to 1975, found that the increasing trend in urban temperatures was more conspicuous in the minimum temperatures rather than in the maximum temperatures [12,13]. Megacity Delhi, capital city of India located in the northern part of the country (with semi-arid climatic conditions) has experienced a rapid urbanization, espe- cially in the past two decades i.e. 1990-2010. Tempera- ture trends are studied earlier till 1986 [14,15] in Delhi where a cooling trend was shown here in contrast to the other cities such as Kolkatta, Mumbai and Bengaluru. Focus on this city for the study arises due to its unex- pected cooling trend and high pollution levels, significant vehicular traffic (number of vehicles in the Delhi being about sum total of vehicles put together of other three megacities in India namely Mumbai, Chennai and Kol- kata), highest population growth amongst all mega cities etc [16]. Rupa kumar and Hingane [14,15] carried out the long term variations of surface air temperature at major industrial cities of India (Kolkata, Mumbai, Chennai, Bengaluru, Pune and Delhi) using data for the past 86 to 112 years up to 1986. The mean annual temperature of Delhi showed an overall decreasing tendency, with a relatively warmer period during 1940-1960. Sahai [17] carried out a case study for Nagpur, a centrally located city in India to understand the cooling or cessation of warming. Data from 1901-1992 was used for the subur- ban site and from 1950-1992 for the urban site at Nagpur city. This study on the diurnal asymmetry in maximum and minimum temperature indicated that the role of sus- pended particulate matter dominated that over green- house gases. Gadgil and Dhorde [18] investigated the annual and seasonal temperature trends over Pune using temperature data of 100 years during the period 1901-2000. They reported a significant decrease in the mean maximum temperature which was more predomi- nant during the winter season. This study also empha- sized the significant role of the suspended particulate matter (SPM) in the ambient air for the cooling trend. Many other studies [19-25] have been made on the ef- fects of urbanization and industrialization on the local climate, which generally indicate that the industrial cities get more precipitation and that they are smoggier, warmer and dirtier than the countryside [14]. Thus, local temperature is one of the major climatic elements to re- flect the changes in the atmospheric environment brought about by industrialization, increasing population and massive urbanization. The present study deals with temperature trends of annual mean maximum and minimum, annual mean, sea- sonal mean maximum and minimum temperatures; as well as temperature anomalies at different time periods during 1906-2005 in the National Capital Region (NCR) of India. In NCR, the temperature data was available at four sampling stations namely; Rohtak, Gurgaon, Palam and Safdarjung established by the India Meteorological Department. Seasonal and annual temperature trends and anomalies are studied for mean, minimum and maximum temperatures and their association to Urban Heat Island is discussed. There has been accelerated growth of the National Capital Region in past few decades especially since 1990 and there is no systematic study undertaken that could highlight the impact of this rapid development on the atmospheric environment. With this background, the present study is undertaken for an in-depth analysis of the changes in atmospheric environment brought about by the rapid urbanization and industrialization in Na- tional Capital Region through long term time series of temperature data (40-100 years). 2. Materials and Methods 2.1. Study Area The study area for the present study is National Capital Region (NCR) of India as shown in Figure 1 which is spread over an area of 33,578 sq. km. including National Capital Territory of Delhi, and neighboring states of Figure 1. Map of national capital region of India [26]. Copyright © 2011 SciRes. JEP  Urban Heat Island Effect over National Capital Region of India: A Study using the Temperature Trends467 Haryana, Rajasthan and Uttar Pradesh (UP). The popula- tion of NCR, as per 2001 census, was 11.5 million with an average decadal rate of growth of about 29 % in the last three decades. UP accounts for 31.2% of the total NCR population while National Capital Territory, Delhi contributes 37.2%, Haryana contributes 23.5% and Ra- jasthan contributes 8.1%, as per 2001 census. A brief description of the stations in study area is given here. Gurgaon is the sixth largest city in the Indian state of Haryana. According to the 2001 India census, Gurgaon has a population of about 172,955. Gurgaon has grown extensively during the last decade due to its proximity to West Delhi and South Delhi and its emergence as a ma- jor outsourcing destination and as a real estate market in northern India. Rohtak district is located in southeastern part of Haryana State and constitutes a major part of eastern Haryana plain. Due to proximity to National capital, the developmental activities are taking place very rapidly. The district has witnessed rapid industrialization, urbanization, diversification in agriculture and change in occupation structure. Palam is a bustling residential area located about 18 km south-west of Connaught Place, in South West Delhi District. Dwarka - Asia’s largest resi- dential colony is located next to Palam. Indira Gandhi International Airport is located at Palam. Safdarjung is also a residential area. Colonies are primarily residential, and are bases for the affluent upper class. Safdarjung airport, formerly Delhi’s main airport and now used for trainees and small flights, is also located in this area. The climate of NCR is mainly influenced by its inland position and the prevalence of continental air during a major part of the year and has extreme climatic conditions. Delhi has three distinct seasons namely; summer, mon- soon and winter. The summer season (March, April, May and June) is governed by high temperature and hot, high speed winds. The monsoon (July, August and first half of September) is dominated by rains and high humidity lev- els in air. The winter season starts in late November and ends with the month of early February. This period is do- minated by cold, dry air and ground-based inversion with low wind conditions. The months of February and March are also referred to as spring period and the months of October and November constitutes postmonsoon season. 2.2. Data Historical data in NCR for four meteorological stations (one each at Rohtak, Gurgaon, Palam and Safdarjung) was made available by Indian Meteorological Depart- ment (IMD). For Safdarjung station, monthly average data (both maximum and minimum) was available form 1906-2005, for Gurgoan it was from 1968-1999 while for the remaining two stations i.e. Rohtak and Palam it was from 1968-2005. The extent of the data availability was nearly 100% for both Safdarjung and Palam while it was 86% for Rohtak and 82% for Gurgoan. The meteoro- logical stations were at the same place throughout the mentioned time period respectively. 2.3. Methodology for Trend Analysis Seasonal and annual temperature trends and anomalies are studied for mean, minimum and maximum tempera- tures. For seasonal analysis, the monthly data was further averaged with respect to the season. For trend analysis, polynomial trend line of order 5 was used that is selected based on trial and error method for various orders of polynomial fitting and the resulting correlation coeffi- cients. Temperature anomaly was calculated by the for- mula Δt = T0 - Tavg where Δt is the temperature anomaly, T0 is the annual average temperature (either maximum or minimum as the case may be) and Tavg is the overall av- erage of the temperature for the study period for maxi- mum or minimum. Mean temperature is based on the average of the mean minimum and mean maximum tem- peratures. Significance test at 95% confidence level was performed to assess the usability of the trends in data. 3. Results and Discussion It is concluded from various studies discussed in section 1 of this paper that urban warming appears to be pre- dominantly a night time phenomenon, with minimum temperatures displaying considerably more increase than the maximum temperature. Further, it was shown that increasing trend in urban temperatures was more con- spicuous in the minimum temperatures rather than in the maximum temperatures [13]. It is noted from the significance test (at 95% confi- dence level) that there is presence of trend in minimum temperatures while no specific trend in the maximum and mean temperatures exist. The significance test showed autocorrelation coefficients between 0.524 to 0.738 for the minimum temperatures for the four stations while that for maximum temperatures and mean temperatures these values are low and ranged from 0.011 to 0.254 and 0.054 to 0.398 respectively. Therefore further discussion considers all trends based mostly on minimum tempera- tures. Furthermore, due to the availability of complete data as long time series of two stations within Delhi i.e. Safdarjung and Palam, the temperature anomalies amongst these stations has also been studied and detailed infer- ences are discussed separately. Seasonal and annual analysis of the temperature trends based on the data de- scribed in section 2.2 is discussed below: 3.1. Temperature Trends at the Four Meteorological Stations of NCR The following text describes the temperature trends and Copyright © 2011 SciRes. JEP  Urban Heat Island Effect over National Capital Region of India: A Study using the Temperature Trends 468 anomalies based on annual mean minimum temperatures and that of the four seasons respectively in National Capital Region at Safdarjung, Palam, Gurgaon and Rohtak. The trends are depicted through figures as well. Figure 2(a) and Figure 2(b) describe the annual mean minimum temperatures along with the trend line (as shown by the dotted line in the figure) at Safdarjung and Palam respectively while Figures 3, 4, 5 and 6 describe the annual and seasonal mean minimum temperature along with the trend line at Safdarjung, Palam, Gurgaon and Rohtak respectively. The annual and seasonal trends at each of these stations are discussed below: 1) Safdarjung: The annual mean minimum temperature trend indi- cates, in general, a warming trend since 1950 barring few years in mid eighties. In general summer and winter seasons show a warm- ing trend except few years in summer season in early eighties and in late nineties during winter season. A consistent warming trend was observed while ana- lyzing the seasonal mean minimum temperature for the monsoon season during 1968-2005. A warming trend was observed for the seasonal mean minimum temperature for the post-monsoon season after 1992 barring past few years. Out of the four stations covered in the present study, Annual Mean Minimum Temperature at Safdarjung 1906-2005 17.00 18.00 19.00 20.00 21.00 1906 1911 1916 1921 1926 1931 1936 1941 1946 1951 1956 1961 1966 1971 1976 1981 1986 1991 1996 2001 Years Temperature (deg C ) Safdarjung Poly. (Safdarjung) years Temperature (deg C) (a) Annual Mean Minimum Temperature at Palam 1968-2005 16.0 17.0 18.0 19.0 20.0 1968 1971 1974 1977 1980 1983 1986 1989 1992 1995 1998 2001 2004 Years Temp e ratu re (d eg C) Palam Poly. (Palam) years Temperature (deg C) (b) Figure 2. (a). Annual mean minimum temperature at saf- darjung during 1906 - 2005; (b) Annual mean minimum temperature at palam during 1968 - 2005. Annual and Seas onal Minimum T emperature Vari at ions a t Safdarjung (1968 - 2005) 5.00 10.00 15.00 20.00 25.00 30.00 1968 1971 1974 1977 1980 1983 1986 1989 1992 1995 1998 2001 2004 Y Temperature (deg C ) Winter Summer Monsoon Post MonsoonAnnual Average Temperature (deg C) years Figure 3. Annual and Seasonal Mean Minimum Tempera- tures at Safdarjung during 1968 - 2005 Annual and Seasonal Minimum Tem p erature Variations at Palam (1968 - 2005) 5.00 10.00 15.00 20.00 25.00 30.00 1968 1971 1974 1977 1980 1983 1986 1989 1992 1995 1998 2001 2004 Year s Temperature (deg C ) Winter Summer Monsoon Post MonsoonAnnual Average years Temperature (deg C) Figure 4. Annual and Seasonal Mean Minimum Tempera- tures at Palam during 1968 - 2005. Copyright © 2011 SciRes. JEP 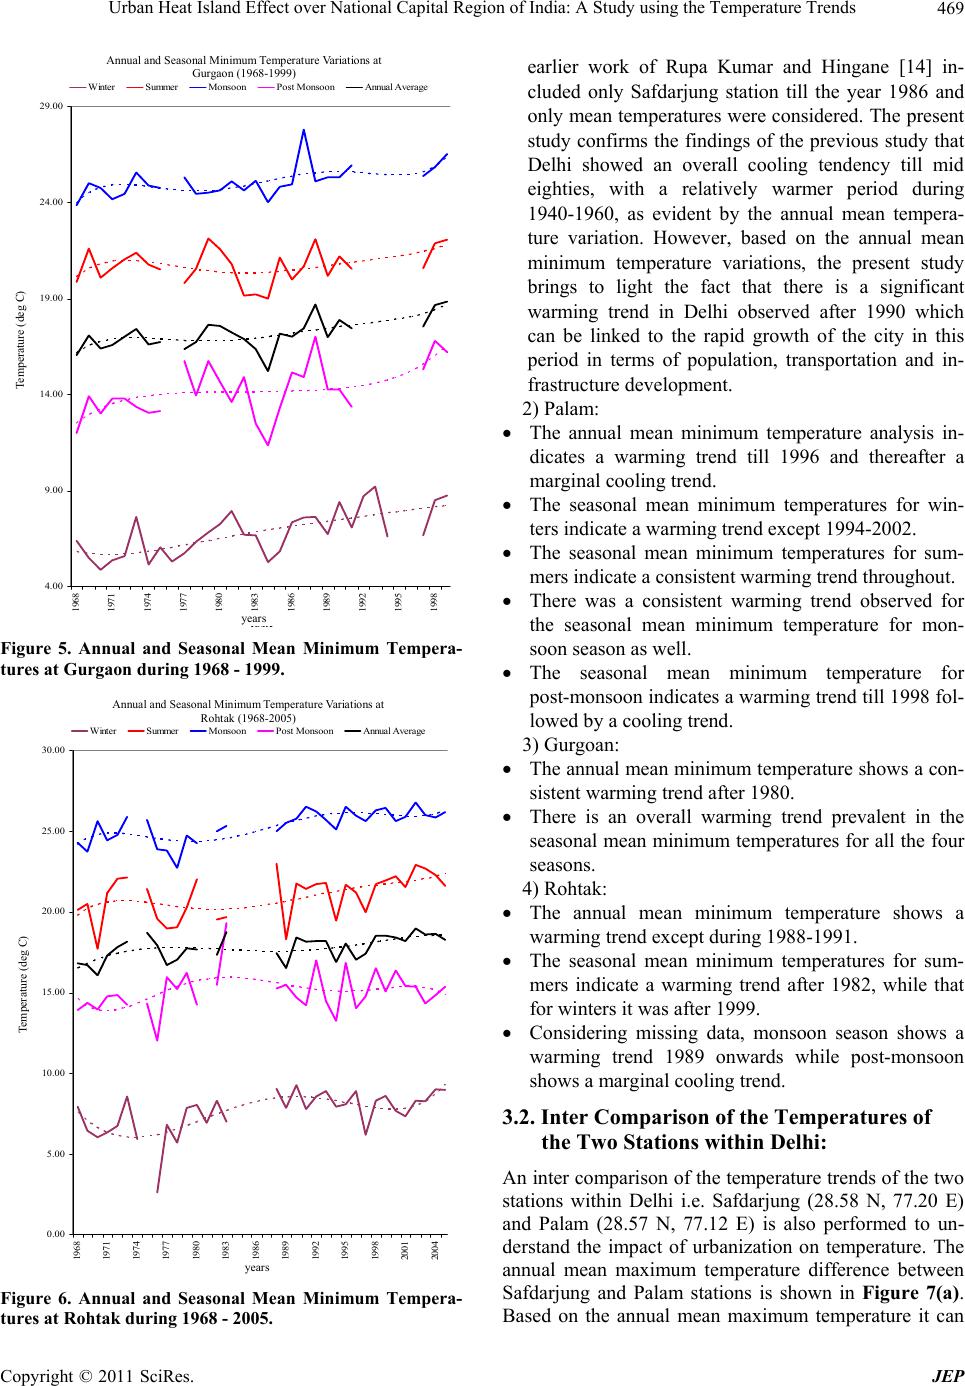 Urban Heat Island Effect over National Capital Region of India: A Study using the Temperature Trends469 Annua l and Seasonal Minimum Temperature Variations at Gurgoan (1968 - 1999) 4.00 9.00 14.00 19.00 24.00 29.00 1968 1971 1974 1977 1980 1983 1986 1989 1992 1995 1998 Year s Tem perature ( deg C ) Winter SummerMonsoon Post MonsoonAnnual Average years Temperature (deg C) Annual and Seasonal Minimum Temperature Variations at Gurgaon (1968-1999) Figure 5. Annual and Seasonal Mean Minimum Tempera- tures at Gurgaon during 1968 - 1999. p Rohtak (1968 - 2005) 0.00 5.00 10.00 15.00 20.00 25.00 30.00 1968 1971 1974 1977 1980 1983 1986 1989 1992 1995 1998 2001 2004 Years Temperature (deg C ) Winter Summer MonsoonPost MonsoonAnnual Average years Temperature (deg C) Annual and Seasonal Minimum Temperature Variations at Rohtak (1968-2005) Figure 6. Annual and Seasonal Mean Minimum Tempera- tures at Rohtak during 1968 - 2005. earlier work of Rupa Kumar and Hingane [14] in- cluded only Safdarjung station till the year 1986 and only mean temperatures were considered. The present study confirms the findings of the previous study that Delhi showed an overall cooling tendency till mid eighties, with a relatively warmer period during 1940-1960, as evident by the annual mean tempera- ture variation. However, based on the annual mean minimum temperature variations, the present study brings to light the fact that there is a significant warming trend in Delhi observed after 1990 which can be linked to the rapid growth of the city in this period in terms of population, transportation and in- frastructure development. 2) Palam: The annual mean minimum temperature analysis in- dicates a warming trend till 1996 and thereafter a marginal cooling trend. The seasonal mean minimum temperatures for win- ters indicate a warming trend except 1994-2002. The seasonal mean minimum temperatures for sum- mers indicate a consistent warming trend throughout. There was a consistent warming trend observed for the seasonal mean minimum temperature for mon- soon season as well. The seasonal mean minimum temperature for post-monsoon indicates a warming trend till 1998 fol- lowed by a cooling trend. 3) Gurgoan: The annual mean minimum temperature shows a con- sistent warming trend after 1980. There is an overall warming trend prevalent in the seasonal mean minimum temperatures for all the four seasons. 4) Rohtak: The annual mean minimum temperature shows a warming trend except during 1988-1991. The seasonal mean minimum temperatures for sum- mers indicate a warming trend after 1982, while that for winters it was after 1999. Considering missing data, monsoon season shows a warming trend 1989 onwards while post-monsoon shows a marginal cooling trend. 3.2. Inter Comparison of the Temperatures of the Two Stations within Delhi: An inter comparison of the temperature trends of the two stations within Delhi i.e. Safdarjung (28.58 N, 77.20 E) and Palam (28.57 N, 77.12 E) is also performed to un- derstand the impact of urbanization on temperature. The annual mean maximum temperature difference between Safdarjung and Palam stations is shown in Figure 7(a). Based on the annual mean maximum temperature it can Copyright © 2011 SciRes. JEP 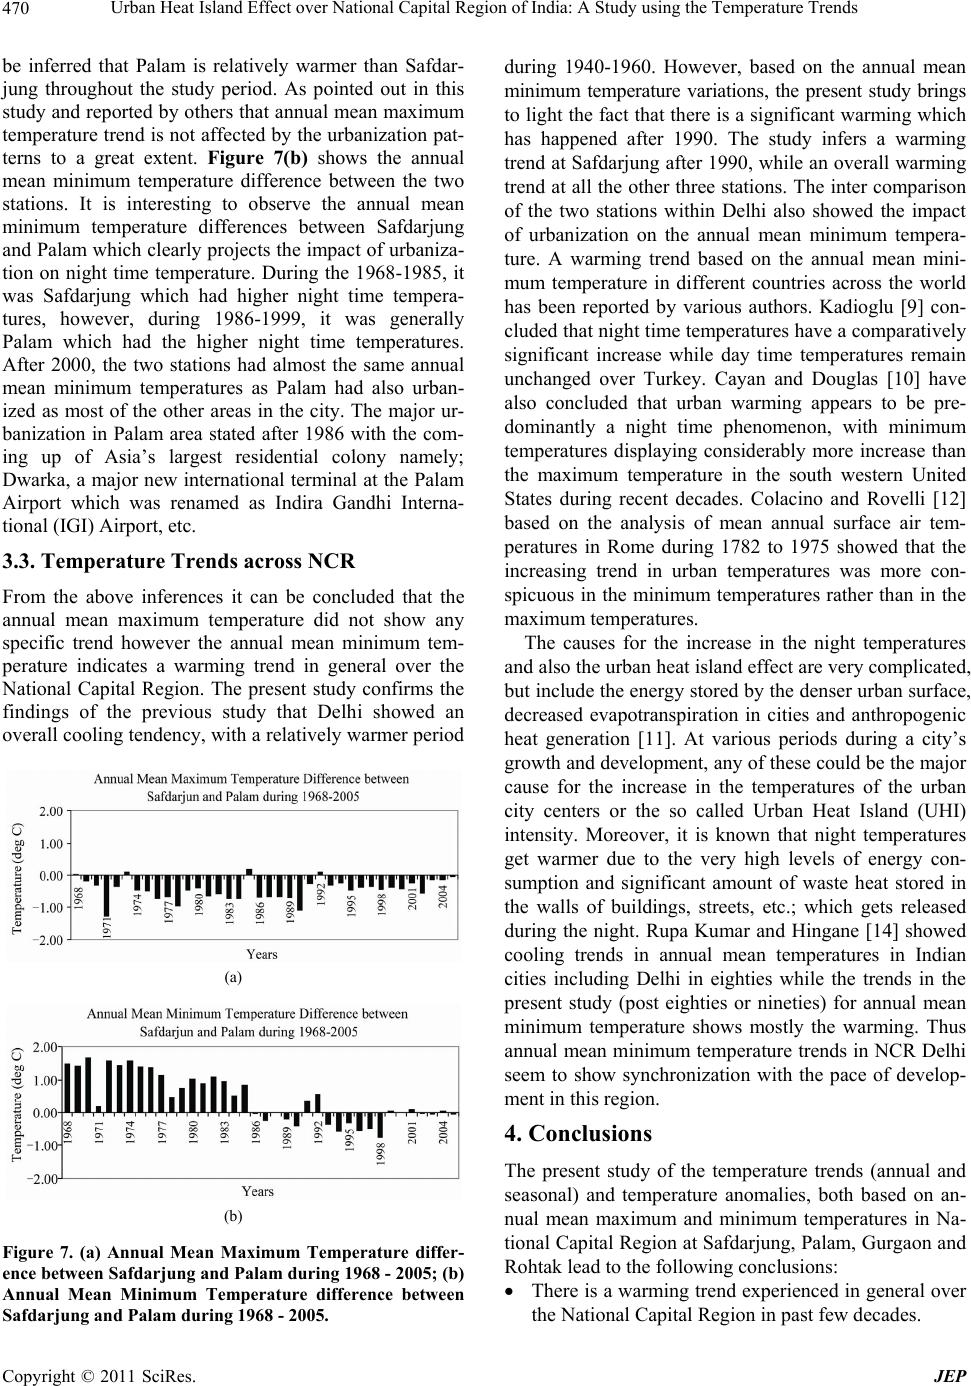 Urban Heat Island Effect over National Capital Region of India: A Study using the Temperature Trends 470 be inferred that Palam is relatively warmer than Safdar- jung throughout the study period. As pointed out in this study and reported by others that annual mean maximum temperature trend is not affected by the urbanization pat- terns to a great extent. Figure 7(b) shows the annual mean minimum temperature difference between the two stations. It is interesting to observe the annual mean minimum temperature differences between Safdarjung and Palam which clearly projects the impact of urbaniza- tion on night time temperature. During the 1968-1985, it was Safdarjung which had higher night time tempera- tures, however, during 1986-1999, it was generally Palam which had the higher night time temperatures. After 2000, the two stations had almost the same annual mean minimum temperatures as Palam had also urban- ized as most of the other areas in the city. The major ur- banization in Palam area stated after 1986 with the com- ing up of Asia’s largest residential colony namely; Dwarka, a major new international terminal at the Palam Airport which was renamed as Indira Gandhi Interna- tional (IGI) Airport, etc. 3.3. Temperature Trends across NCR From the above inferences it can be concluded that the annual mean maximum temperature did not show any specific trend however the annual mean minimum tem- perature indicates a warming trend in general over the National Capital Region. The present study confirms the findings of the previous study that Delhi showed an overall cooling tendency, with a relatively warmer period (a) (b) Figure 7. (a) Annual Mean Maximum Temperature differ- ence between Safdarjung and Palam during 1968 - 2005; (b) Annual Mean Minimum Temperature difference between Safdarjung and Palam during 1968 - 2005. during 1940-1960. However, based on the annual mean minimum temperature variations, the present study brings to light the fact that there is a significant warming which has happened after 1990. The study infers a warming trend at Safdarjung after 1990, while an overall warming trend at all the other three stations. The inter comparison of the two stations within Delhi also showed the impact of urbanization on the annual mean minimum tempera- ture. A warming trend based on the annual mean mini- mum temperature in different countries across the world has been reported by various authors. Kadioglu [9] con- cluded that night time temperatures have a comparatively significant increase while day time temperatures remain unchanged over Turkey. Cayan and Douglas [10] have also concluded that urban warming appears to be pre- dominantly a night time phenomenon, with minimum temperatures displaying considerably more increase than the maximum temperature in the south western United States during recent decades. Colacino and Rovelli [12] based on the analysis of mean annual surface air tem- peratures in Rome during 1782 to 1975 showed that the increasing trend in urban temperatures was more con- spicuous in the minimum temperatures rather than in the maximum temperatures. The causes for the increase in the night temperatures and also the urban heat island effect are very complicated, but include the energy stored by the denser urban surface, decreased evapotranspiration in cities and anthropogenic heat generation [11]. At various periods during a city’s growth and development, any of these could be the major cause for the increase in the temperatures of the urban city centers or the so called Urban Heat Island (UHI) intensity. Moreover, it is known that night temperatures get warmer due to the very high levels of energy con- sumption and significant amount of waste heat stored in the walls of buildings, streets, etc.; which gets released during the night. Rupa Kumar and Hingane [14] showed cooling trends in annual mean temperatures in Indian cities including Delhi in eighties while the trends in the present study (post eighties or nineties) for annual mean minimum temperature shows mostly the warming. Thus annual mean minimum temperature trends in NCR Delhi seem to show synchronization with the pace of develop- ment in this region. 4. Conclusions The present study of the temperature trends (annual and seasonal) and temperature anomalies, both based on an- nual mean maximum and minimum temperatures in Na- tional Capital Region at Safdarjung, Palam, Gurgaon and Rohtak lead to the following conclusions: There is a warming trend experienced in general over the National Capital Region in past few decades. Copyright © 2011 SciRes. JEP 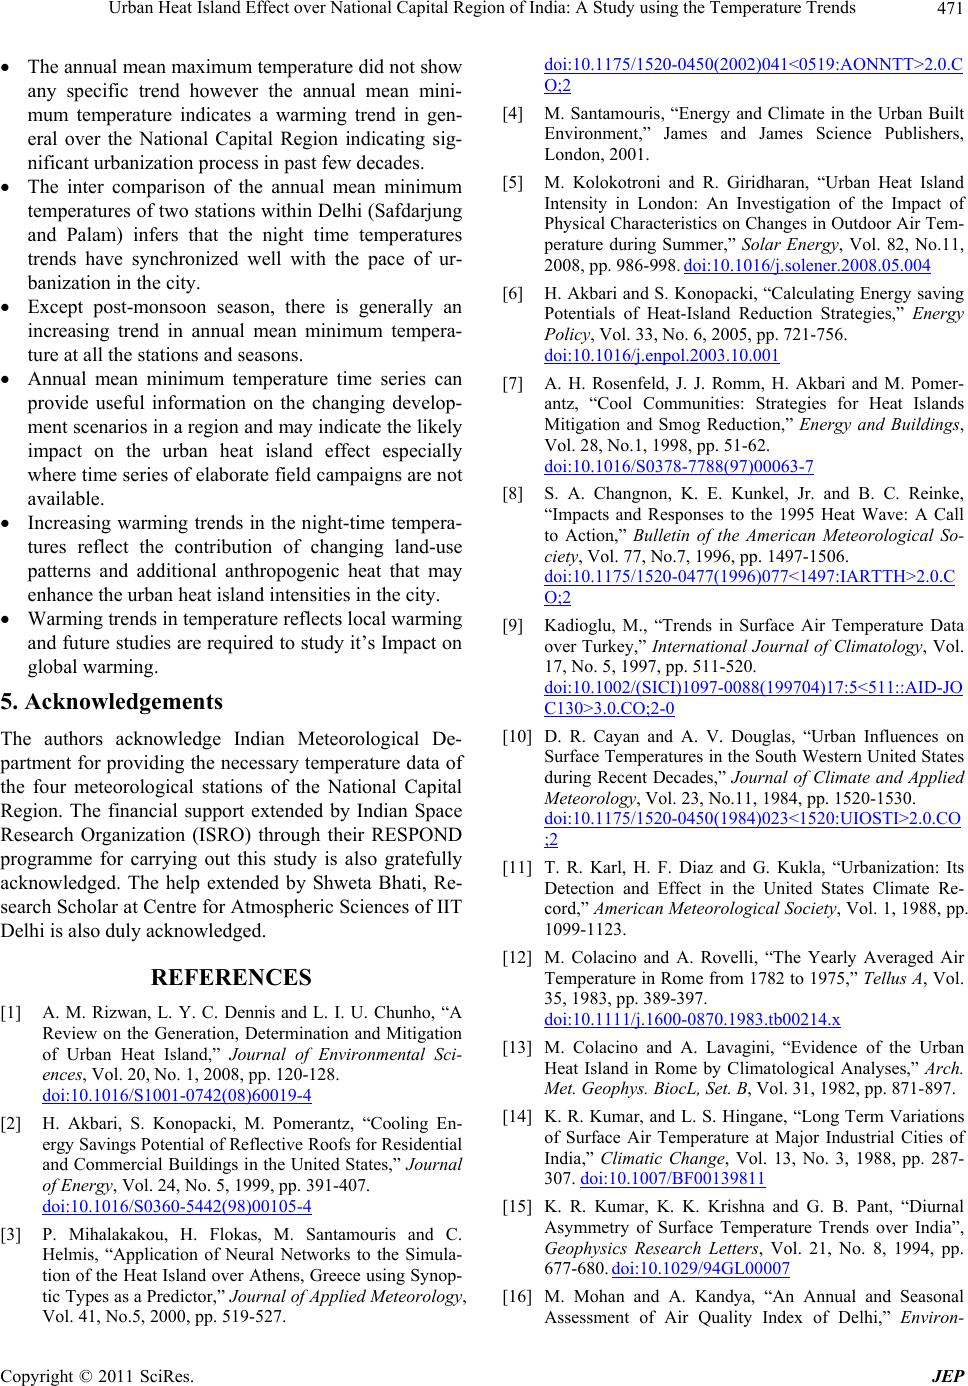 Urban Heat Island Effect over National Capital Region of India: A Study using the Temperature Trends471 The annual mean maximum temperature did not show any specific trend however the annual mean mini- mum temperature indicates a warming trend in gen- eral over the National Capital Region indicating sig- nificant urbanization process in past few decades. The inter comparison of the annual mean minimum temperatures of two stations within Delhi (Safdarjung and Palam) infers that the night time temperatures trends have synchronized well with the pace of ur- banization in the city. Except post-monsoon season, there is generally an increasing trend in annual mean minimum tempera- ture at all the stations and seasons. Annual mean minimum temperature time series can provide useful information on the changing develop- ment scenarios in a region and may indicate the likely impact on the urban heat island effect especially where time series of elaborate field campaigns are not available. Increasing warming trends in the night-time tempera- tures reflect the contribution of changing land-use patterns and additional anthropogenic heat that may enhance the urban heat island intensities in the city. Warming trends in temperature reflects local warming and future studies are required to study it’s Impact on global warming. 5. Acknowledgements The authors acknowledge Indian Meteorological De- partment for providing the necessary temperature data of the four meteorological stations of the National Capital Region. The financial support extended by Indian Space Research Organization (ISRO) through their RESPOND programme for carrying out this study is also gratefully acknowledged. The help extended by Shweta Bhati, Re- search Scholar at Centre for Atmospheric Sciences of IIT Delhi is also duly acknowledged. REFERENCES [1] A. M. Rizwan, L. Y. C. Dennis and L. I. U. Chunho, “A Review on the Generation, Determination and Mitigation of Urban Heat Island,” Journal of Environmental Sci- ences, Vol. 20, No. 1, 2008, pp. 120-128. doi:10.1016/S1001-0742(08)60019-4 [2] H. Akbari, S. Konopacki, M. Pomerantz, “Cooling En- ergy Savings Potential of Reflective Roofs for Residential and Commercial Buildings in the United States,” Journal of Energy, Vol. 24, No. 5, 1999, pp. 391-407. doi:10.1016/S0360-5442(98)00105-4 [3] P. Mihalakakou, H. Flokas, M. Santamouris and C. Helmis, “Application of Neural Networks to the Simula- tion of the Heat Island over Athens, Greece using Synop- tic Types as a Predictor,” Journal of Applied Meteorology, Vol. 41, No.5, 2000, pp. 519-527. doi:10.1175/1520-0450(2002)041<0519:AONNTT>2.0.C O;2 [4] M. Santamouris, “Energy and Climate in the Urban Built Environment,” James and James Science Publishers, London, 2001. [5] M. Kolokotroni and R. Giridharan, “Urban Heat Island Intensity in London: An Investigation of the Impact of Physical Characteristics on Changes in Outdoor Air Tem- perature during Summer,” Solar Energy, Vol. 82, No.11, 2008, pp. 986-998. doi:10.1016/j.solener.2008.05.004 [6] H. Akbari and S. Konopacki, “Calculating Energy saving Potentials of Heat-Island Reduction Strategies,” Energy Policy, Vol. 33, No. 6, 2005, pp. 721-756. doi:10.1016/j.enpol.2003.10.001 [7] A. H. Rosenfeld, J. J. Romm, H. Akbari and M. Pomer- antz, “Cool Communities: Strategies for Heat Islands Mitigation and Smog Reduction,” Energy and Buildings, Vol. 28, No.1, 1998, pp. 51-62. doi:10.1016/S0378-7788(97)00063-7 [8] S. A. Changnon, K. E. Kunkel, Jr. and B. C. Reinke, “Impacts and Responses to the 1995 Heat Wave: A Call to Action,” Bulletin of the American Meteorological So- ciety, Vol. 77, No.7, 1996, pp. 1497-1506. doi:10.1175/1520-0477(1996)077<1497:IARTTH>2.0.C O;2 [9] Kadioglu, M., “Trends in Surface Air Temperature Data over Turkey,” International Journal of Climatology, Vol. 17, No. 5, 1997, pp. 511-520. doi:10.1002/(SICI)1097-0088(199704)17:5<511::AID-JO C130>3.0.CO;2-0 [10] D. R. Cayan and A. V. Douglas, “Urban Influences on Surface Temperatures in the South Western United States during Recent Decades,” Journal of Climate and Applied Meteorology, Vol. 23, No.11, 1984, pp. 1520-1530. doi:10.1175/1520-0450(1984)023<1520:UIOSTI>2.0.CO ;2 [11] T. R. Karl, H. F. Diaz and G. Kukla, “Urbanization: Its Detection and Effect in the United States Climate Re- cord,” American Meteorological Society, Vol. 1, 1988, pp. 1099-1123. [12] M. Colacino and A. Rovelli, “The Yearly Averaged Air Temperature in Rome from 1782 to 1975,” Tellus A, Vol. 35, 1983, pp. 389-397. doi:10.1111/j.1600-0870.1983.tb00214.x [13] M. Colacino and A. Lavagini, “Evidence of the Urban Heat Island in Rome by Climatological Analyses,” Arch. Met. Geophys. BiocL, Set. B, Vol. 31, 1982, pp. 871-897. [14] K. R. Kumar, and L. S. Hingane, “Long Term Variations of Surface Air Temperature at Major Industrial Cities of India,” Climatic Change, Vol. 13, No. 3, 1988, pp. 287- 307. doi:10.1007/BF00139811 [15] K. R. Kumar, K. K. Krishna and G. B. Pant, “Diurnal Asymmetry of Surface Temperature Trends over India”, Geophysics Research Letters, Vol. 21, No. 8, 1994, pp. 677-680. doi:10.1029/94GL00007 [16] M. Mohan and A. Kandya, “An Annual and Seasonal Assessment of Air Quality Index of Delhi,” Environ- Copyright © 2011 SciRes. JEP  Urban Heat Island Effect over National Capital Region of India: A Study using the Temperature Trends Copyright © 2011 SciRes. JEP 472 mental Monitoring and Assessment, Vol. 131, No. 1-3, 2007, pp. 267-277. doi:10.1007/s10661-006-9474-4 [17] A. K. Sahai, “Climate Change: A Case Study over India,” Theoretical and Applied Climatology, Vol. 61, No. 1-2, 1998, pp. 9-18. doi:10.1007/s007040050047 [18] A. Gadgil and A. Dhorde, “Temperature Trends in Twen- tieth Century at Pune, India,” Atmospheric Environment, Vol. 39, No. 35, 2005, pp. 6550-6556. doi:10.1016/j.atmosenv.2005.07.032 [19] C. Junge, “Recent Investigations in Air Chemistry,” Tel- lus, Vol. 8, No. 2, 1956, pp. 127-139. doi:10.1111/j.2153-3490.1956.tb01205.x [20] M. Parry, “An Urban Rainstorm in the Reading Area”, Weather, Vol. 11, 1956, pp. 41-48. [21] B. B. Hull, “Once-in-Hundred Year Rainstorm, Wash- ington, D.C. 4th September 1939,” Weatherwise, Vol. 10, No. 4, 1957, pp. 128-131. doi:10.1080/00431672.1957.9940962 [22] B. W. Atkinson, “The Effect of an Urban Area on the Precipitation from a Moving Thunderstorm,” Journal of Applied Meteorology, Vol. 10, No. 1, 1971, pp. 47-53. doi:10.1175/1520-0450(1971)010<0047:TEOAUA>2.0.C O;2 [23] B. J. Moffitt, “The Effects of Urbanization on Mean Temperatures at Kew Observatory,” Weather, Vol. 27, 1972, pp. 121-129. [24] E A. Huff, and S. A. Changnon, “Precipitation Modifica- tion of Major Urban Areas,” Bulletin of American Mete- orological Society, Vol. 54, No. 12, 1973, pp. 1220-1232. doi:10.1175/1520-0477(1973)054<1220:PMBMUA>2.0. CO;2 [25] “WMO Statement on Climatic Change,” World Meteoro- logical Organization Bulletin, Vol. 25, 1976, pp. 211- 212. |